
|
|||||
|
 | |
| |
| |
| |
| |
| |
|
Gene: PLAU |
Gene summary for PLAU |
| Gene information | Species | Human | Gene symbol | PLAU | Gene ID | 5328 |
| Gene name | plasminogen activator, urokinase | |
| Gene Alias | ATF | |
| Cytomap | 10q22.2 | |
| Gene Type | protein-coding | GO ID | GO:0001666 | UniProtAcc | P00749 |
Top |
Malignant transformation analysis |
| Identification of the aberrant gene expression in precancerous and cancerous lesions by comparing the gene expression of stem-like cells in diseased tissues with normal stem cells |
| Entrez ID | Symbol | Replicates | Species | Organ | Tissue | Adj P-value | Log2FC | Malignancy |
| 5328 | PLAU | Dong_P5 | Human | Prostate | Tumor | 1.59e-24 | -8.24e-01 | 0.053 |
| 5328 | PLAU | Dong_P6 | Human | Prostate | Tumor | 2.40e-10 | -8.64e-01 | 0.0371 |
| 5328 | PLAU | P10 | Human | Prostate | Tumor | 1.01e-09 | 2.56e-01 | -0.0902 |
| 5328 | PLAU | GSM5353221_PA_PB2A_Pool_1_3_S25_L001 | Human | Prostate | Tumor | 4.42e-02 | -5.79e-01 | 0.1633 |
| 5328 | PLAU | GSM5353222_PA_PB2B_Pool_1_3_S52_L002 | Human | Prostate | Tumor | 5.21e-10 | -7.73e-01 | 0.1608 |
| 5328 | PLAU | GSM5353223_PA_PB2B_Pool_2_S26_L001 | Human | Prostate | Tumor | 1.91e-02 | -6.31e-01 | 0.1604 |
| 5328 | PLAU | GSM5353224_PA_PR5186_Pool_1_2_3_S27_L001 | Human | Prostate | Tumor | 9.56e-05 | -7.34e-01 | 0.1621 |
| 5328 | PLAU | GSM5353227_PA_PR5199-193K_Pool_1_2_3_S55_L002 | Human | Prostate | Tumor | 8.05e-07 | -7.65e-01 | 0.1602 |
| 5328 | PLAU | GSM5353240_PA_PR5254_T1_S15_L001 | Human | Prostate | Tumor | 5.57e-13 | -7.92e-01 | 0.1575 |
| 5328 | PLAU | GSM5353243_PA_PR5261_T1_S23_L002 | Human | Prostate | Tumor | 1.37e-11 | -6.96e-01 | 0.1545 |
| 5328 | PLAU | GSM5353244_PA_PR5261_T2_S24_L002 | Human | Prostate | Tumor | 6.62e-12 | -8.11e-01 | 0.1569 |
| 5328 | PLAU | P1_S1_AK | Human | Skin | AK | 2.93e-03 | 3.19e-01 | -0.3399 |
| 5328 | PLAU | P2_S3_AK | Human | Skin | AK | 1.41e-07 | 4.08e-01 | -0.3287 |
| 5328 | PLAU | P2_S4_SCCIS | Human | Skin | SCCIS | 1.55e-10 | 4.29e-01 | -0.3043 |
| 5328 | PLAU | P5_S10_cSCC | Human | Skin | cSCC | 4.20e-25 | 4.28e-01 | -0.299 |
| 5328 | PLAU | P1_cSCC | Human | Skin | cSCC | 1.36e-08 | 8.93e-01 | 0.0292 |
| 5328 | PLAU | P2_cSCC | Human | Skin | cSCC | 1.48e-13 | 7.47e-01 | -0.024 |
| 5328 | PLAU | P4_cSCC | Human | Skin | cSCC | 7.92e-23 | 1.00e+00 | -0.00290000000000005 |
| 5328 | PLAU | P10_cSCC | Human | Skin | cSCC | 2.09e-43 | 2.57e+00 | 0.1017 |
| 5328 | PLAU | cSCC_p8 | Human | Skin | cSCC | 2.48e-02 | 4.31e-02 | -0.1971 |
| Page: 1 2 3 4 5 6 7 |
| Tissue | Expression Dynamics | Abbreviation |
| Cervix | 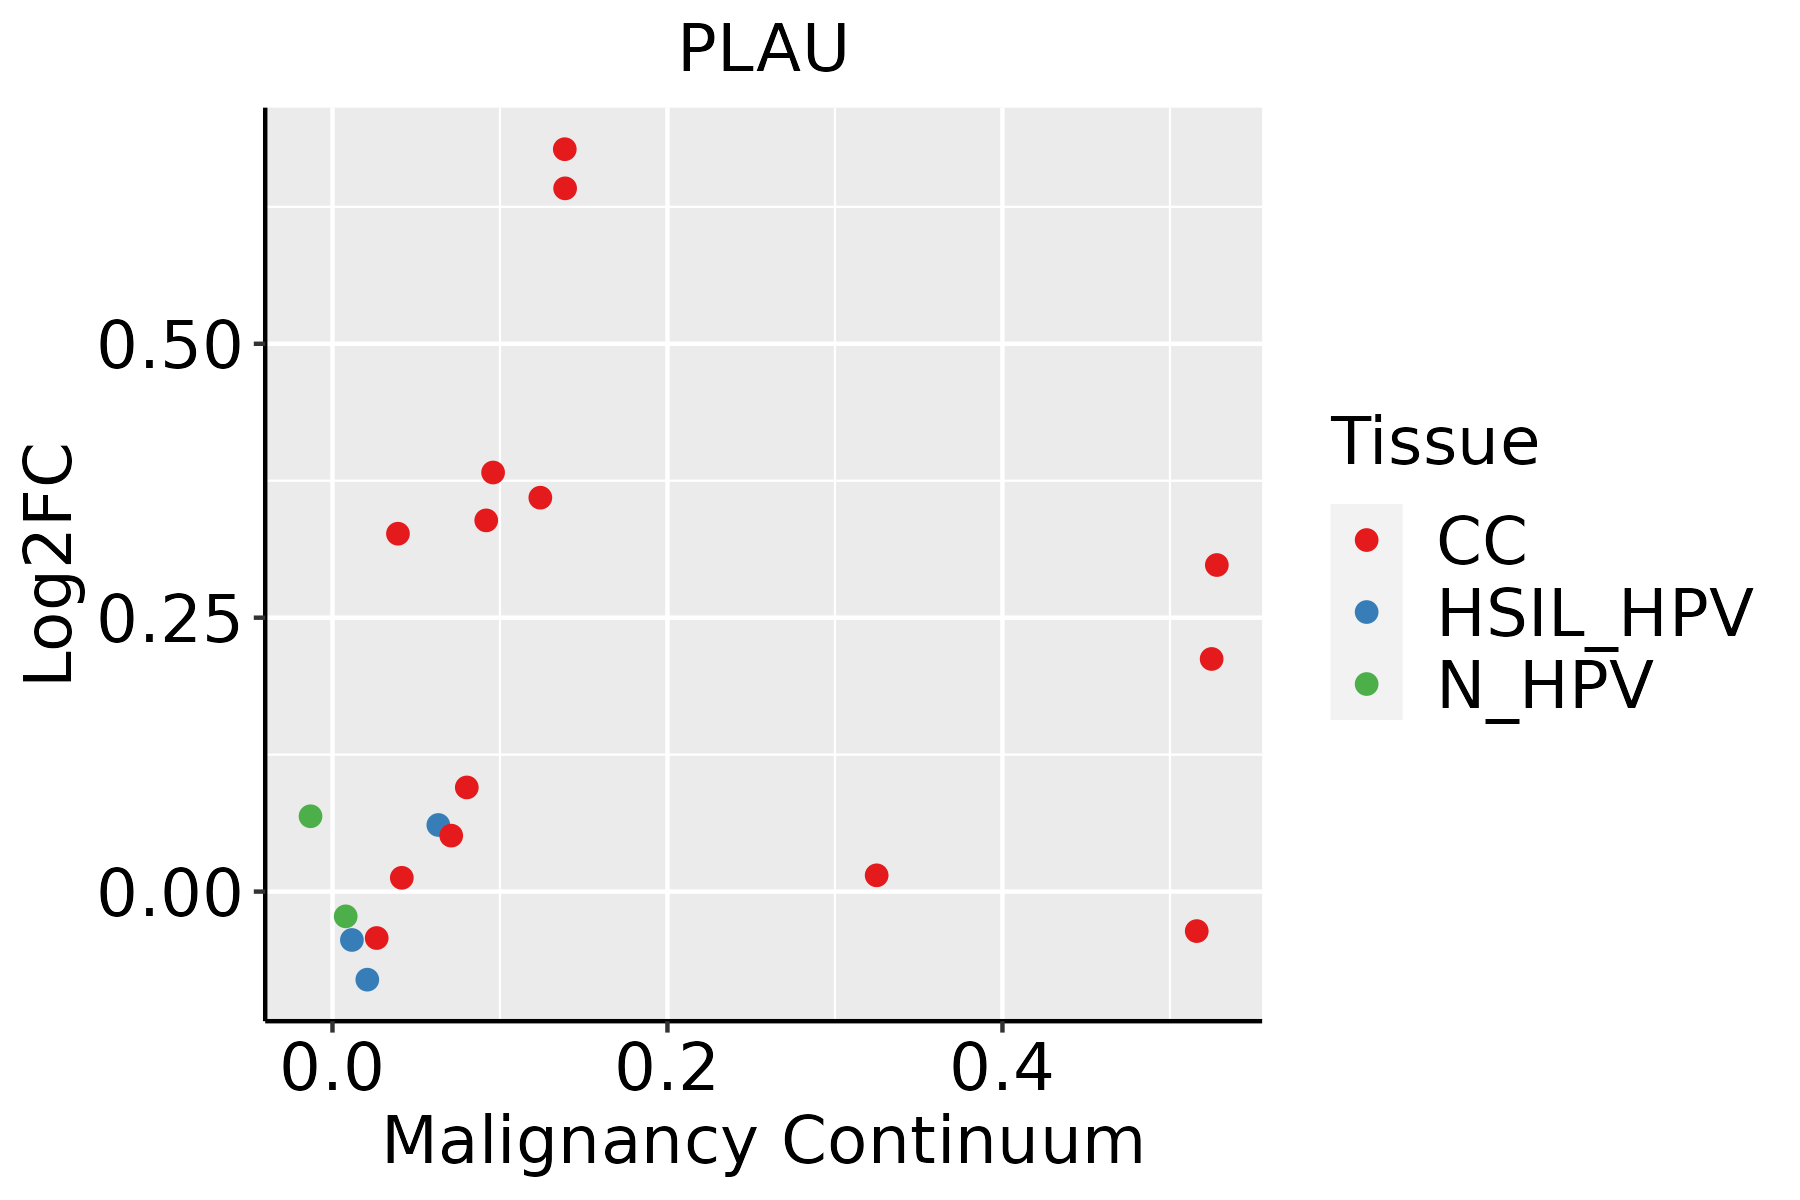 | CC: Cervix cancer |
| HSIL_HPV: HPV-infected high-grade squamous intraepithelial lesions | ||
| N_HPV: HPV-infected normal cervix | ||
| Esophagus |  | ESCC: Esophageal squamous cell carcinoma |
| HGIN: High-grade intraepithelial neoplasias | ||
| LGIN: Low-grade intraepithelial neoplasias | ||
| Oral Cavity | 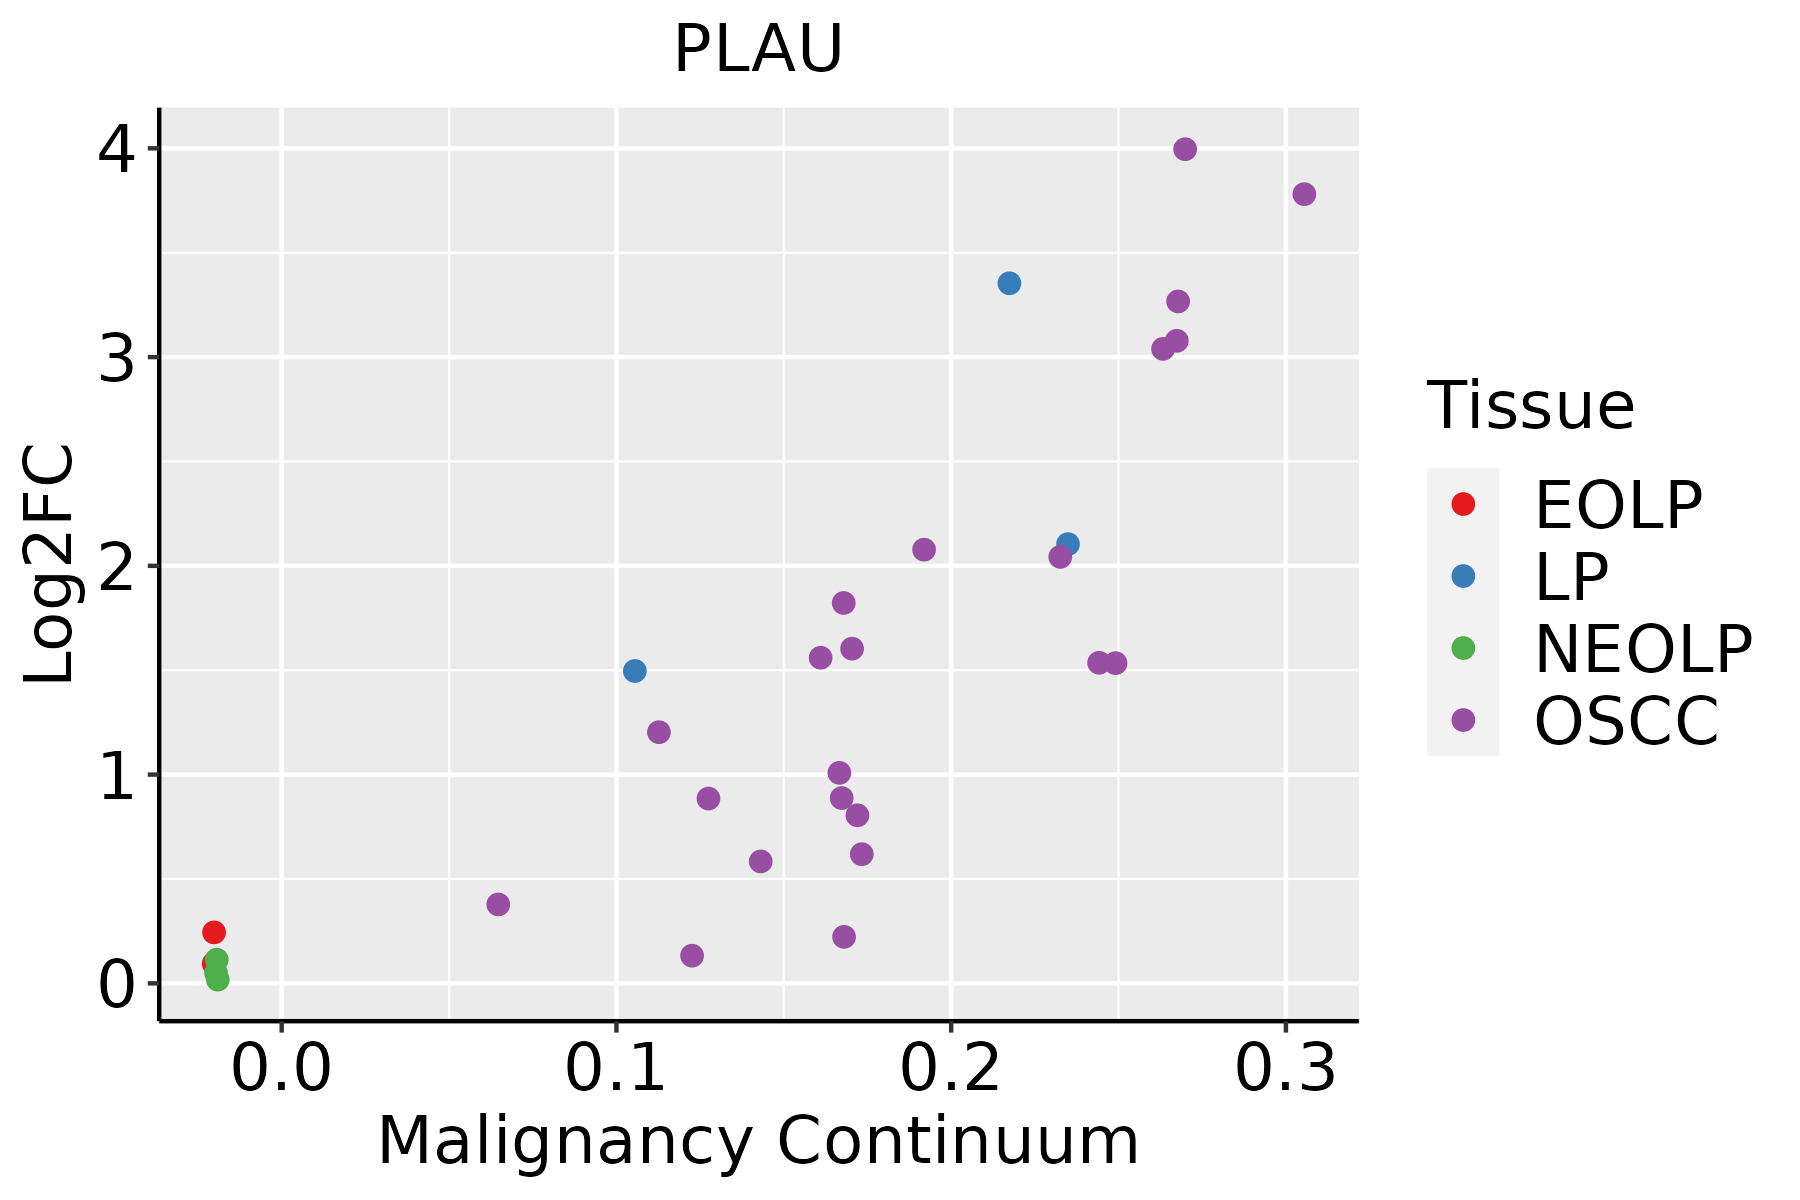 | EOLP: Erosive Oral lichen planus |
| LP: leukoplakia | ||
| NEOLP: Non-erosive oral lichen planus | ||
| OSCC: Oral squamous cell carcinoma | ||
| Prostate | 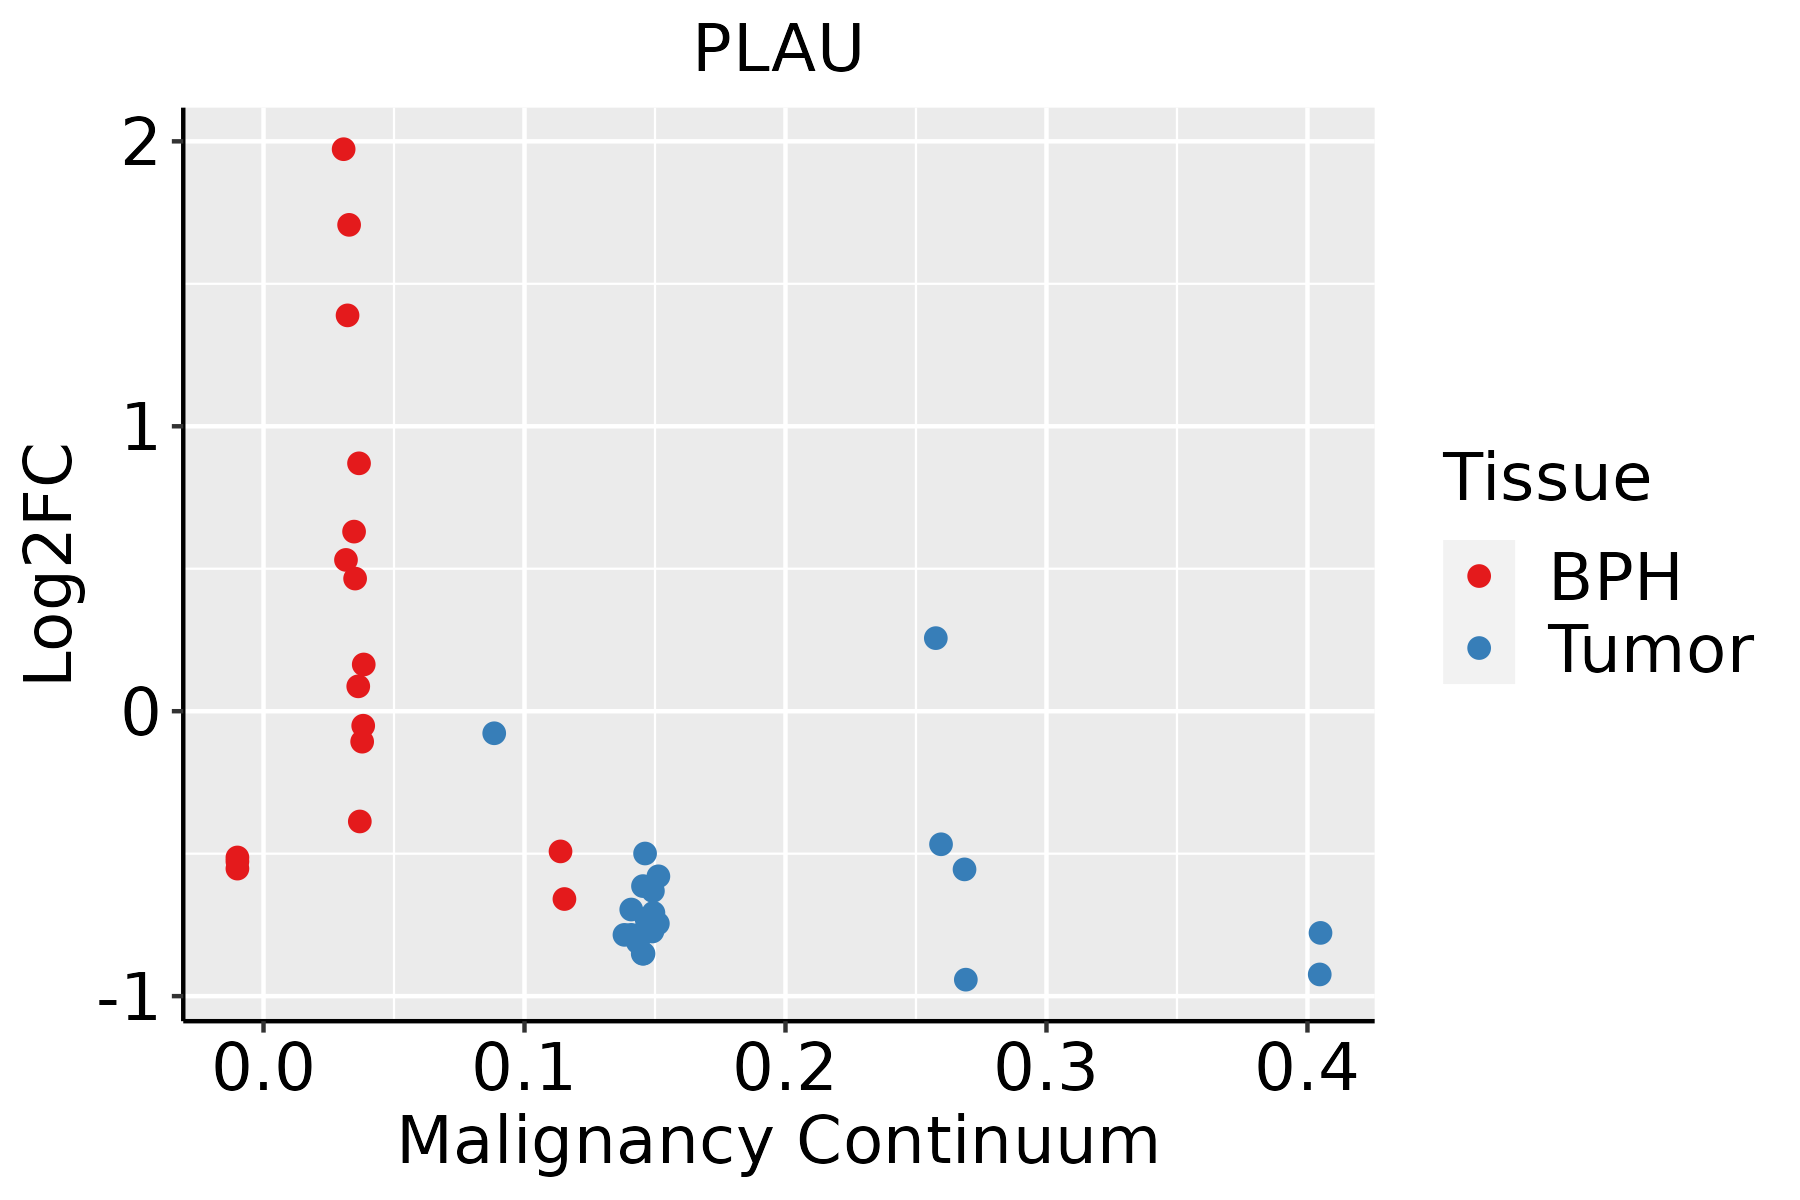 | BPH: Benign Prostatic Hyperplasia |
| Skin | 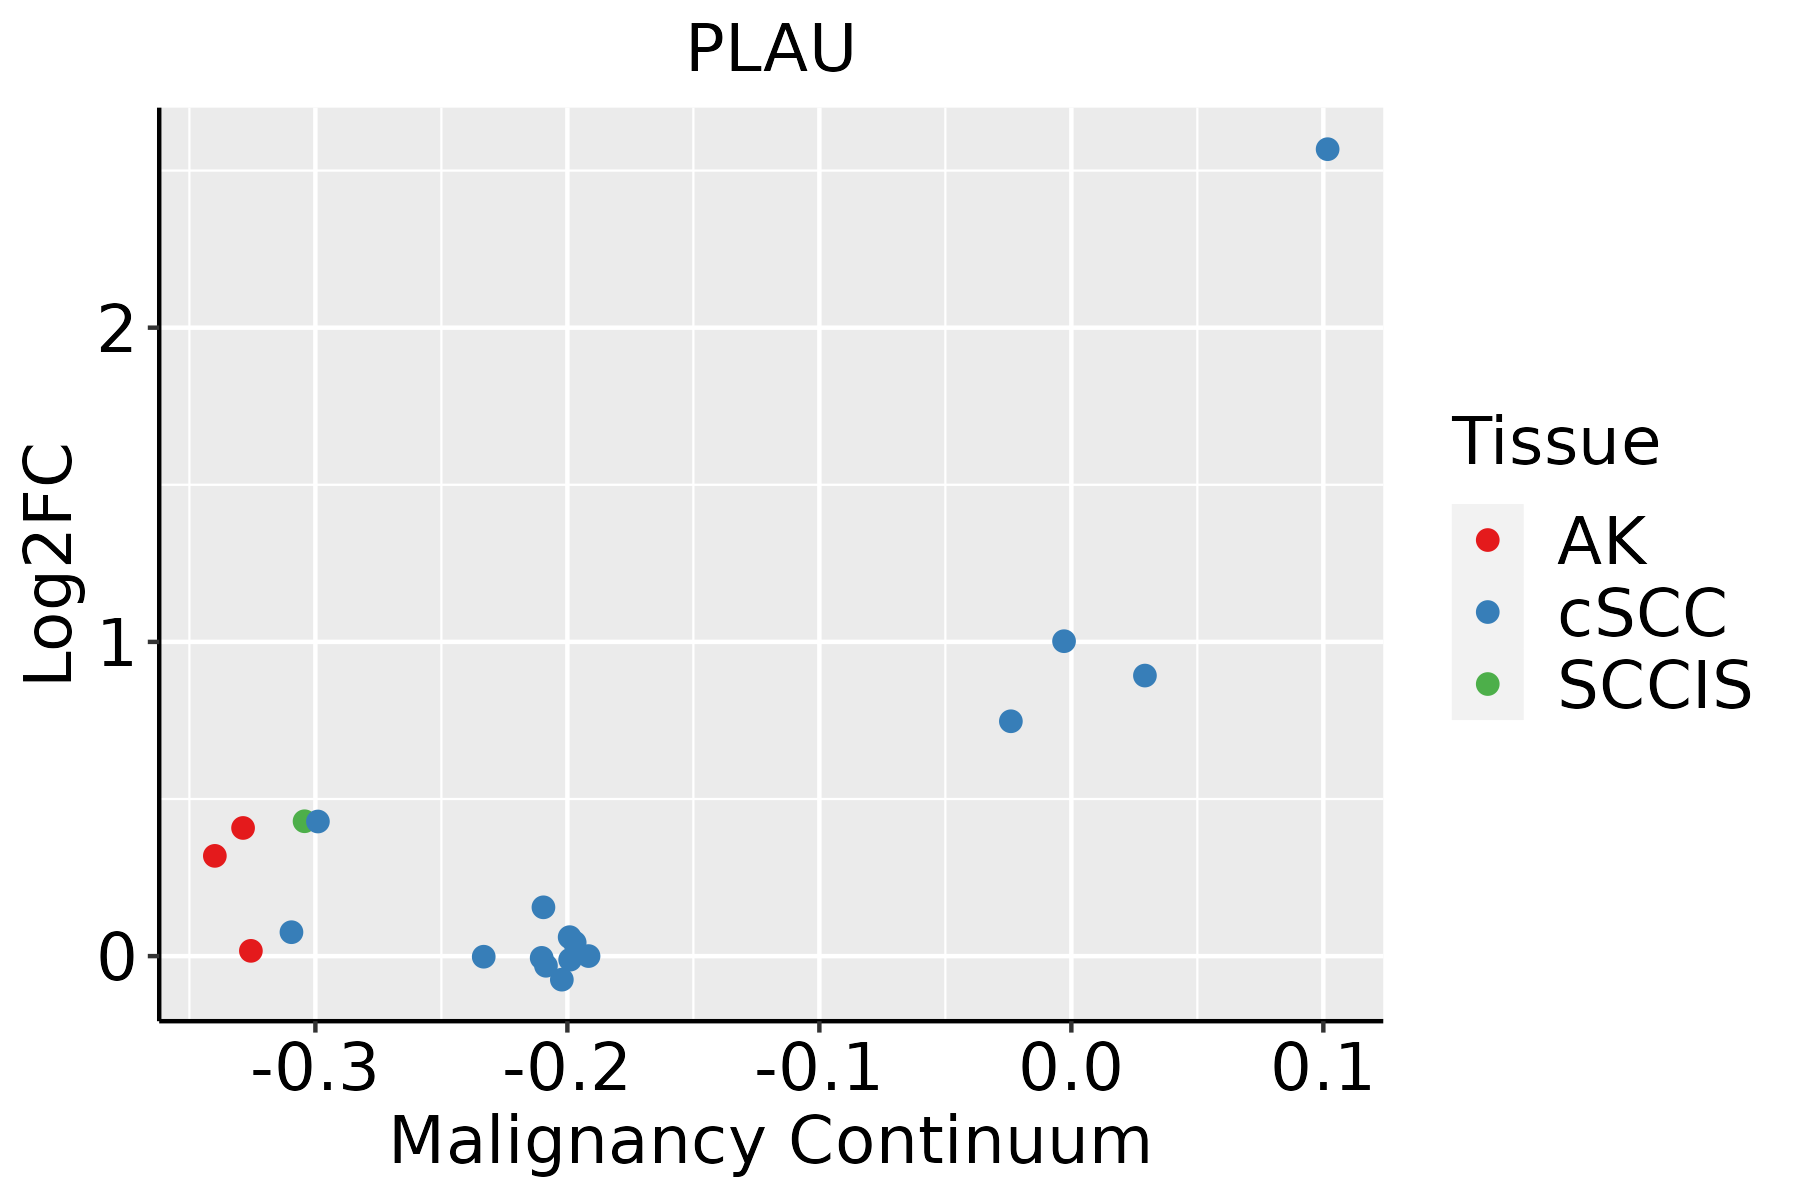 | AK: Actinic keratosis |
| cSCC: Cutaneous squamous cell carcinoma | ||
| SCCIS:squamous cell carcinoma in situ | ||
| Thyroid |  | ATC: Anaplastic thyroid cancer |
| HT: Hashimoto's thyroiditis | ||
| PTC: Papillary thyroid cancer |
| ∗log2FC in expression of this searched gene in stem-like cells from each diseased tissue sample relative to stem-like cells in normal samples in each tissue plotted against the malignancy continuum. Samples are colored based on if they are from different disease stage. |
Top |
Malignant transformation related pathway analysis |
| Find out the enriched GO biological processes and KEGG pathways involved in transition from healthy to precancer to cancer |
| Tissue | Disease Stage | Enriched GO biological Processes |
| Colorectum | AD |  |
| Colorectum | SER |  |
| Colorectum | MSS |  |
| Colorectum | MSI-H |  |
| Colorectum | FAP |  |
| ∗Top 15 enriched GO BP terms are showed in the bar plot of each disease state in each tissue. Each row represents a significant GO biological process which is colored according to the -log10(p.adjust). |
| Page: 1 2 3 4 5 6 7 8 9 |
| GO ID | Tissue | Disease Stage | Description | Gene Ratio | Bg Ratio | pvalue | p.adjust | Count |
| GO:00971939 | Breast | Precancer | intrinsic apoptotic signaling pathway | 59/1080 | 288/18723 | 8.07e-18 | 3.60e-15 | 59 |
| GO:20012339 | Breast | Precancer | regulation of apoptotic signaling pathway | 65/1080 | 356/18723 | 7.70e-17 | 3.17e-14 | 65 |
| GO:20012429 | Breast | Precancer | regulation of intrinsic apoptotic signaling pathway | 41/1080 | 164/18723 | 6.48e-16 | 2.31e-13 | 41 |
| GO:00525479 | Breast | Precancer | regulation of peptidase activity | 71/1080 | 461/18723 | 2.72e-14 | 6.94e-12 | 71 |
| GO:00525489 | Breast | Precancer | regulation of endopeptidase activity | 67/1080 | 432/18723 | 1.06e-13 | 2.36e-11 | 67 |
| GO:20001169 | Breast | Precancer | regulation of cysteine-type endopeptidase activity | 43/1080 | 235/18723 | 1.30e-11 | 1.83e-09 | 43 |
| GO:00432819 | Breast | Precancer | regulation of cysteine-type endopeptidase activity involved in apoptotic process | 40/1080 | 209/18723 | 1.59e-11 | 2.07e-09 | 40 |
| GO:20012349 | Breast | Precancer | negative regulation of apoptotic signaling pathway | 39/1080 | 224/18723 | 5.35e-10 | 4.77e-08 | 39 |
| GO:00458619 | Breast | Precancer | negative regulation of proteolysis | 50/1080 | 351/18723 | 2.99e-09 | 2.39e-07 | 50 |
| GO:20012439 | Breast | Precancer | negative regulation of intrinsic apoptotic signaling pathway | 23/1080 | 98/18723 | 5.82e-09 | 4.45e-07 | 23 |
| GO:00086378 | Breast | Precancer | apoptotic mitochondrial changes | 23/1080 | 107/18723 | 3.44e-08 | 2.12e-06 | 23 |
| GO:00513468 | Breast | Precancer | negative regulation of hydrolase activity | 50/1080 | 379/18723 | 3.85e-08 | 2.34e-06 | 50 |
| GO:00104668 | Breast | Precancer | negative regulation of peptidase activity | 38/1080 | 262/18723 | 1.46e-07 | 7.82e-06 | 38 |
| GO:00109519 | Breast | Precancer | negative regulation of endopeptidase activity | 37/1080 | 252/18723 | 1.55e-07 | 8.05e-06 | 37 |
| GO:20001179 | Breast | Precancer | negative regulation of cysteine-type endopeptidase activity | 19/1080 | 86/18723 | 3.36e-07 | 1.58e-05 | 19 |
| GO:00457859 | Breast | Precancer | positive regulation of cell adhesion | 52/1080 | 437/18723 | 5.74e-07 | 2.49e-05 | 52 |
| GO:00511019 | Breast | Precancer | regulation of DNA binding | 22/1080 | 118/18723 | 9.28e-07 | 3.71e-05 | 22 |
| GO:00431548 | Breast | Precancer | negative regulation of cysteine-type endopeptidase activity involved in apoptotic process | 17/1080 | 78/18723 | 1.69e-06 | 6.08e-05 | 17 |
| GO:00433887 | Breast | Precancer | positive regulation of DNA binding | 14/1080 | 56/18723 | 2.46e-06 | 8.35e-05 | 14 |
| GO:00510989 | Breast | Precancer | regulation of binding | 44/1080 | 363/18723 | 2.59e-06 | 8.65e-05 | 44 |
| Page: 1 2 3 4 5 6 7 8 9 10 11 12 13 14 15 16 17 18 19 20 21 22 23 24 25 26 27 28 29 30 31 32 33 34 35 36 37 38 39 40 41 42 43 44 45 46 47 48 |
| Pathway ID | Tissue | Disease Stage | Description | Gene Ratio | Bg Ratio | pvalue | p.adjust | qvalue | Count |
| hsa0520516 | Cervix | CC | Proteoglycans in cancer | 60/1267 | 205/8465 | 9.13e-08 | 1.18e-06 | 7.00e-07 | 60 |
| hsa052157 | Cervix | CC | Prostate cancer | 27/1267 | 97/8465 | 7.54e-04 | 3.39e-03 | 2.01e-03 | 27 |
| hsa0520517 | Cervix | CC | Proteoglycans in cancer | 60/1267 | 205/8465 | 9.13e-08 | 1.18e-06 | 7.00e-07 | 60 |
| hsa0521512 | Cervix | CC | Prostate cancer | 27/1267 | 97/8465 | 7.54e-04 | 3.39e-03 | 2.01e-03 | 27 |
| hsa0520529 | Esophagus | ESCC | Proteoglycans in cancer | 138/4205 | 205/8465 | 1.79e-07 | 1.40e-06 | 7.15e-07 | 138 |
| hsa0521516 | Esophagus | ESCC | Prostate cancer | 72/4205 | 97/8465 | 6.12e-07 | 4.10e-06 | 2.10e-06 | 72 |
| hsa040645 | Esophagus | ESCC | NF-kappa B signaling pathway | 67/4205 | 104/8465 | 1.62e-03 | 4.89e-03 | 2.50e-03 | 67 |
| hsa052028 | Esophagus | ESCC | Transcriptional misregulation in cancer | 116/4205 | 193/8465 | 2.08e-03 | 5.95e-03 | 3.05e-03 | 116 |
| hsa0520537 | Esophagus | ESCC | Proteoglycans in cancer | 138/4205 | 205/8465 | 1.79e-07 | 1.40e-06 | 7.15e-07 | 138 |
| hsa0521517 | Esophagus | ESCC | Prostate cancer | 72/4205 | 97/8465 | 6.12e-07 | 4.10e-06 | 2.10e-06 | 72 |
| hsa0406412 | Esophagus | ESCC | NF-kappa B signaling pathway | 67/4205 | 104/8465 | 1.62e-03 | 4.89e-03 | 2.50e-03 | 67 |
| hsa0520213 | Esophagus | ESCC | Transcriptional misregulation in cancer | 116/4205 | 193/8465 | 2.08e-03 | 5.95e-03 | 3.05e-03 | 116 |
| hsa0520526 | Oral cavity | OSCC | Proteoglycans in cancer | 128/3704 | 205/8465 | 4.00e-08 | 3.12e-07 | 1.59e-07 | 128 |
| hsa0521510 | Oral cavity | OSCC | Prostate cancer | 66/3704 | 97/8465 | 1.05e-06 | 5.89e-06 | 3.00e-06 | 66 |
| hsa040644 | Oral cavity | OSCC | NF-kappa B signaling pathway | 67/3704 | 104/8465 | 1.57e-05 | 6.75e-05 | 3.44e-05 | 67 |
| hsa05205111 | Oral cavity | OSCC | Proteoglycans in cancer | 128/3704 | 205/8465 | 4.00e-08 | 3.12e-07 | 1.59e-07 | 128 |
| hsa0521515 | Oral cavity | OSCC | Prostate cancer | 66/3704 | 97/8465 | 1.05e-06 | 5.89e-06 | 3.00e-06 | 66 |
| hsa0406411 | Oral cavity | OSCC | NF-kappa B signaling pathway | 67/3704 | 104/8465 | 1.57e-05 | 6.75e-05 | 3.44e-05 | 67 |
| hsa0520527 | Oral cavity | LP | Proteoglycans in cancer | 77/2418 | 205/8465 | 3.01e-03 | 1.29e-02 | 8.35e-03 | 77 |
| hsa0520536 | Oral cavity | LP | Proteoglycans in cancer | 77/2418 | 205/8465 | 3.01e-03 | 1.29e-02 | 8.35e-03 | 77 |
| Page: 1 2 |
Top |
Cell-cell communication analysis |
| Identification of potential cell-cell interactions between two cell types and their ligand-receptor pairs for different disease states |
| Ligand | Receptor | LRpair | Pathway | Tissue | Disease Stage |
| Page: 1 |
Top |
Single-cell gene regulatory network inference analysis |
| Find out the significant the regulons (TFs) and the target genes of each regulon across cell types for different disease states |
| TF | Cell Type | Tissue | Disease Stage | Target Gene | RSS | Regulon Activity |
| ∗The dot plots of a searched regulon are shown for all cell subpopulations in each disease state of each tissue based on the regulon specific score inferred using pySCENIC and by calculating the average expression. |
| Page: 1 |
Top |
Somatic mutation of malignant transformation related genes |
| Annotation of somatic variants for genes involved in malignant transformation |
| Hugo Symbol | Variant Class | Variant Classification | dbSNP RS | HGVSc | HGVSp | HGVSp Short | SWISSPROT | BIOTYPE | SIFT | PolyPhen | Tumor Sample Barcode | Tissue | Histology | Sex | Age | Stage | Therapy Types | Drugs | Outcome |
| PLAU | SNV | Missense_Mutation | rs754958267 | c.841N>T | p.Ile281Phe | p.I281F | P00749 | protein_coding | deleterious(0) | probably_damaging(0.989) | TCGA-LD-A9QF-01 | Breast | breast invasive carcinoma | Female | >=65 | I/II | Chemotherapy | taxol | SD |
| PLAU | SNV | Missense_Mutation | c.212N>T | p.Tyr71Phe | p.Y71F | P00749 | protein_coding | tolerated(0.06) | benign(0.073) | TCGA-DS-A0VK-01 | Cervix | cervical & endocervical cancer | Female | <65 | I/II | Chemotherapy | carboplatin | PD | |
| PLAU | SNV | Missense_Mutation | c.1091A>G | p.Asp364Gly | p.D364G | P00749 | protein_coding | tolerated(0.08) | benign(0.359) | TCGA-AA-3672-01 | Colorectum | colon adenocarcinoma | Female | >=65 | III/IV | Unknown | Unknown | SD | |
| PLAU | SNV | Missense_Mutation | c.446N>G | p.His149Arg | p.H149R | P00749 | protein_coding | tolerated(0.23) | benign(0.003) | TCGA-AZ-4615-01 | Colorectum | colon adenocarcinoma | Male | >=65 | III/IV | Chemotherapy | xeloda | PD | |
| PLAU | SNV | Missense_Mutation | c.1187N>T | p.Trp396Leu | p.W396L | P00749 | protein_coding | deleterious(0) | probably_damaging(1) | TCGA-CK-5913-01 | Colorectum | colon adenocarcinoma | Female | <65 | I/II | Unknown | Unknown | SD | |
| PLAU | SNV | Missense_Mutation | novel | c.28C>A | p.Leu10Ile | p.L10I | P00749 | protein_coding | tolerated(0.08) | benign(0.15) | TCGA-F5-6814-01 | Colorectum | rectum adenocarcinoma | Male | <65 | I/II | Unknown | Unknown | SD |
| PLAU | SNV | Missense_Mutation | rs370557565 | c.86N>T | p.Ser29Leu | p.S29L | P00749 | protein_coding | deleterious(0.01) | benign(0.012) | TCGA-A5-A2K3-01 | Endometrium | uterine corpus endometrioid carcinoma | Female | >=65 | I/II | Chemotherapy | carboplatin | SD |
| PLAU | SNV | Missense_Mutation | novel | c.497N>G | p.Phe166Cys | p.F166C | P00749 | protein_coding | deleterious(0.05) | probably_damaging(0.995) | TCGA-AJ-A3EL-01 | Endometrium | uterine corpus endometrioid carcinoma | Female | <65 | I/II | Unknown | Unknown | SD |
| PLAU | SNV | Missense_Mutation | novel | c.181N>T | p.His61Tyr | p.H61Y | P00749 | protein_coding | tolerated(0.07) | benign(0.069) | TCGA-AX-A063-01 | Endometrium | uterine corpus endometrioid carcinoma | Female | <65 | I/II | Unknown | Unknown | SD |
| PLAU | SNV | Missense_Mutation | c.1042N>T | p.Pro348Ser | p.P348S | P00749 | protein_coding | deleterious(0.03) | probably_damaging(0.956) | TCGA-AX-A0J1-01 | Endometrium | uterine corpus endometrioid carcinoma | Female | >=65 | I/II | Unknown | Unknown | SD |
| Page: 1 2 3 4 5 |
Top |
Related drugs of malignant transformation related genes |
| Identification of chemicals and drugs interact with genes involved in malignant transfromation |
| (DGIdb 4.0) |
| Entrez ID | Symbol | Category | Interaction Types | Drug Claim Name | Drug Name | PMIDs |
| 5328 | PLAU | PROTEASE, DRUGGABLE GENOME, ENZYME, CELL SURFACE | RETINOL | RETINOL | 1576255 | |
| 5328 | PLAU | PROTEASE, DRUGGABLE GENOME, ENZYME, CELL SURFACE | ALENDRONATE | ALENDRONIC ACID | 11984068 | |
| 5328 | PLAU | PROTEASE, DRUGGABLE GENOME, ENZYME, CELL SURFACE | RAZOXANE | RAZOXANE | 9378540 | |
| 5328 | PLAU | PROTEASE, DRUGGABLE GENOME, ENZYME, CELL SURFACE | MRX-801 | |||
| 5328 | PLAU | PROTEASE, DRUGGABLE GENOME, ENZYME, CELL SURFACE | BCNU | CARMUSTINE | 9219734 | |
| 5328 | PLAU | PROTEASE, DRUGGABLE GENOME, ENZYME, CELL SURFACE | DIFFERENTIATION INDUCER | 8595156 | ||
| 5328 | PLAU | PROTEASE, DRUGGABLE GENOME, ENZYME, CELL SURFACE | CORTISOL | HYDROCORTISONE | 2115769 | |
| 5328 | PLAU | PROTEASE, DRUGGABLE GENOME, ENZYME, CELL SURFACE | G-CSF | FILGRASTIM | 16331631 | |
| 5328 | PLAU | PROTEASE, DRUGGABLE GENOME, ENZYME, CELL SURFACE | ANTIOXIDANT | 9573532 | ||
| 5328 | PLAU | PROTEASE, DRUGGABLE GENOME, ENZYME, CELL SURFACE | CALCITRIOL | CALCITRIOL | 3139763 |
| Page: 1 2 3 4 5 6 |

Copyright 2023-Present -The University of Texas Health Science Center at Houston |