
|
|||||
|
 | |
| |
| |
| |
| |
| |
|
Gene: PITPNC1 |
Gene summary for PITPNC1 |
| Gene information | Species | Human | Gene symbol | PITPNC1 | Gene ID | 26207 |
| Gene name | phosphatidylinositol transfer protein cytoplasmic 1 | |
| Gene Alias | M-RDGB-beta | |
| Cytomap | 17q24.2 | |
| Gene Type | protein-coding | GO ID | GO:0006810 | UniProtAcc | Q9UKF7 |
Top |
Malignant transformation analysis |
| Identification of the aberrant gene expression in precancerous and cancerous lesions by comparing the gene expression of stem-like cells in diseased tissues with normal stem cells |
| Entrez ID | Symbol | Replicates | Species | Organ | Tissue | Adj P-value | Log2FC | Malignancy |
| 26207 | PITPNC1 | NEOLP-3 | Human | Oral cavity | NEOLP | 2.50e-11 | 5.89e-01 | -0.0191 |
| 26207 | PITPNC1 | SYSMH1 | Human | Oral cavity | OSCC | 1.23e-07 | -4.53e-01 | 0.1127 |
| 26207 | PITPNC1 | SYSMH2 | Human | Oral cavity | OSCC | 1.27e-04 | -3.54e-01 | 0.2326 |
| 26207 | PITPNC1 | SYSMH3 | Human | Oral cavity | OSCC | 2.55e-04 | -2.65e-01 | 0.2442 |
| 26207 | PITPNC1 | SYSMH4 | Human | Oral cavity | OSCC | 1.48e-07 | -4.15e-01 | 0.1226 |
| 26207 | PITPNC1 | SYSMH5 | Human | Oral cavity | OSCC | 6.70e-07 | -3.38e-01 | 0.0647 |
| 26207 | PITPNC1 | SYSMH6 | Human | Oral cavity | OSCC | 1.13e-08 | -3.53e-01 | 0.1275 |
| 26207 | PITPNC1 | HTA12-15-2 | Human | Pancreas | PDAC | 2.99e-10 | 9.06e-01 | 0.2315 |
| 26207 | PITPNC1 | HTA12-16-5 | Human | Pancreas | PDAC | 5.91e-03 | 6.21e-01 | 0.047 |
| 26207 | PITPNC1 | HTA12-23-1 | Human | Pancreas | PDAC | 2.14e-12 | 1.17e+00 | 0.3405 |
| 26207 | PITPNC1 | HTA12-25-1 | Human | Pancreas | PDAC | 4.48e-16 | 1.16e+00 | 0.313 |
| 26207 | PITPNC1 | HTA12-26-1 | Human | Pancreas | PDAC | 4.94e-37 | 1.55e+00 | 0.3728 |
| 26207 | PITPNC1 | HTA12-29-1 | Human | Pancreas | PDAC | 6.96e-73 | 1.46e+00 | 0.3722 |
| 26207 | PITPNC1 | HTA12-30-1 | Human | Pancreas | PDAC | 6.35e-04 | 1.41e+00 | 0.3671 |
| 26207 | PITPNC1 | HTA12-32-1 | Human | Pancreas | PDAC | 1.08e-08 | 1.55e+00 | 0.3624 |
| 26207 | PITPNC1 | HTA12-9-1 | Human | Pancreas | PDAC | 5.86e-07 | 7.31e-01 | 0.1532 |
| 26207 | PITPNC1 | HTA12-9-2 | Human | Pancreas | PDAC | 1.62e-06 | 6.39e-01 | 0.0835 |
| 26207 | PITPNC1 | HTA12-9-3 | Human | Pancreas | PDAC | 1.07e-05 | 1.01e+00 | 0.2045 |
| 26207 | PITPNC1 | 047563_1562-all-cells | Human | Prostate | BPH | 1.58e-61 | 1.27e+00 | 0.0791 |
| 26207 | PITPNC1 | 048752_1579-all-cells | Human | Prostate | BPH | 4.06e-31 | 7.79e-01 | 0.1008 |
| Page: 1 2 3 4 5 6 7 |
| Tissue | Expression Dynamics | Abbreviation |
| Cervix | 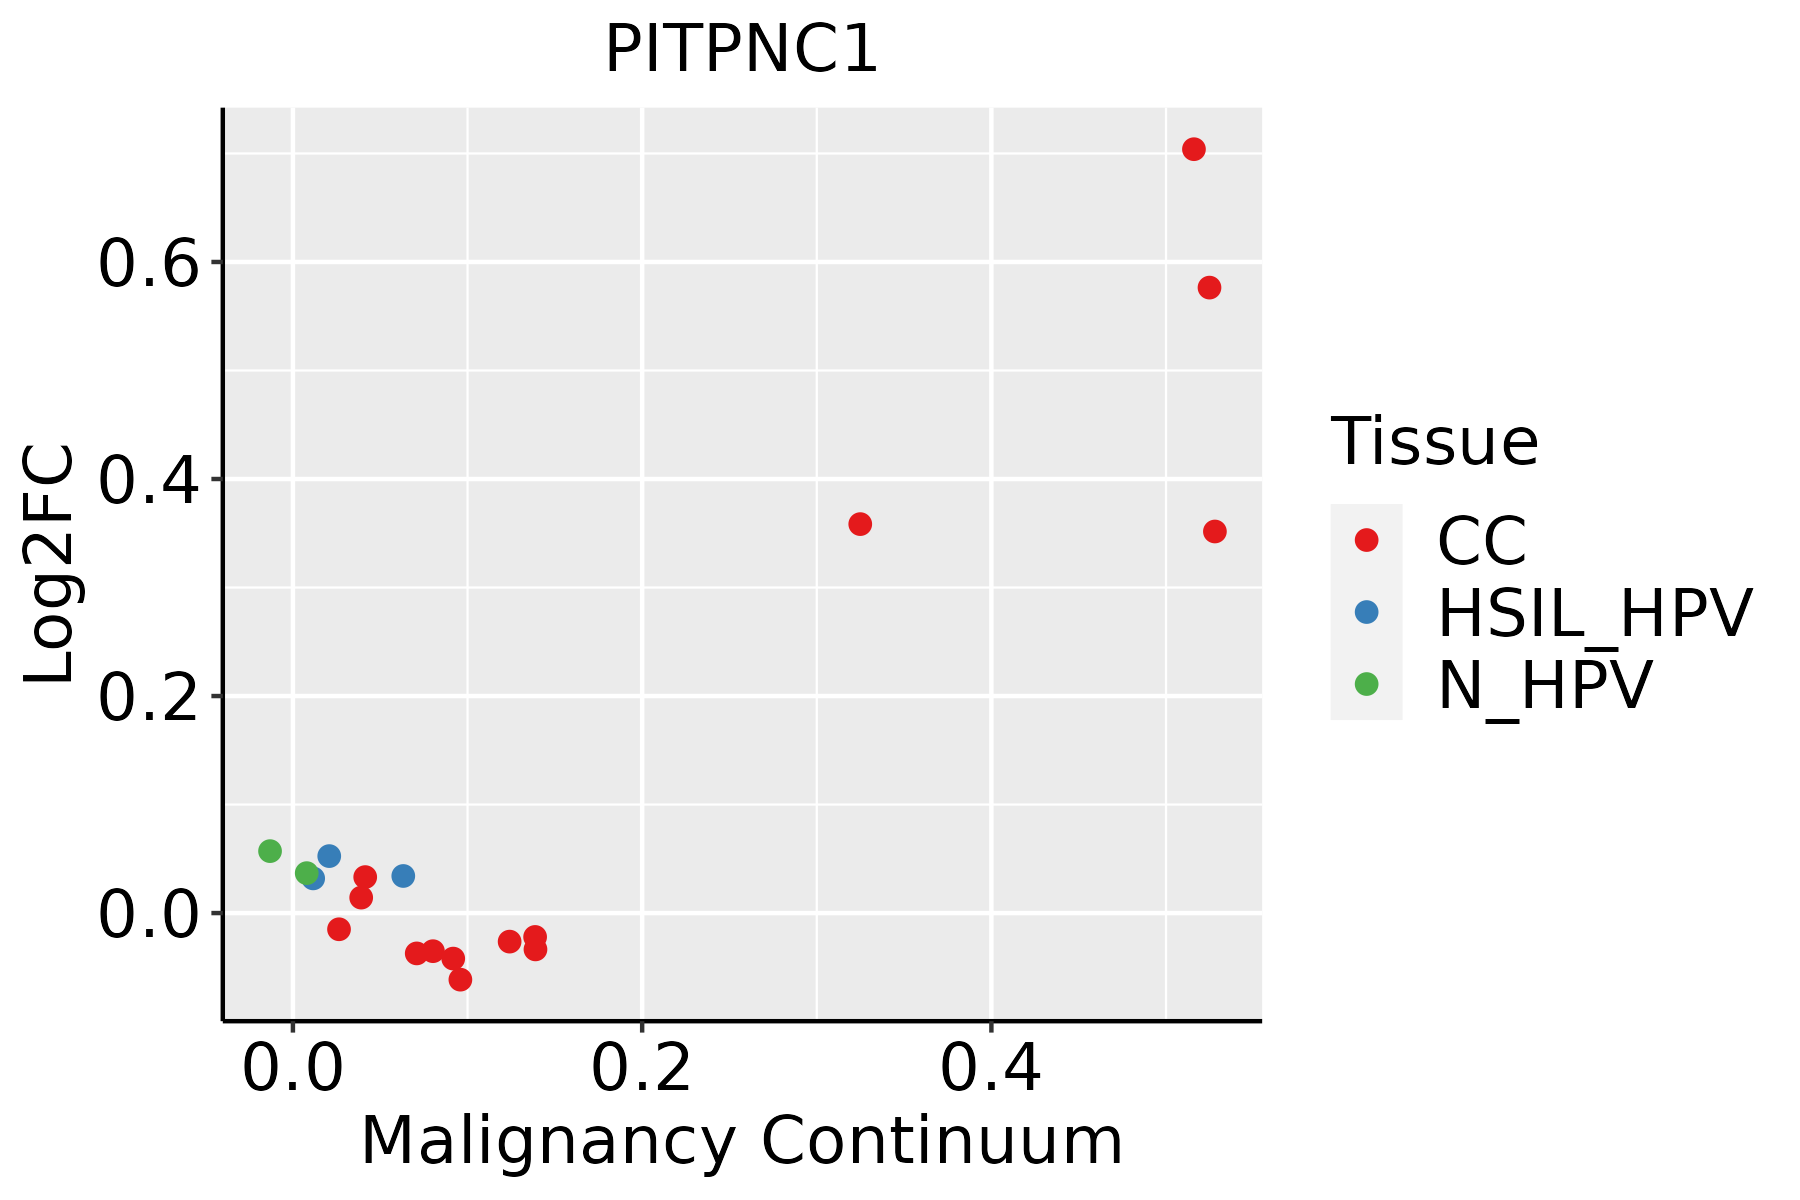 | CC: Cervix cancer |
| HSIL_HPV: HPV-infected high-grade squamous intraepithelial lesions | ||
| N_HPV: HPV-infected normal cervix | ||
| Colorectum (GSE201348) |  | FAP: Familial adenomatous polyposis |
| CRC: Colorectal cancer | ||
| Colorectum (HTA11) |  | AD: Adenomas |
| SER: Sessile serrated lesions | ||
| MSI-H: Microsatellite-high colorectal cancer | ||
| MSS: Microsatellite stable colorectal cancer | ||
| Endometrium | 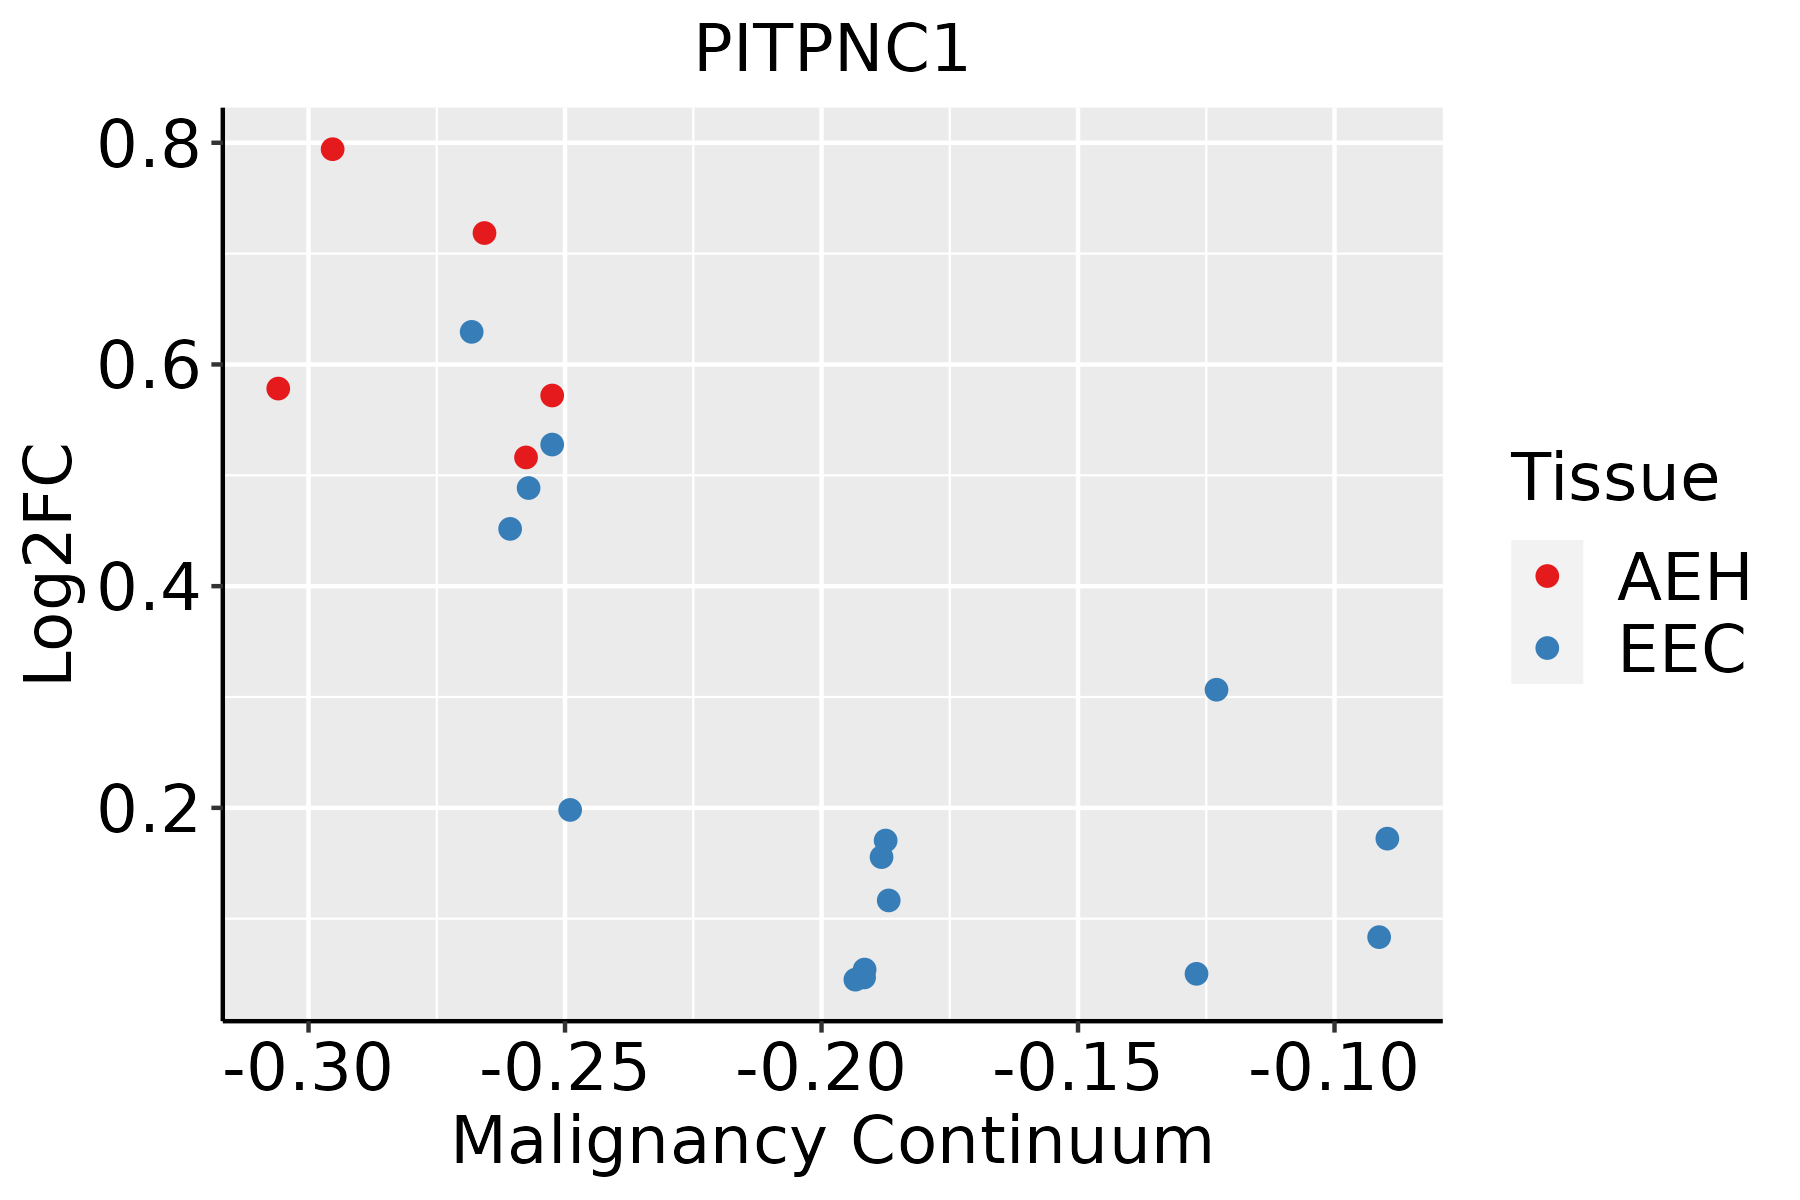 | AEH: Atypical endometrial hyperplasia |
| EEC: Endometrioid Cancer | ||
| Esophagus |  | ESCC: Esophageal squamous cell carcinoma |
| HGIN: High-grade intraepithelial neoplasias | ||
| LGIN: Low-grade intraepithelial neoplasias | ||
| Liver |  | HCC: Hepatocellular carcinoma |
| NAFLD: Non-alcoholic fatty liver disease | ||
| Oral Cavity | 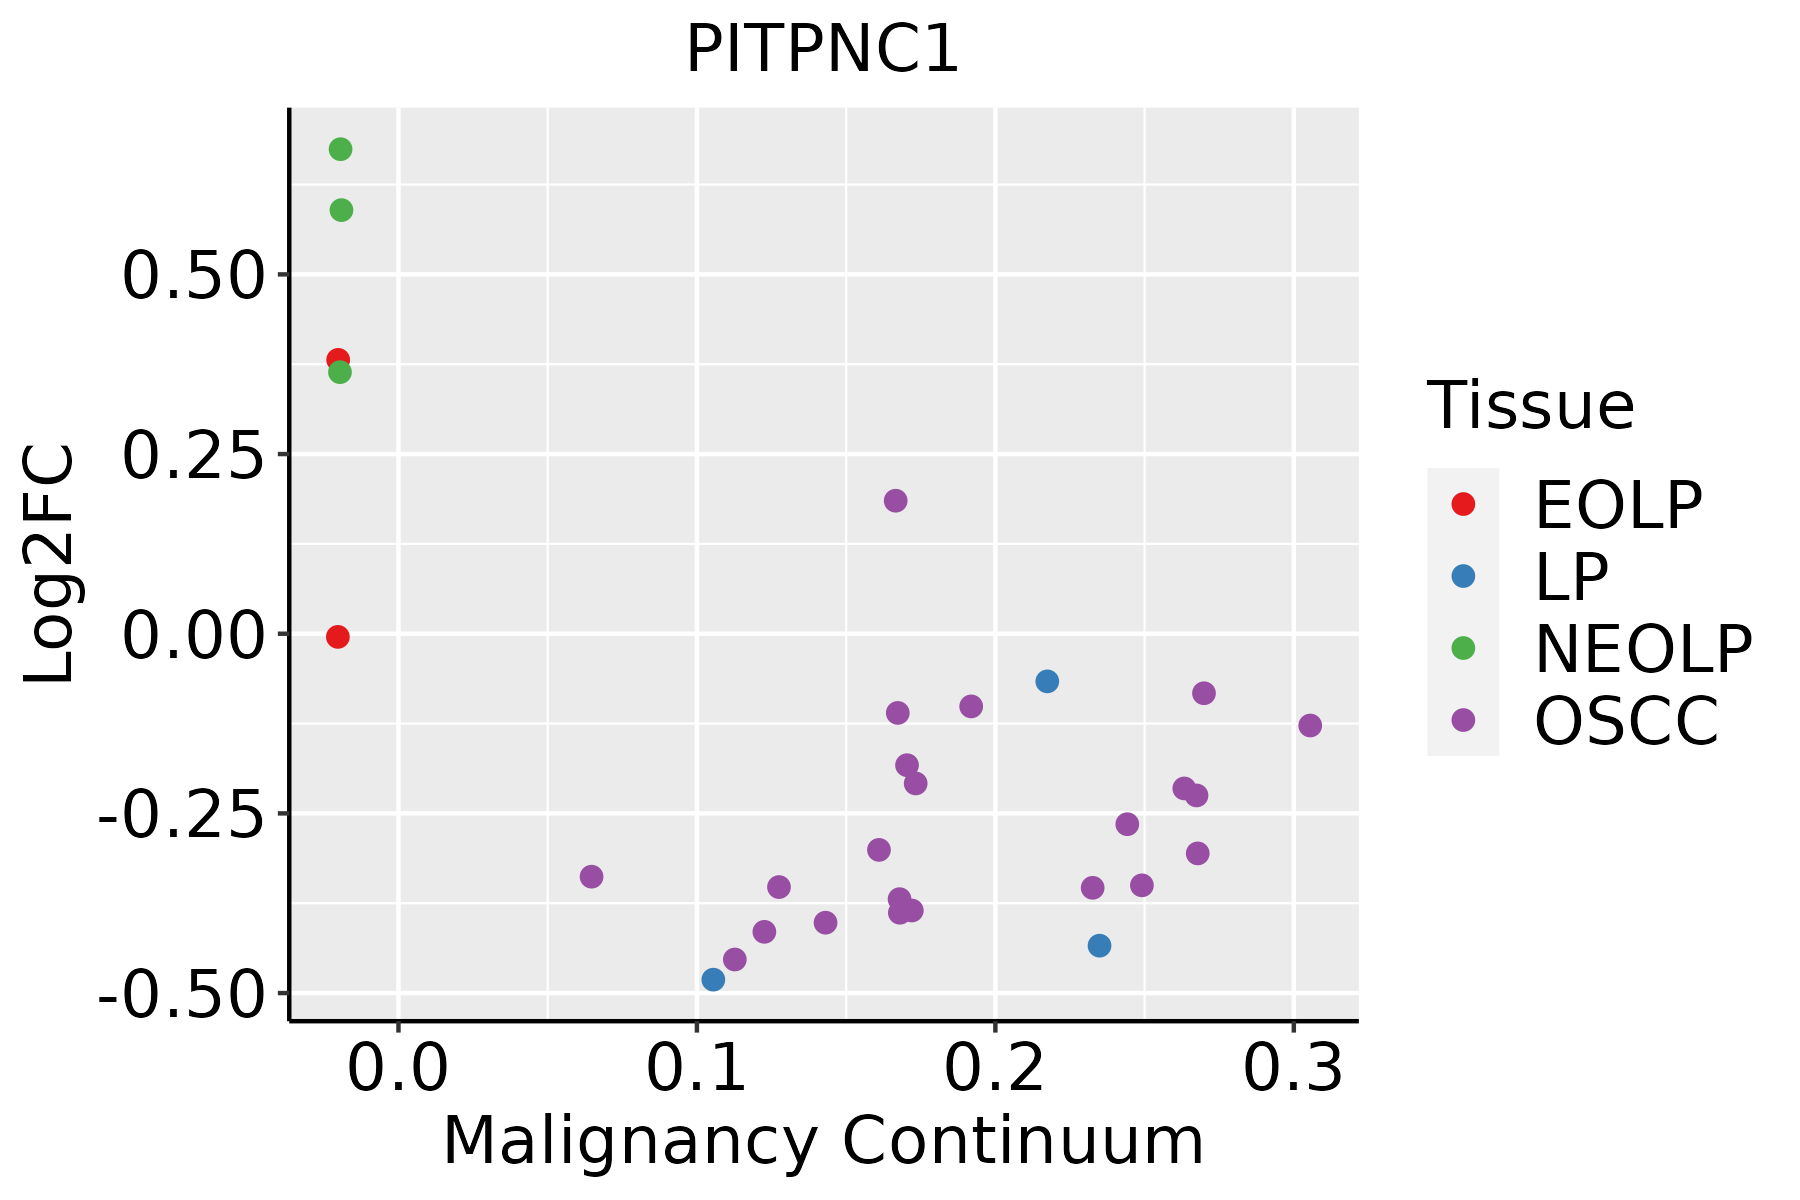 | EOLP: Erosive Oral lichen planus |
| LP: leukoplakia | ||
| NEOLP: Non-erosive oral lichen planus | ||
| OSCC: Oral squamous cell carcinoma | ||
| Prostate |  | BPH: Benign Prostatic Hyperplasia |
| ∗log2FC in expression of this searched gene in stem-like cells from each diseased tissue sample relative to stem-like cells in normal samples in each tissue plotted against the malignancy continuum. Samples are colored based on if they are from different disease stage. |
Top |
Malignant transformation related pathway analysis |
| Find out the enriched GO biological processes and KEGG pathways involved in transition from healthy to precancer to cancer |
| Tissue | Disease Stage | Enriched GO biological Processes |
| Colorectum | AD |  |
| Colorectum | SER |  |
| Colorectum | MSS |  |
| Colorectum | MSI-H |  |
| Colorectum | FAP |  |
| ∗Top 15 enriched GO BP terms are showed in the bar plot of each disease state in each tissue. Each row represents a significant GO biological process which is colored according to the -log10(p.adjust). |
| Page: 1 2 3 4 5 6 7 8 9 |
| GO ID | Tissue | Disease Stage | Description | Gene Ratio | Bg Ratio | pvalue | p.adjust | Count |
| GO:0010876 | Colorectum | AD | lipid localization | 120/3918 | 448/18723 | 1.59e-03 | 1.33e-02 | 120 |
| GO:0006869 | Colorectum | AD | lipid transport | 108/3918 | 398/18723 | 1.67e-03 | 1.39e-02 | 108 |
| GO:0015748 | Colorectum | AD | organophosphate ester transport | 42/3918 | 140/18723 | 7.04e-03 | 4.31e-02 | 42 |
| GO:00108761 | Colorectum | MSS | lipid localization | 104/3467 | 448/18723 | 6.76e-03 | 4.38e-02 | 104 |
| GO:00068691 | Colorectum | FAP | lipid transport | 81/2622 | 398/18723 | 2.84e-04 | 3.76e-03 | 81 |
| GO:00108762 | Colorectum | FAP | lipid localization | 85/2622 | 448/18723 | 1.92e-03 | 1.63e-02 | 85 |
| GO:0015914 | Colorectum | FAP | phospholipid transport | 23/2622 | 96/18723 | 6.09e-03 | 3.82e-02 | 23 |
| GO:00068692 | Colorectum | CRC | lipid transport | 63/2078 | 398/18723 | 2.36e-03 | 2.26e-02 | 63 |
| GO:00108763 | Colorectum | CRC | lipid localization | 68/2078 | 448/18723 | 4.60e-03 | 3.58e-02 | 68 |
| GO:001087611 | Liver | Cirrhotic | lipid localization | 147/4634 | 448/18723 | 6.24e-05 | 7.12e-04 | 147 |
| GO:000686911 | Liver | Cirrhotic | lipid transport | 128/4634 | 398/18723 | 4.54e-04 | 3.69e-03 | 128 |
| GO:01200091 | Liver | Cirrhotic | intermembrane lipid transfer | 21/4634 | 48/18723 | 3.06e-03 | 1.73e-02 | 21 |
| GO:001087621 | Liver | HCC | lipid localization | 228/7958 | 448/18723 | 1.80e-04 | 1.41e-03 | 228 |
| GO:01200092 | Liver | HCC | intermembrane lipid transfer | 33/7958 | 48/18723 | 2.12e-04 | 1.63e-03 | 33 |
| GO:000686921 | Liver | HCC | lipid transport | 198/7958 | 398/18723 | 1.92e-03 | 9.78e-03 | 198 |
| GO:00157483 | Oral cavity | EOLP | organophosphate ester transport | 28/2218 | 140/18723 | 3.66e-03 | 2.05e-02 | 28 |
| GO:001574811 | Oral cavity | NEOLP | organophosphate ester transport | 25/2005 | 140/18723 | 7.16e-03 | 3.63e-02 | 25 |
| Page: 1 |
| Pathway ID | Tissue | Disease Stage | Description | Gene Ratio | Bg Ratio | pvalue | p.adjust | qvalue | Count |
| Page: 1 |
Top |
Cell-cell communication analysis |
| Identification of potential cell-cell interactions between two cell types and their ligand-receptor pairs for different disease states |
| Ligand | Receptor | LRpair | Pathway | Tissue | Disease Stage |
| Page: 1 |
Top |
Single-cell gene regulatory network inference analysis |
| Find out the significant the regulons (TFs) and the target genes of each regulon across cell types for different disease states |
| TF | Cell Type | Tissue | Disease Stage | Target Gene | RSS | Regulon Activity |
| ∗The dot plots of a searched regulon are shown for all cell subpopulations in each disease state of each tissue based on the regulon specific score inferred using pySCENIC and by calculating the average expression. |
| Page: 1 |
Top |
Somatic mutation of malignant transformation related genes |
| Annotation of somatic variants for genes involved in malignant transformation |
| Hugo Symbol | Variant Class | Variant Classification | dbSNP RS | HGVSc | HGVSp | HGVSp Short | SWISSPROT | BIOTYPE | SIFT | PolyPhen | Tumor Sample Barcode | Tissue | Histology | Sex | Age | Stage | Therapy Types | Drugs | Outcome |
| PITPNC1 | SNV | Missense_Mutation | c.994N>C | p.Glu332Gln | p.E332Q | Q9UKF7 | protein_coding | deleterious_low_confidence(0) | benign(0.086) | TCGA-AC-A23H-01 | Breast | breast invasive carcinoma | Female | >=65 | I/II | Unknown | Unknown | PD | |
| PITPNC1 | SNV | Missense_Mutation | c.548N>T | p.Ser183Phe | p.S183F | Q9UKF7 | protein_coding | deleterious(0) | probably_damaging(0.967) | TCGA-BH-A0H5-01 | Breast | breast invasive carcinoma | Female | <65 | I/II | Chemotherapy | cytoxan | CR | |
| PITPNC1 | SNV | Missense_Mutation | c.868N>A | p.Val290Ile | p.V290I | Q9UKF7 | protein_coding | tolerated(0.05) | benign(0.075) | TCGA-E9-A1N3-01 | Breast | breast invasive carcinoma | Female | >=65 | III/IV | Chemotherapy | 5-fluorouracil | CR | |
| PITPNC1 | insertion | In_Frame_Ins | novel | c.746_747insGGA | p.Ile249delinsMetAsp | p.I249delinsMD | Q9UKF7 | protein_coding | TCGA-A2-A3XZ-01 | Breast | breast invasive carcinoma | Female | <65 | I/II | Chemotherapy | carboplatin | CR | ||
| PITPNC1 | insertion | Nonsense_Mutation | novel | c.747_748insCCACCACAGTGAAAAAGCCTG | p.Ile249_Gly250insProProGlnTerLysSerLeu | p.I249_G250insPPQ*KSL | Q9UKF7 | protein_coding | TCGA-A2-A3XZ-01 | Breast | breast invasive carcinoma | Female | <65 | I/II | Chemotherapy | carboplatin | CR | ||
| PITPNC1 | SNV | Missense_Mutation | c.670G>A | p.Asp224Asn | p.D224N | Q9UKF7 | protein_coding | deleterious(0.04) | probably_damaging(1) | TCGA-IR-A3LK-01 | Cervix | cervical & endocervical cancer | Female | >=65 | I/II | Chemotherapy | cisplatin | PD | |
| PITPNC1 | SNV | Missense_Mutation | rs751106529 | c.704N>A | p.Arg235Gln | p.R235Q | Q9UKF7 | protein_coding | deleterious(0) | probably_damaging(0.953) | TCGA-A6-5665-01 | Colorectum | colon adenocarcinoma | Female | >=65 | I/II | Unknown | Unknown | PD |
| PITPNC1 | SNV | Missense_Mutation | c.443N>A | p.Arg148His | p.R148H | Q9UKF7 | protein_coding | tolerated(0.21) | benign(0.066) | TCGA-AA-3672-01 | Colorectum | colon adenocarcinoma | Female | >=65 | III/IV | Unknown | Unknown | SD | |
| PITPNC1 | SNV | Missense_Mutation | c.743A>G | p.Lys248Arg | p.K248R | Q9UKF7 | protein_coding | tolerated(0.08) | possibly_damaging(0.801) | TCGA-AA-A004-01 | Colorectum | colon adenocarcinoma | Male | >=65 | I/II | Unknown | Unknown | SD | |
| PITPNC1 | SNV | Missense_Mutation | c.344A>G | p.Asp115Gly | p.D115G | Q9UKF7 | protein_coding | tolerated(0.05) | possibly_damaging(0.879) | TCGA-AA-A010-01 | Colorectum | colon adenocarcinoma | Female | <65 | I/II | Chemotherapy | folinic | CR |
| Page: 1 2 3 4 |
Top |
Related drugs of malignant transformation related genes |
| Identification of chemicals and drugs interact with genes involved in malignant transfromation |
| (DGIdb 4.0) |
| Entrez ID | Symbol | Category | Interaction Types | Drug Claim Name | Drug Name | PMIDs |
| Page: 1 |

Copyright 2023-Present -The University of Texas Health Science Center at Houston |