
|
|||||
|
 | |
| |
| |
| |
| |
| |
|
Gene: NPM3 |
Gene summary for NPM3 |
| Gene information | Species | Human | Gene symbol | NPM3 | Gene ID | 10360 |
| Gene name | nucleophosmin/nucleoplasmin 3 | |
| Gene Alias | PORMIN | |
| Cytomap | 10q24.32 | |
| Gene Type | protein-coding | GO ID | GO:0006139 | UniProtAcc | O75607 |
Top |
Malignant transformation analysis |
| Identification of the aberrant gene expression in precancerous and cancerous lesions by comparing the gene expression of stem-like cells in diseased tissues with normal stem cells |
| Entrez ID | Symbol | Replicates | Species | Organ | Tissue | Adj P-value | Log2FC | Malignancy |
| 10360 | NPM3 | P5_S10_cSCC | Human | Skin | cSCC | 1.43e-02 | -1.95e-01 | -0.299 |
| 10360 | NPM3 | P1_cSCC | Human | Skin | cSCC | 3.34e-19 | 1.15e+00 | 0.0292 |
| 10360 | NPM3 | P2_cSCC | Human | Skin | cSCC | 4.57e-18 | 8.34e-01 | -0.024 |
| 10360 | NPM3 | P4_cSCC | Human | Skin | cSCC | 4.12e-27 | 1.01e+00 | -0.00290000000000005 |
| 10360 | NPM3 | P10_cSCC | Human | Skin | cSCC | 1.26e-26 | 1.13e+00 | 0.1017 |
| 10360 | NPM3 | cSCC_p8 | Human | Skin | cSCC | 1.87e-02 | -3.53e-02 | -0.1971 |
| 10360 | NPM3 | male-WTA | Human | Thyroid | PTC | 5.56e-16 | 1.03e-01 | 0.1037 |
| 10360 | NPM3 | PTC01 | Human | Thyroid | PTC | 7.00e-08 | 7.78e-02 | 0.1899 |
| 10360 | NPM3 | PTC04 | Human | Thyroid | PTC | 2.88e-04 | 4.88e-02 | 0.1927 |
| 10360 | NPM3 | PTC05 | Human | Thyroid | PTC | 4.58e-05 | 1.22e-01 | 0.2065 |
| 10360 | NPM3 | PTC06 | Human | Thyroid | PTC | 2.63e-12 | 1.86e-01 | 0.2057 |
| 10360 | NPM3 | PTC07 | Human | Thyroid | PTC | 2.38e-11 | 1.36e-01 | 0.2044 |
| 10360 | NPM3 | ATC11 | Human | Thyroid | ATC | 3.24e-06 | 6.31e-01 | 0.3386 |
| 10360 | NPM3 | ATC12 | Human | Thyroid | ATC | 1.87e-12 | 2.99e-01 | 0.34 |
| 10360 | NPM3 | ATC13 | Human | Thyroid | ATC | 2.45e-06 | 1.11e-01 | 0.34 |
| 10360 | NPM3 | ATC2 | Human | Thyroid | ATC | 4.02e-06 | 7.15e-01 | 0.34 |
| 10360 | NPM3 | ATC3 | Human | Thyroid | ATC | 1.29e-07 | 5.27e-01 | 0.338 |
| 10360 | NPM3 | ATC4 | Human | Thyroid | ATC | 3.58e-16 | 4.43e-01 | 0.34 |
| 10360 | NPM3 | ATC5 | Human | Thyroid | ATC | 4.17e-08 | 1.32e-01 | 0.34 |
| Page: 1 2 3 4 5 6 |
| Tissue | Expression Dynamics | Abbreviation |
| Esophagus |  | ESCC: Esophageal squamous cell carcinoma |
| HGIN: High-grade intraepithelial neoplasias | ||
| LGIN: Low-grade intraepithelial neoplasias | ||
| Liver |  | HCC: Hepatocellular carcinoma |
| NAFLD: Non-alcoholic fatty liver disease | ||
| Oral Cavity | 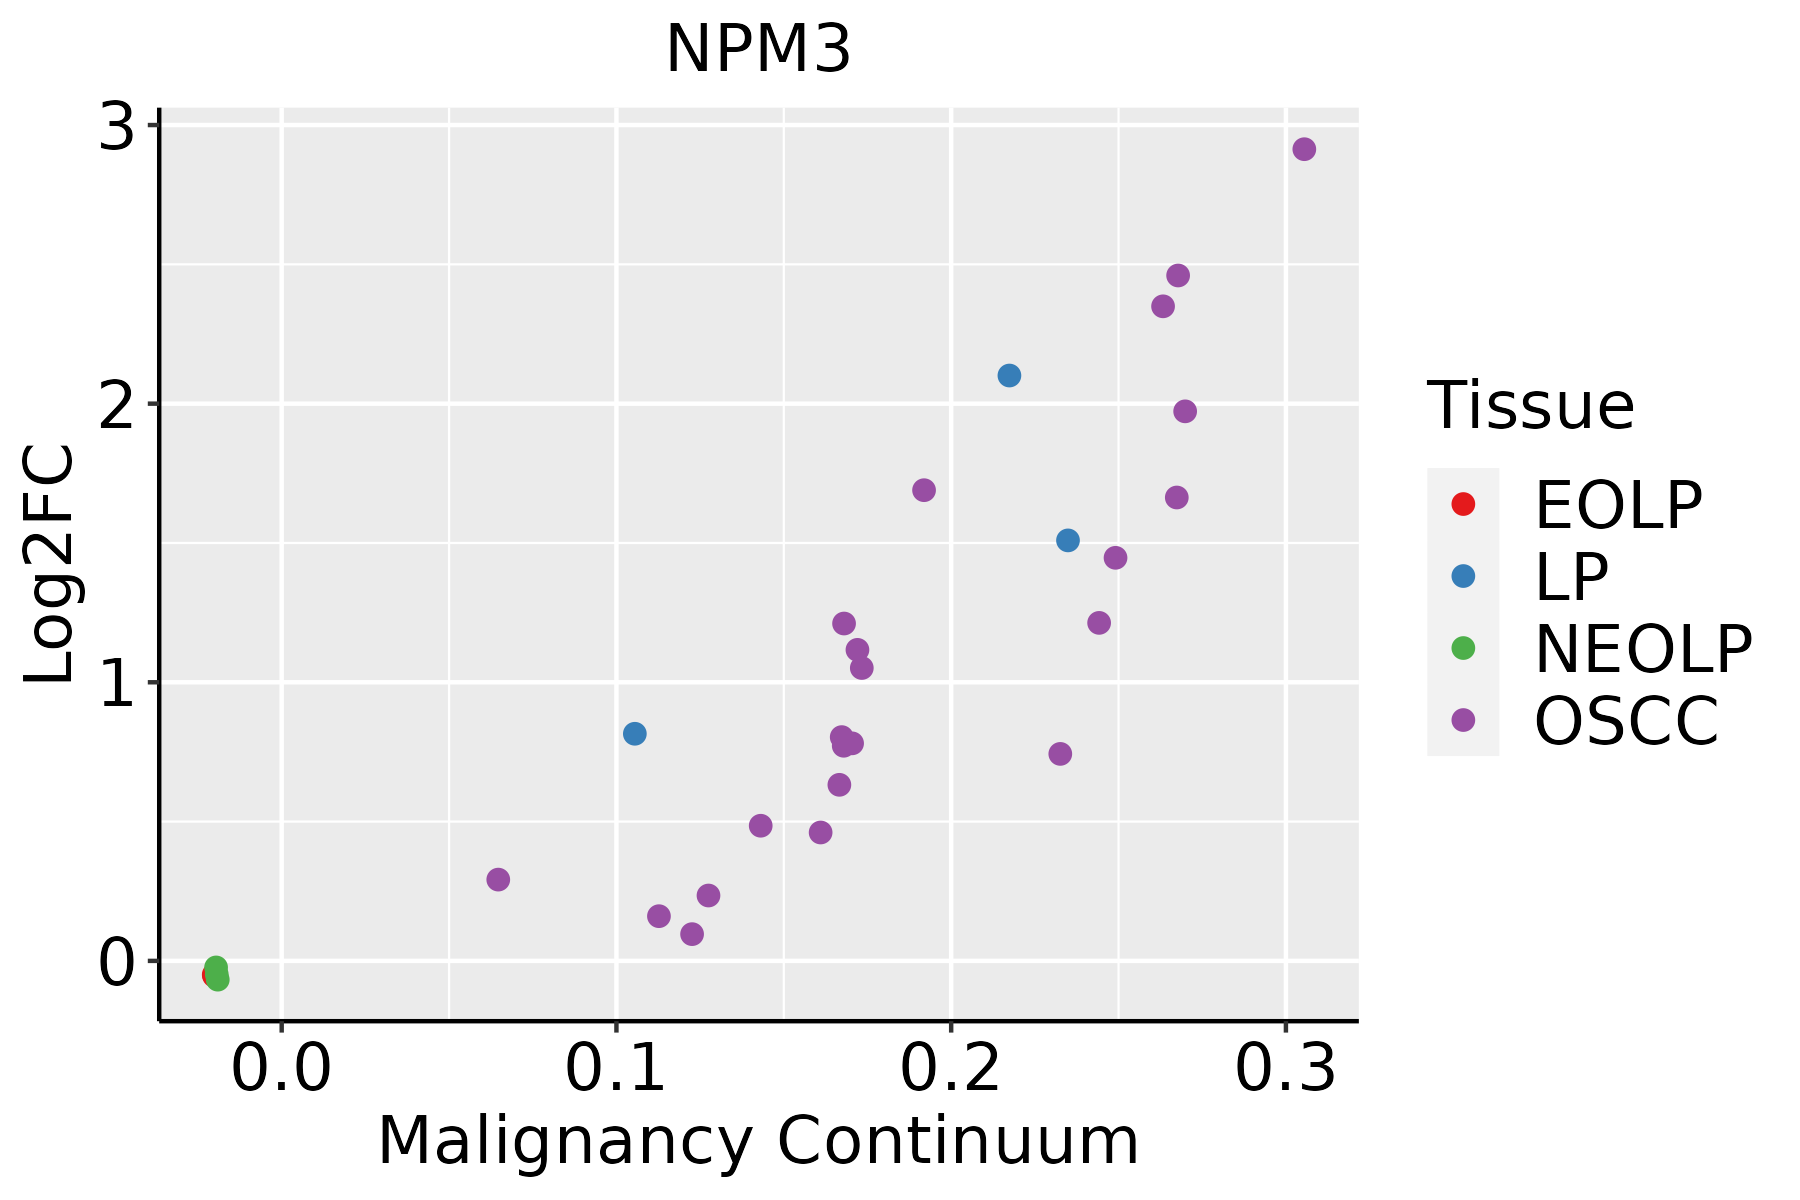 | EOLP: Erosive Oral lichen planus |
| LP: leukoplakia | ||
| NEOLP: Non-erosive oral lichen planus | ||
| OSCC: Oral squamous cell carcinoma | ||
| Skin |  | AK: Actinic keratosis |
| cSCC: Cutaneous squamous cell carcinoma | ||
| SCCIS:squamous cell carcinoma in situ | ||
| Thyroid | 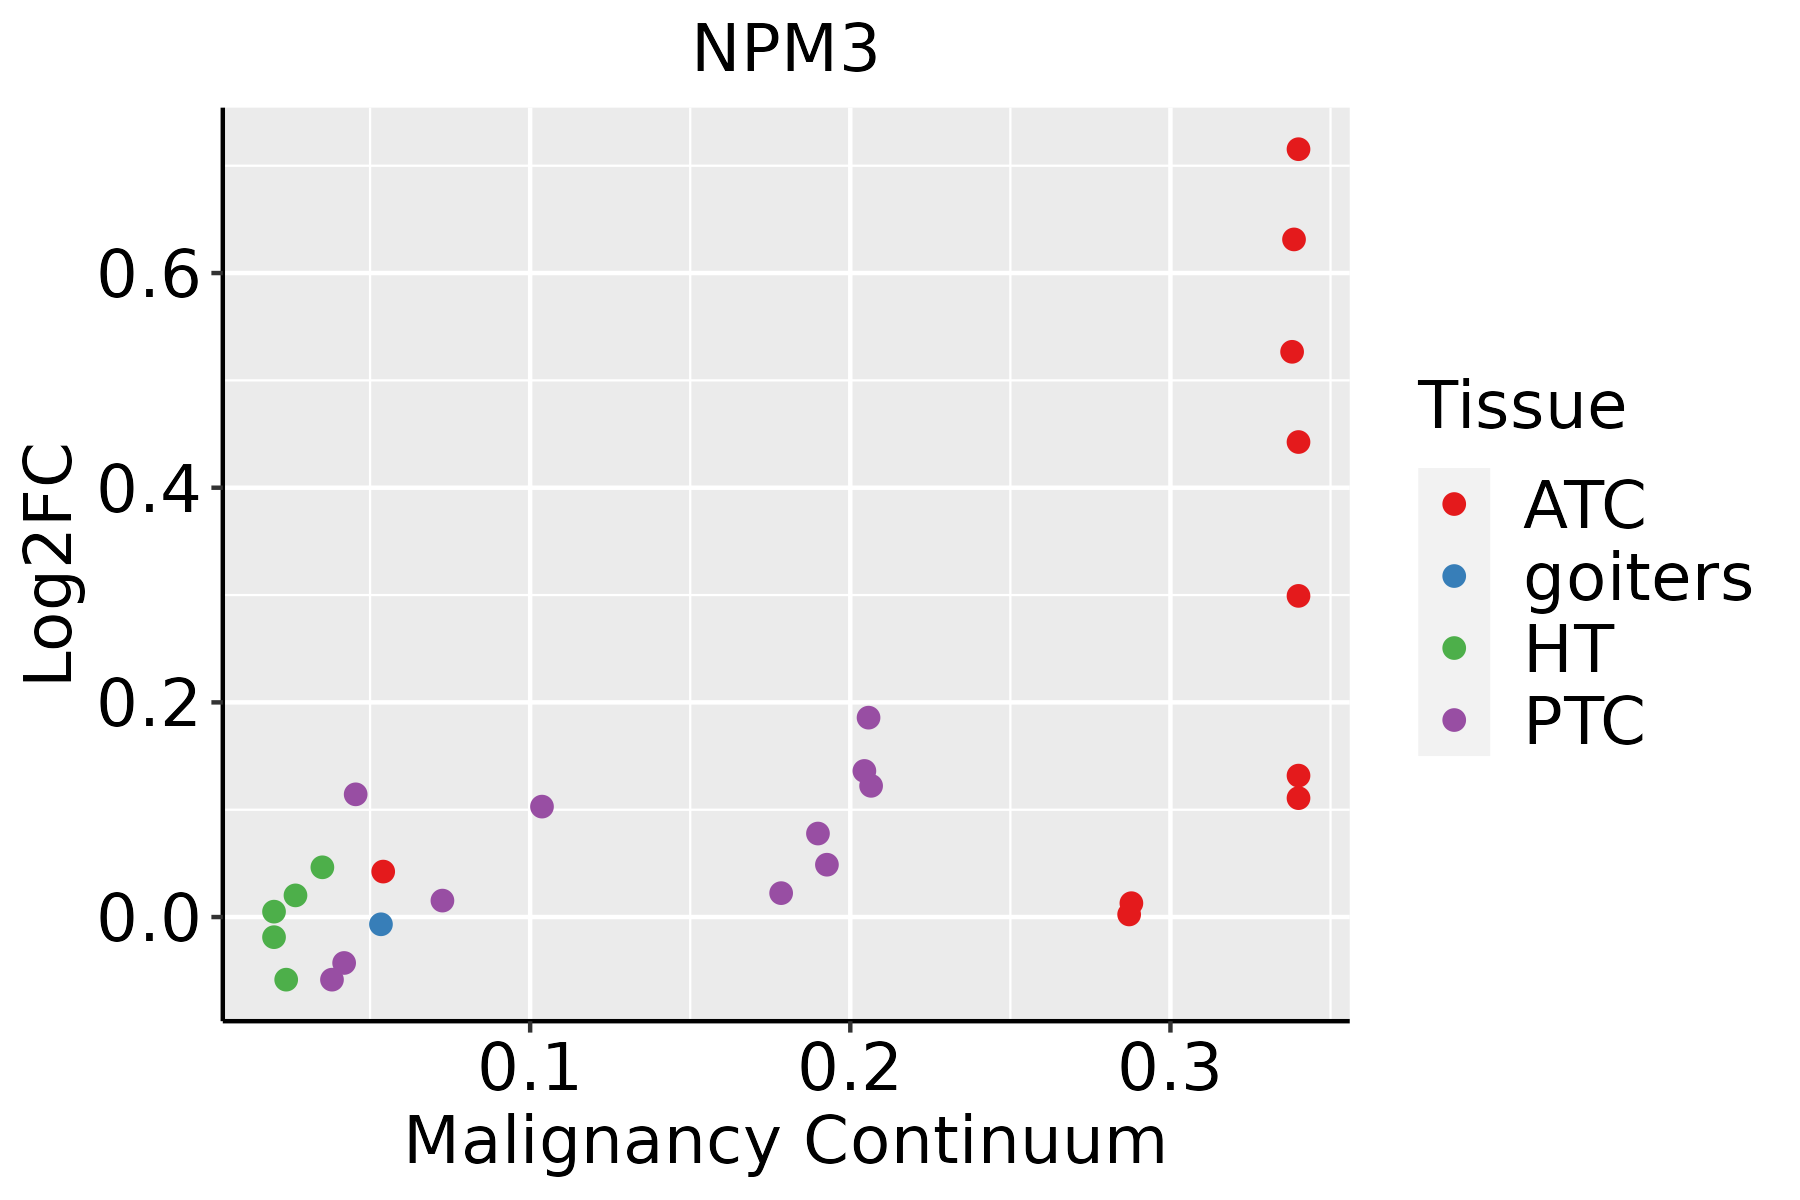 | ATC: Anaplastic thyroid cancer |
| HT: Hashimoto's thyroiditis | ||
| PTC: Papillary thyroid cancer |
| ∗log2FC in expression of this searched gene in stem-like cells from each diseased tissue sample relative to stem-like cells in normal samples in each tissue plotted against the malignancy continuum. Samples are colored based on if they are from different disease stage. |
Top |
Malignant transformation related pathway analysis |
| Find out the enriched GO biological processes and KEGG pathways involved in transition from healthy to precancer to cancer |
| Tissue | Disease Stage | Enriched GO biological Processes |
| Colorectum | AD |  |
| Colorectum | SER |  |
| Colorectum | MSS |  |
| Colorectum | MSI-H |  |
| Colorectum | FAP |  |
| ∗Top 15 enriched GO BP terms are showed in the bar plot of each disease state in each tissue. Each row represents a significant GO biological process which is colored according to the -log10(p.adjust). |
| Page: 1 2 3 4 5 6 7 8 9 |
| GO ID | Tissue | Disease Stage | Description | Gene Ratio | Bg Ratio | pvalue | p.adjust | Count |
| GO:0022613111 | Esophagus | ESCC | ribonucleoprotein complex biogenesis | 365/8552 | 463/18723 | 1.74e-49 | 1.11e-45 | 365 |
| GO:0042254111 | Esophagus | ESCC | ribosome biogenesis | 252/8552 | 299/18723 | 3.27e-44 | 1.04e-40 | 252 |
| GO:003447015 | Esophagus | ESCC | ncRNA processing | 300/8552 | 395/18723 | 3.09e-35 | 3.26e-32 | 300 |
| GO:0016072110 | Esophagus | ESCC | rRNA metabolic process | 197/8552 | 236/18723 | 1.31e-33 | 1.18e-30 | 197 |
| GO:0006364110 | Esophagus | ESCC | rRNA processing | 189/8552 | 225/18723 | 4.88e-33 | 3.87e-30 | 189 |
| GO:003466012 | Esophagus | ESCC | ncRNA metabolic process | 346/8552 | 485/18723 | 4.35e-31 | 2.51e-28 | 346 |
| GO:000632517 | Esophagus | ESCC | chromatin organization | 240/8552 | 409/18723 | 6.52e-08 | 1.14e-06 | 240 |
| GO:00987812 | Esophagus | ESCC | ncRNA transcription | 45/8552 | 56/18723 | 1.05e-07 | 1.72e-06 | 45 |
| GO:00093032 | Esophagus | ESCC | rRNA transcription | 28/8552 | 34/18723 | 1.21e-05 | 1.12e-04 | 28 |
| GO:002261312 | Liver | Cirrhotic | ribonucleoprotein complex biogenesis | 231/4634 | 463/18723 | 3.28e-32 | 6.86e-29 | 231 |
| GO:004225412 | Liver | Cirrhotic | ribosome biogenesis | 154/4634 | 299/18723 | 1.18e-23 | 6.72e-21 | 154 |
| GO:000636412 | Liver | Cirrhotic | rRNA processing | 115/4634 | 225/18723 | 1.12e-17 | 1.64e-15 | 115 |
| GO:00160724 | Liver | Cirrhotic | rRNA metabolic process | 119/4634 | 236/18723 | 1.19e-17 | 1.70e-15 | 119 |
| GO:00344701 | Liver | Cirrhotic | ncRNA processing | 158/4634 | 395/18723 | 1.09e-11 | 6.96e-10 | 158 |
| GO:00346603 | Liver | Cirrhotic | ncRNA metabolic process | 173/4634 | 485/18723 | 3.64e-08 | 1.21e-06 | 173 |
| GO:002261322 | Liver | HCC | ribonucleoprotein complex biogenesis | 355/7958 | 463/18723 | 7.76e-52 | 4.92e-48 | 355 |
| GO:004225422 | Liver | HCC | ribosome biogenesis | 246/7958 | 299/18723 | 4.99e-46 | 1.58e-42 | 246 |
| GO:00344702 | Liver | HCC | ncRNA processing | 293/7958 | 395/18723 | 4.26e-38 | 6.76e-35 | 293 |
| GO:001607212 | Liver | HCC | rRNA metabolic process | 193/7958 | 236/18723 | 1.26e-35 | 1.14e-32 | 193 |
| GO:000636421 | Liver | HCC | rRNA processing | 185/7958 | 225/18723 | 8.14e-35 | 6.45e-32 | 185 |
| Page: 1 2 3 4 |
| Pathway ID | Tissue | Disease Stage | Description | Gene Ratio | Bg Ratio | pvalue | p.adjust | qvalue | Count |
| Page: 1 |
Top |
Cell-cell communication analysis |
| Identification of potential cell-cell interactions between two cell types and their ligand-receptor pairs for different disease states |
| Ligand | Receptor | LRpair | Pathway | Tissue | Disease Stage |
| Page: 1 |
Top |
Single-cell gene regulatory network inference analysis |
| Find out the significant the regulons (TFs) and the target genes of each regulon across cell types for different disease states |
| TF | Cell Type | Tissue | Disease Stage | Target Gene | RSS | Regulon Activity |
| ∗The dot plots of a searched regulon are shown for all cell subpopulations in each disease state of each tissue based on the regulon specific score inferred using pySCENIC and by calculating the average expression. |
| Page: 1 |
Top |
Somatic mutation of malignant transformation related genes |
| Annotation of somatic variants for genes involved in malignant transformation |
| Hugo Symbol | Variant Class | Variant Classification | dbSNP RS | HGVSc | HGVSp | HGVSp Short | SWISSPROT | BIOTYPE | SIFT | PolyPhen | Tumor Sample Barcode | Tissue | Histology | Sex | Age | Stage | Therapy Types | Drugs | Outcome |
| NPM3 | SNV | Missense_Mutation | novel | c.342C>G | p.Phe114Leu | p.F114L | O75607 | protein_coding | deleterious(0.02) | possibly_damaging(0.545) | TCGA-5L-AAT1-01 | Breast | breast invasive carcinoma | Female | <65 | III/IV | Hormone Therapy | letrozol | SD |
| NPM3 | SNV | Missense_Mutation | rs773885926 | c.114N>A | p.Phe38Leu | p.F38L | O75607 | protein_coding | tolerated(1) | benign(0.009) | TCGA-AA-A010-01 | Colorectum | colon adenocarcinoma | Female | <65 | I/II | Chemotherapy | folinic | CR |
| NPM3 | SNV | Missense_Mutation | novel | c.325N>A | p.Leu109Ile | p.L109I | O75607 | protein_coding | deleterious(0.03) | possibly_damaging(0.672) | TCGA-A5-A1OF-01 | Endometrium | uterine corpus endometrioid carcinoma | Female | <65 | I/II | Unknown | Unknown | SD |
| NPM3 | SNV | Missense_Mutation | novel | c.480N>T | p.Glu160Asp | p.E160D | O75607 | protein_coding | tolerated(0.16) | benign(0) | TCGA-AP-A1DO-01 | Endometrium | uterine corpus endometrioid carcinoma | Female | <65 | I/II | Unknown | Unknown | SD |
| NPM3 | SNV | Missense_Mutation | rs771883465 | c.377C>T | p.Ser126Leu | p.S126L | O75607 | protein_coding | tolerated(0.07) | probably_damaging(0.957) | TCGA-E6-A1LX-01 | Endometrium | uterine corpus endometrioid carcinoma | Female | <65 | I/II | Unknown | Unknown | SD |
| NPM3 | SNV | Missense_Mutation | novel | c.422N>T | p.Thr141Met | p.T141M | O75607 | protein_coding | tolerated(0.13) | benign(0.06) | TCGA-EO-A3AY-01 | Endometrium | uterine corpus endometrioid carcinoma | Female | <65 | I/II | Unknown | Unknown | PD |
| NPM3 | insertion | Frame_Shift_Ins | novel | c.527_528insG | p.Arg177GlnfsTer21 | p.R177Qfs*21 | O75607 | protein_coding | TCGA-AX-A2HA-01 | Endometrium | uterine corpus endometrioid carcinoma | Female | <65 | I/II | Unknown | Unknown | SD | ||
| NPM3 | SNV | Missense_Mutation | c.193N>T | p.Ala65Ser | p.A65S | O75607 | protein_coding | tolerated(0.97) | possibly_damaging(0.76) | TCGA-44-6776-01 | Lung | lung adenocarcinoma | Female | <65 | I/II | Unknown | Unknown | SD | |
| NPM3 | SNV | Missense_Mutation | rs745777576 | c.217N>A | p.Glu73Lys | p.E73K | O75607 | protein_coding | tolerated(0.19) | benign(0.067) | TCGA-CN-A6V1-01 | Oral cavity | head & neck squamous cell carcinoma | Male | <65 | I/II | Immunotherapy | erbitux | CR |
| NPM3 | SNV | Missense_Mutation | c.394N>G | p.Arg132Gly | p.R132G | O75607 | protein_coding | deleterious(0.04) | benign(0.259) | TCGA-CV-A461-01 | Oral cavity | head & neck squamous cell carcinoma | Male | >=65 | I/II | Unknown | Unknown | SD |
| Page: 1 2 |
Top |
Related drugs of malignant transformation related genes |
| Identification of chemicals and drugs interact with genes involved in malignant transfromation |
| (DGIdb 4.0) |
| Entrez ID | Symbol | Category | Interaction Types | Drug Claim Name | Drug Name | PMIDs |
| Page: 1 |

Copyright 2023-Present -The University of Texas Health Science Center at Houston |