
|
|||||
|
 | |
| |
| |
| |
| |
| |
|
Gene: NNMT |
Gene summary for NNMT |
| Gene information | Species | Human | Gene symbol | NNMT | Gene ID | 4837 |
| Gene name | nicotinamide N-methyltransferase | |
| Gene Alias | NNMT | |
| Cytomap | 11q23.2 | |
| Gene Type | protein-coding | GO ID | GO:0005975 | UniProtAcc | P40261 |
Top |
Malignant transformation analysis |
| Identification of the aberrant gene expression in precancerous and cancerous lesions by comparing the gene expression of stem-like cells in diseased tissues with normal stem cells |
| Entrez ID | Symbol | Replicates | Species | Organ | Tissue | Adj P-value | Log2FC | Malignancy |
| 4837 | NNMT | NEOLP-1 | Human | Oral cavity | NEOLP | 1.12e-03 | 3.26e-01 | -0.0194 |
| 4837 | NNMT | NEOLP-2 | Human | Oral cavity | NEOLP | 3.51e-02 | 2.23e-01 | -0.0196 |
| 4837 | NNMT | SYSMH1 | Human | Oral cavity | OSCC | 5.31e-08 | -3.82e-01 | 0.1127 |
| 4837 | NNMT | SYSMH4 | Human | Oral cavity | OSCC | 2.21e-05 | -3.70e-01 | 0.1226 |
| 4837 | NNMT | SYSMH5 | Human | Oral cavity | OSCC | 1.60e-03 | 1.80e+00 | 0.0647 |
| 4837 | NNMT | GSM5252130_BPH340PrGF_Via | Human | Prostate | BPH | 8.82e-04 | 5.73e-01 | -0.1972 |
| 4837 | NNMT | GSM5252131_BPH340PrSF_Via | Human | Prostate | BPH | 1.34e-03 | 6.76e-01 | -0.2126 |
| 4837 | NNMT | GSM5252134_BPH511PrG_Fcol_3GEX | Human | Prostate | BPH | 3.29e-02 | 2.68e-01 | -0.1433 |
| 4837 | NNMT | GSM5252136_BPH556PrGA1_Fcol | Human | Prostate | BPH | 2.05e-12 | 6.85e-01 | -0.23 |
| 4837 | NNMT | 052095_1628-all-cells | Human | Prostate | BPH | 5.00e-05 | 2.88e-01 | 0.1032 |
| 4837 | NNMT | 052099_1652-all-cells | Human | Prostate | BPH | 2.66e-02 | 2.60e-01 | 0.1038 |
| 4837 | NNMT | Dong_P1 | Human | Prostate | Tumor | 1.07e-42 | 5.87e-01 | 0.035 |
| 4837 | NNMT | Dong_P3 | Human | Prostate | Tumor | 5.65e-06 | 1.57e-01 | 0.0278 |
| 4837 | NNMT | Dong_P5 | Human | Prostate | Tumor | 1.82e-02 | 1.18e-01 | 0.053 |
| 4837 | NNMT | P7 | Human | Prostate | Tumor | 7.28e-05 | 7.22e-01 | -0.1025 |
| 4837 | NNMT | P1_S1_AK | Human | Skin | AK | 1.04e-28 | -7.46e-01 | -0.3399 |
| 4837 | NNMT | P2_S3_AK | Human | Skin | AK | 2.73e-17 | -6.87e-01 | -0.3287 |
| 4837 | NNMT | P2_S4_SCCIS | Human | Skin | SCCIS | 6.05e-13 | -6.15e-01 | -0.3043 |
| 4837 | NNMT | P3_S6_AK | Human | Skin | AK | 1.03e-29 | -7.83e-01 | -0.3256 |
| 4837 | NNMT | P4_S8_cSCC | Human | Skin | cSCC | 1.66e-22 | -8.10e-01 | -0.3095 |
| Page: 1 2 3 4 5 6 7 8 |
| Tissue | Expression Dynamics | Abbreviation |
| Breast | 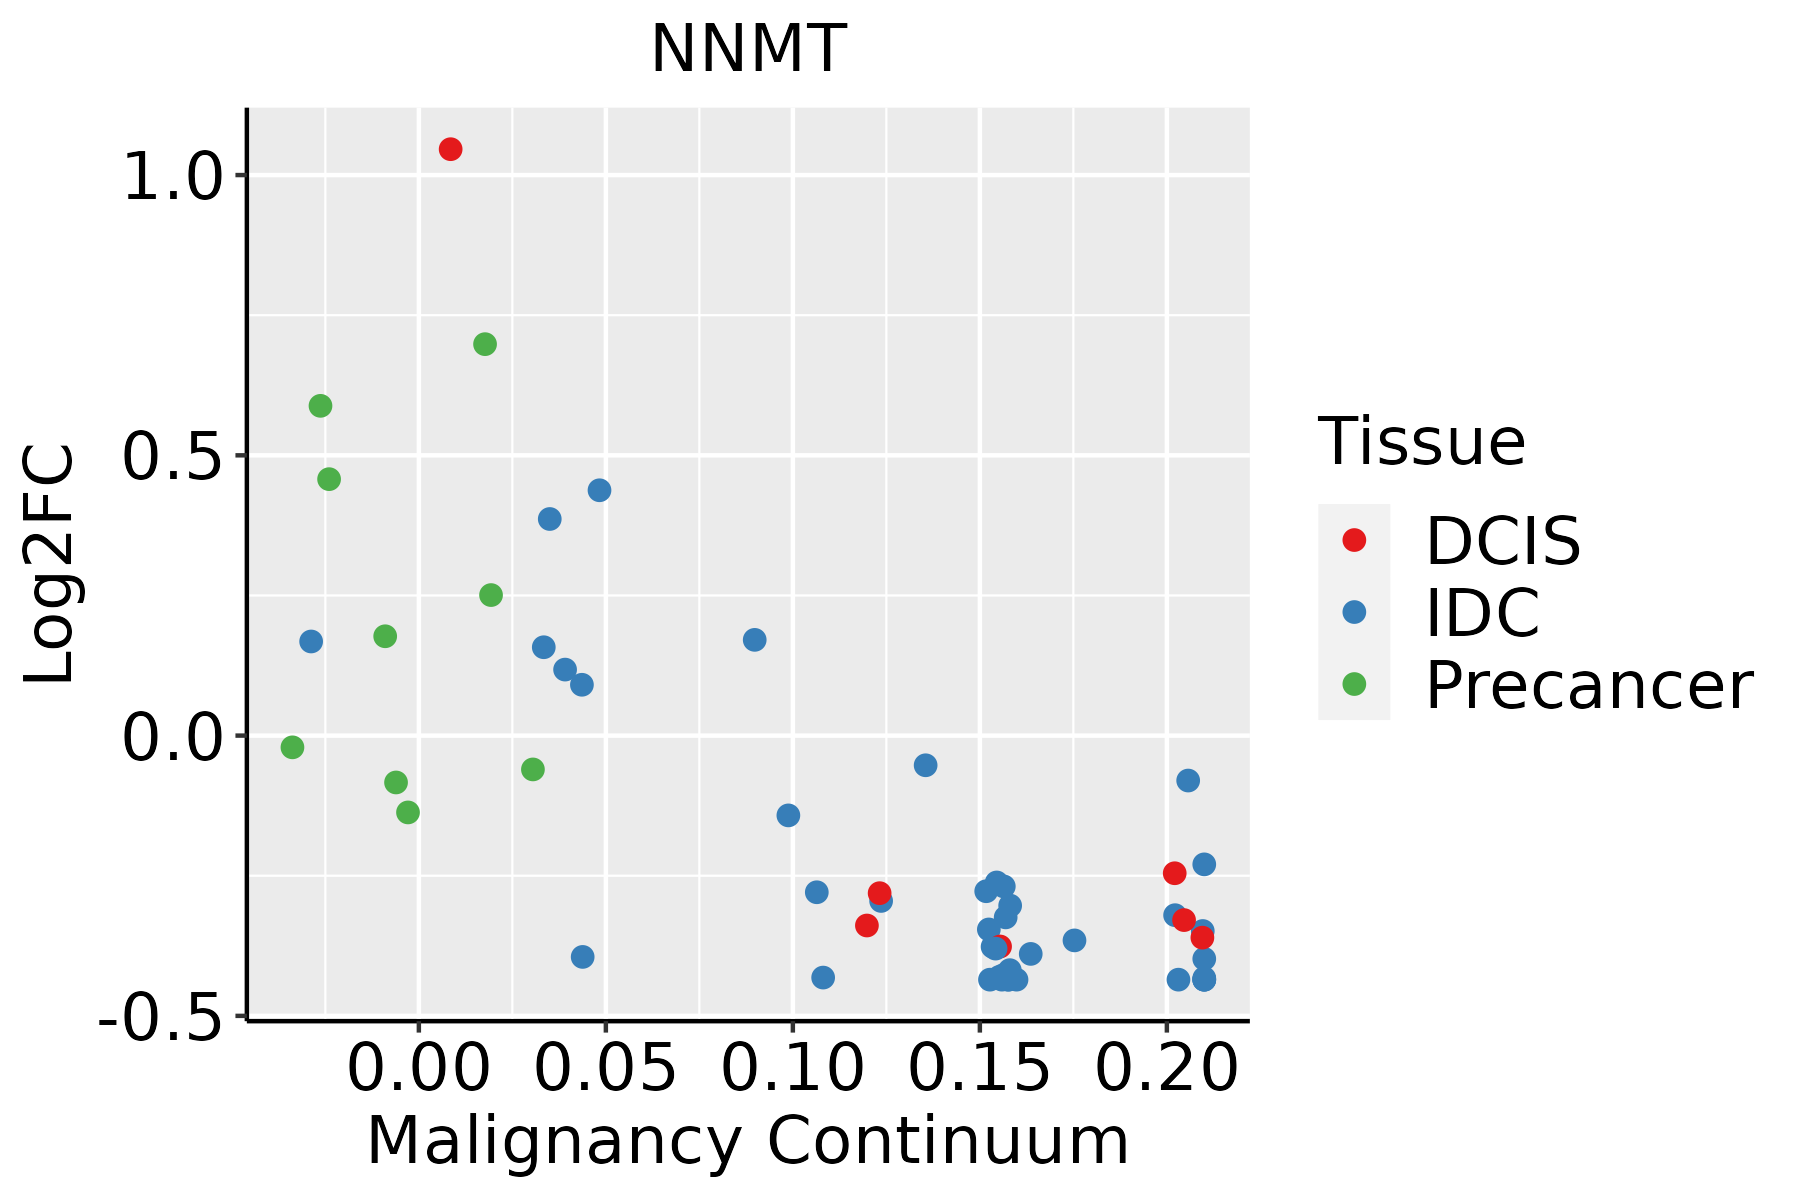 | IDC: Invasive ductal carcinoma |
| DCIS: Ductal carcinoma in situ | ||
| Precancer(BRCA1-mut): Precancerous lesion from BRCA1 mutation carriers | ||
| Cervix | 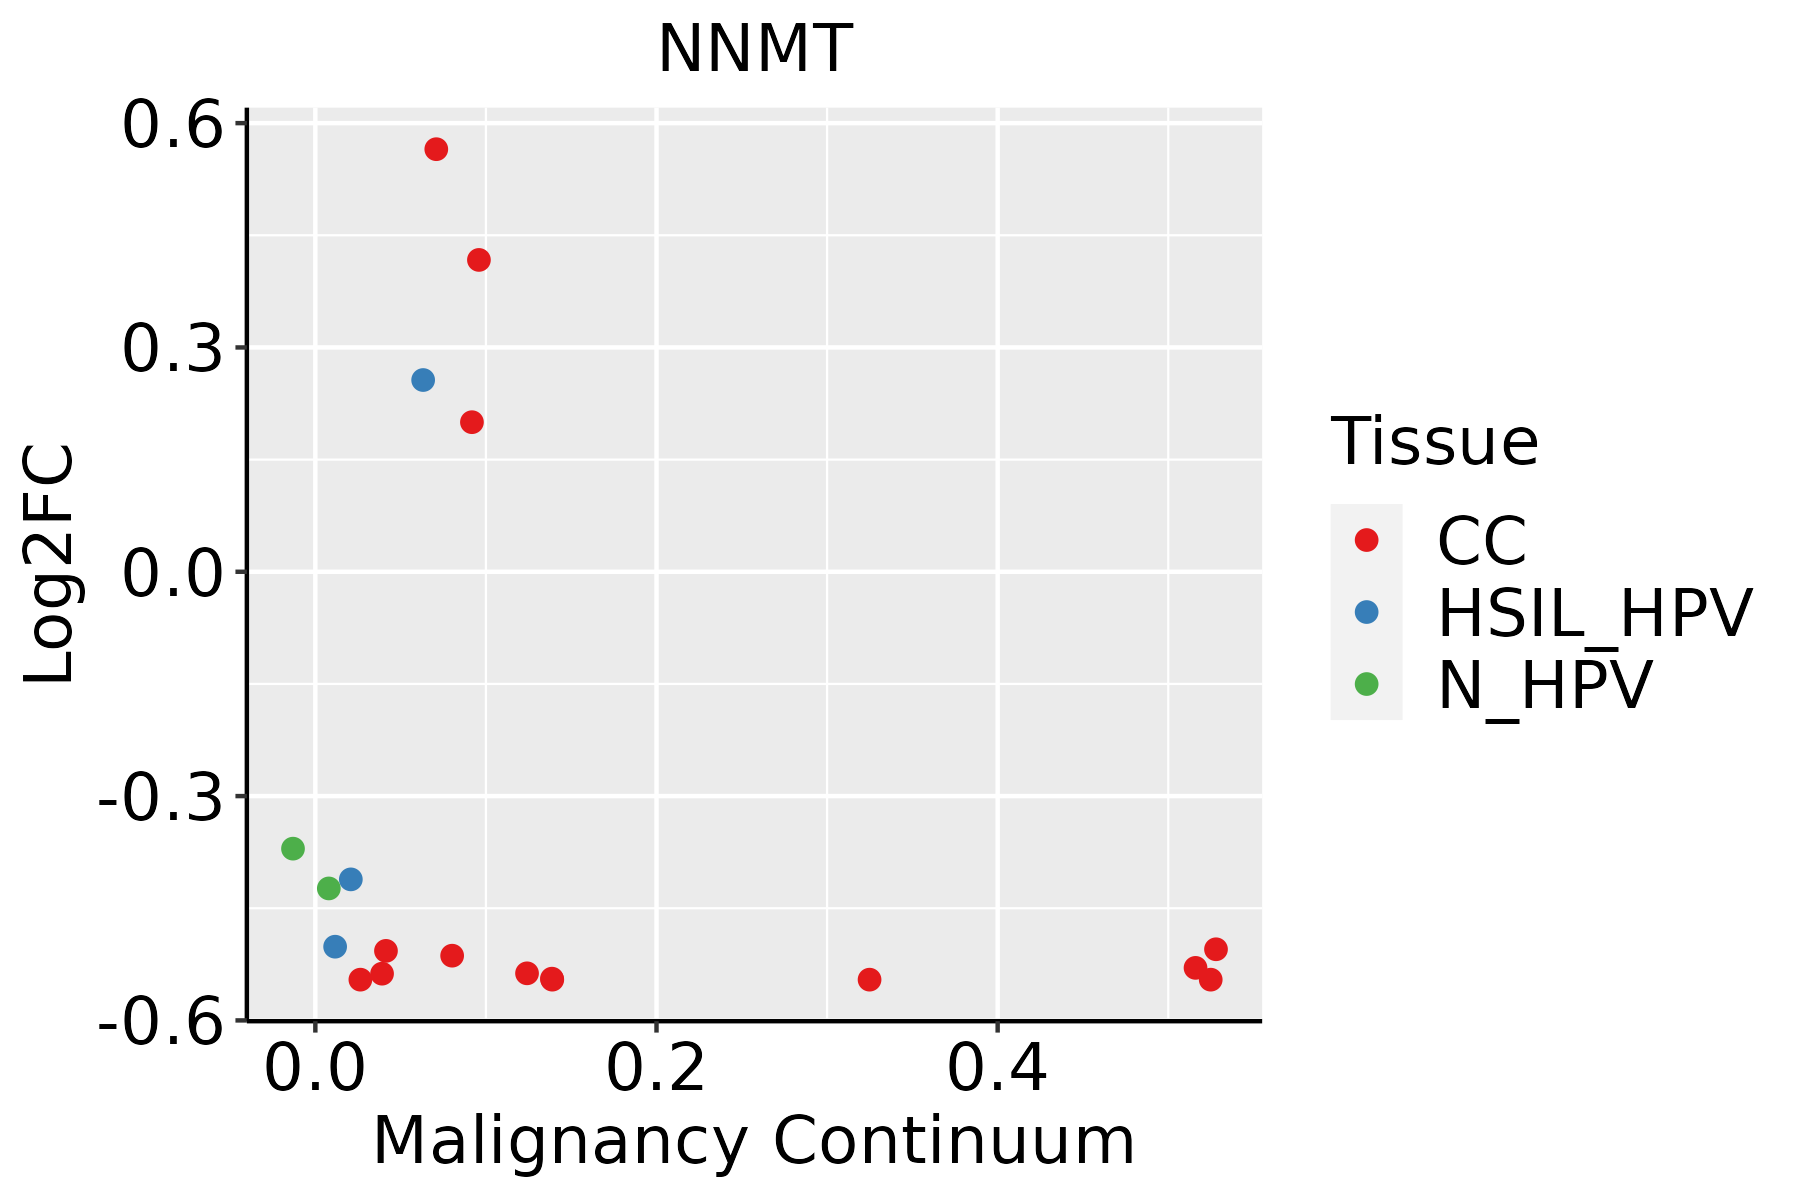 | CC: Cervix cancer |
| HSIL_HPV: HPV-infected high-grade squamous intraepithelial lesions | ||
| N_HPV: HPV-infected normal cervix | ||
| Esophagus | 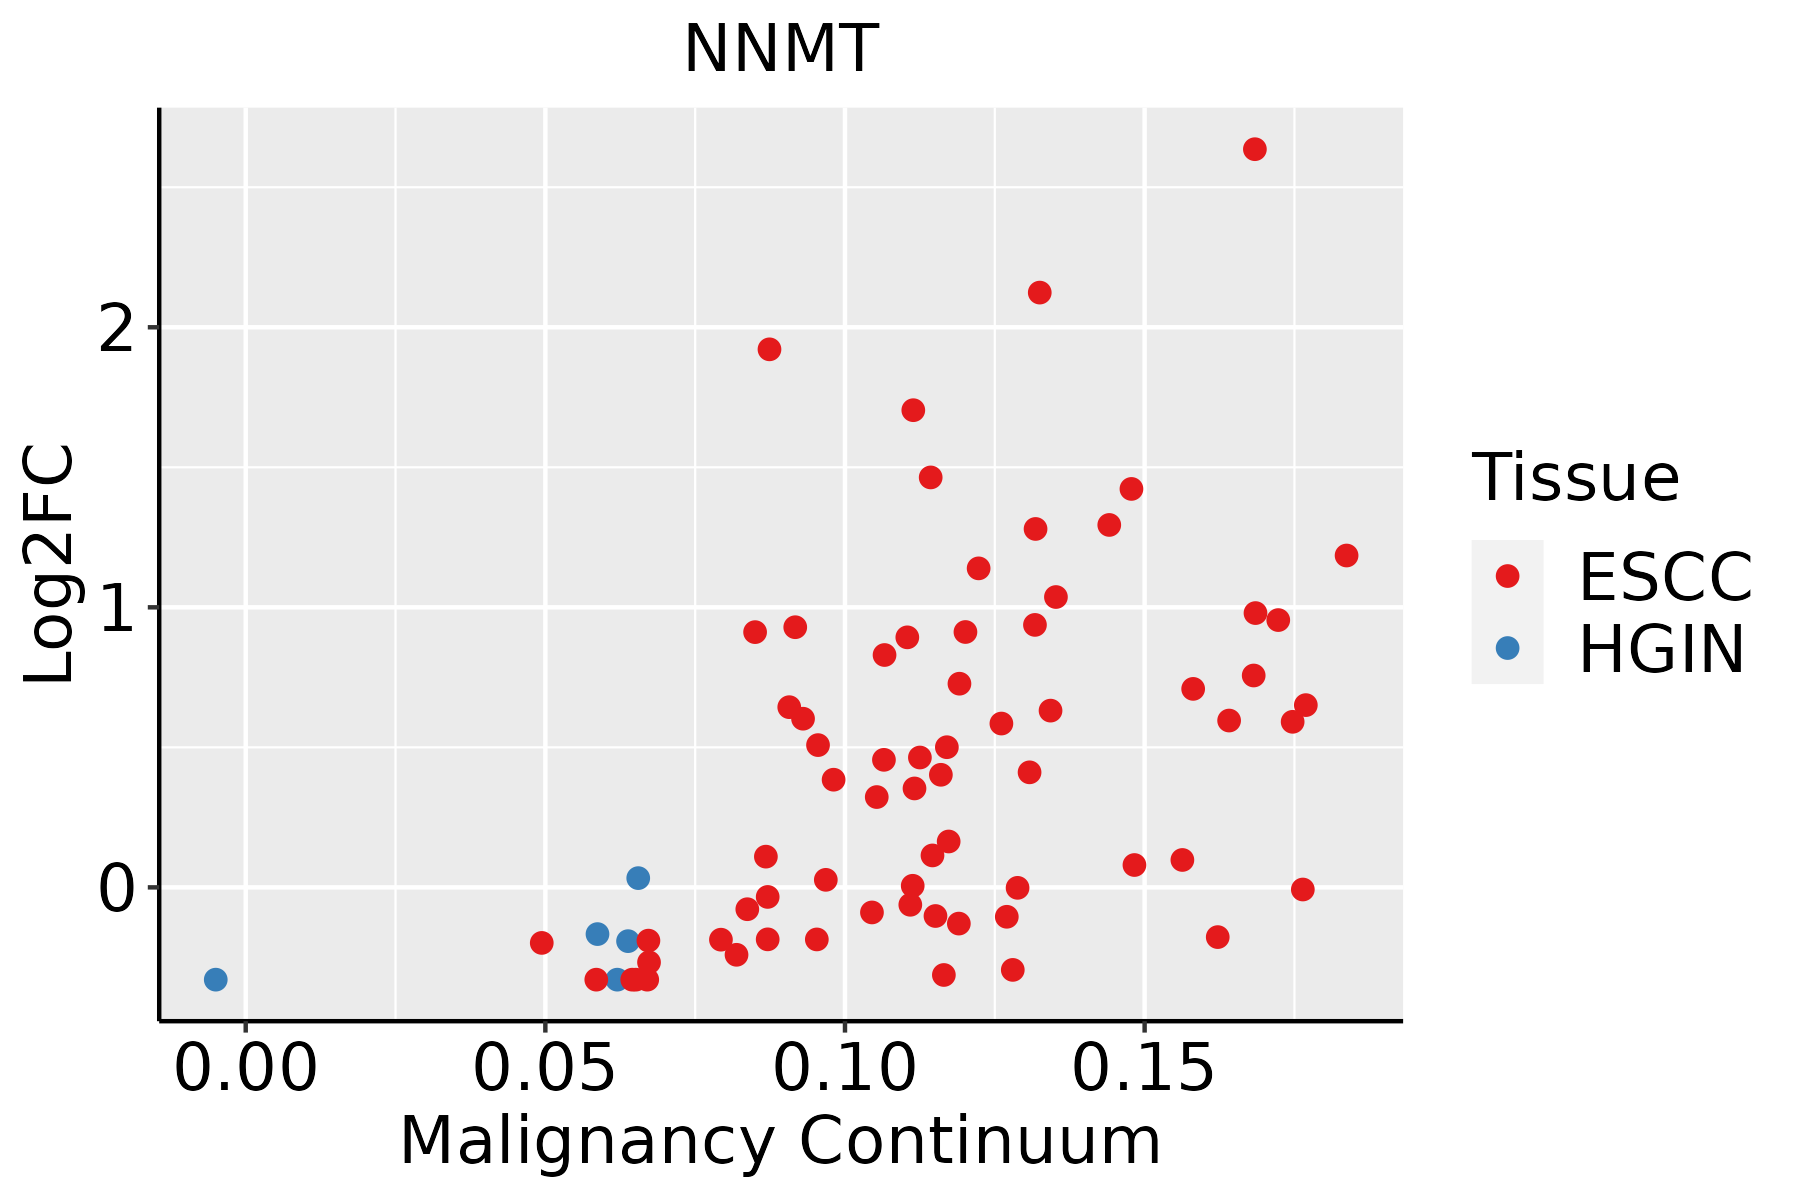 | ESCC: Esophageal squamous cell carcinoma |
| HGIN: High-grade intraepithelial neoplasias | ||
| LGIN: Low-grade intraepithelial neoplasias | ||
| Liver | 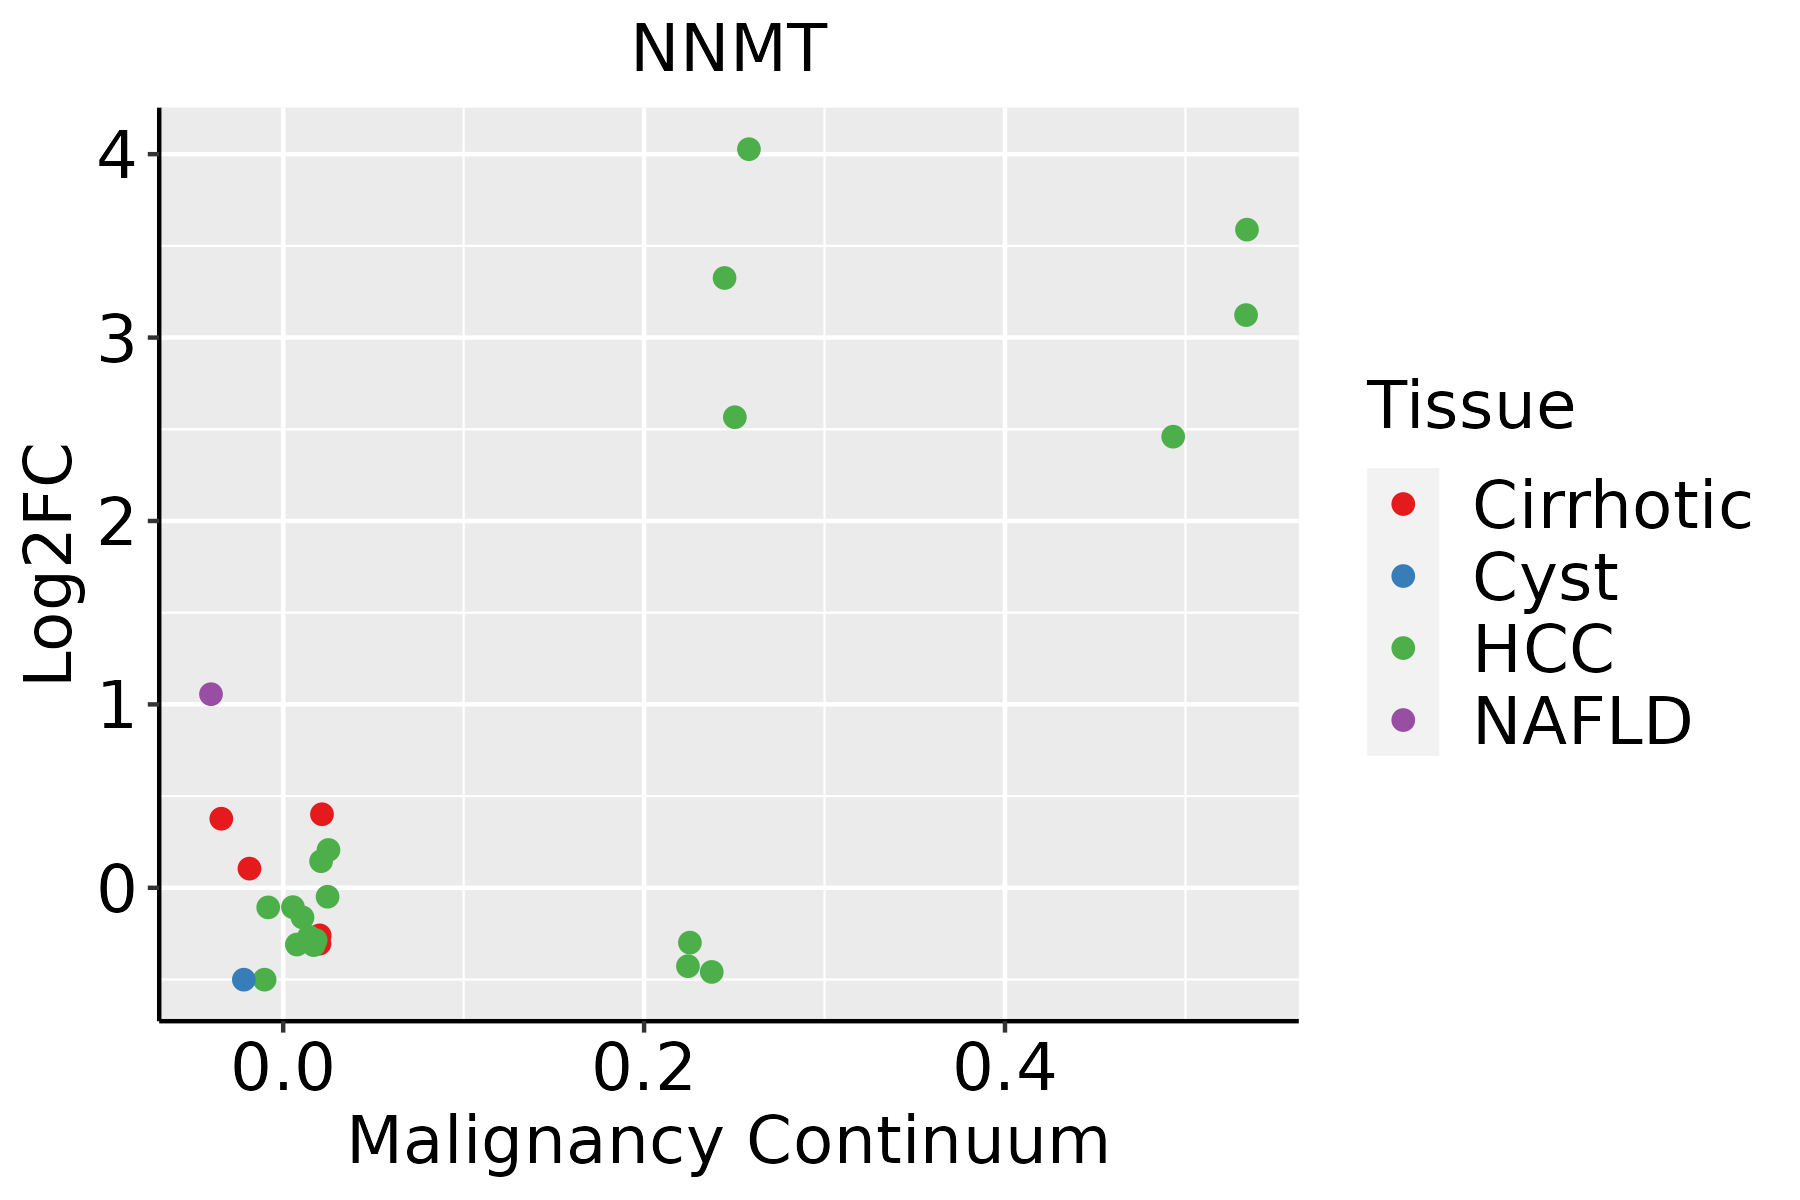 | HCC: Hepatocellular carcinoma |
| NAFLD: Non-alcoholic fatty liver disease | ||
| Oral Cavity | 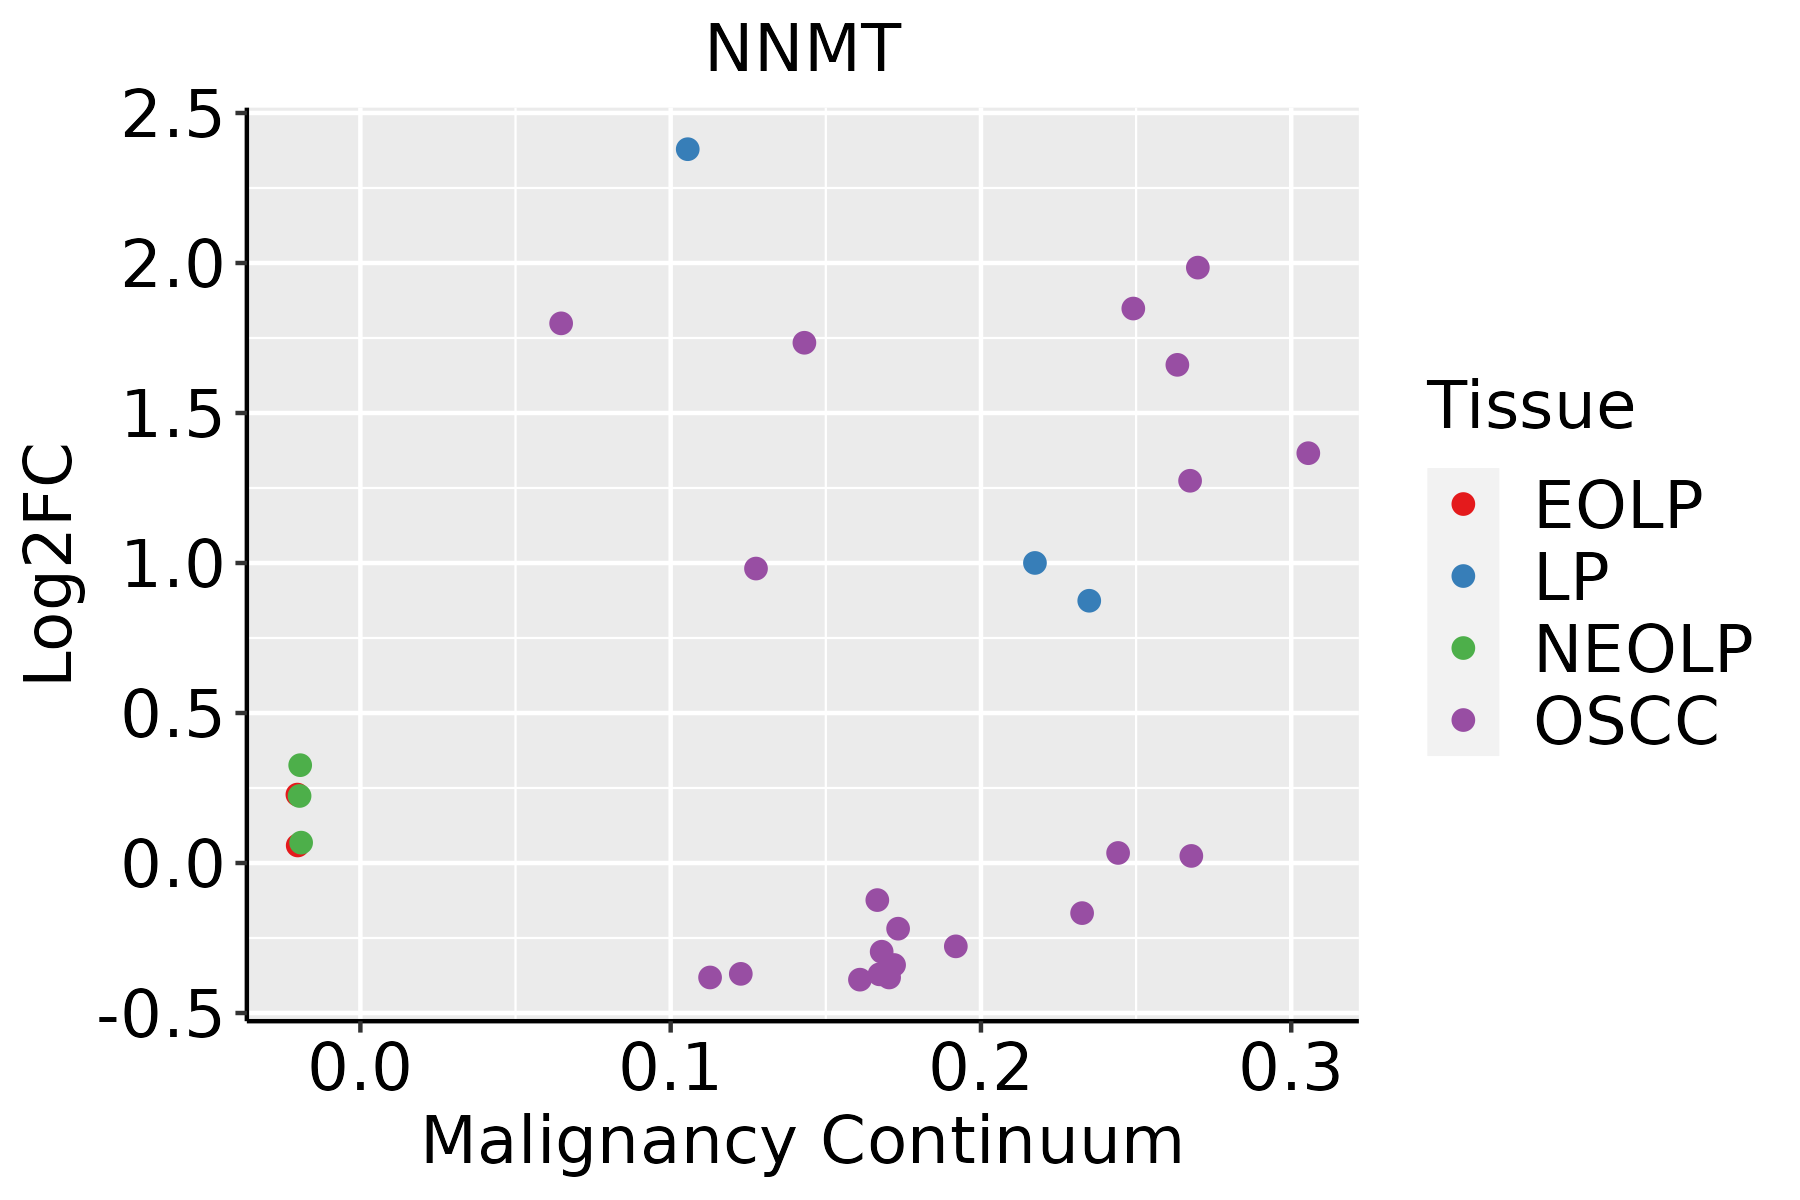 | EOLP: Erosive Oral lichen planus |
| LP: leukoplakia | ||
| NEOLP: Non-erosive oral lichen planus | ||
| OSCC: Oral squamous cell carcinoma | ||
| Prostate | 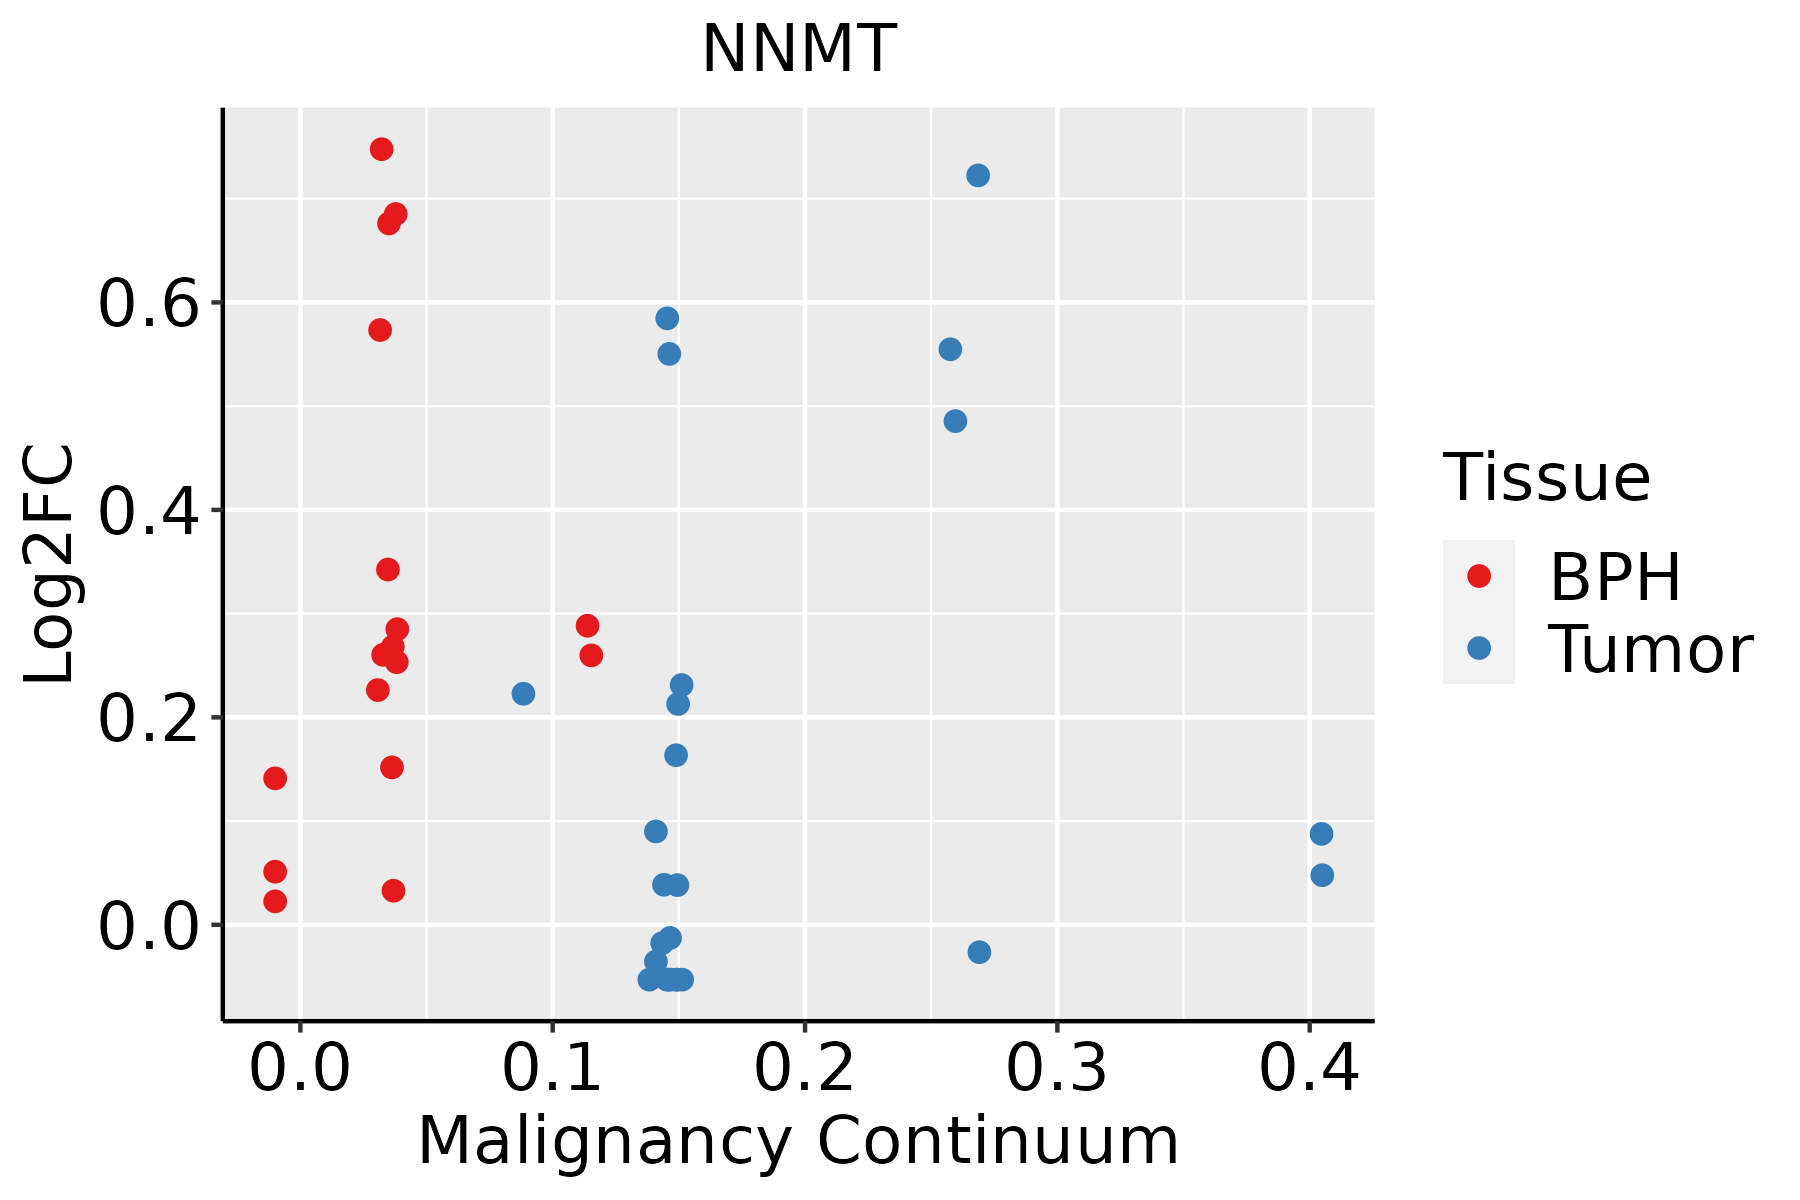 | BPH: Benign Prostatic Hyperplasia |
| Skin | 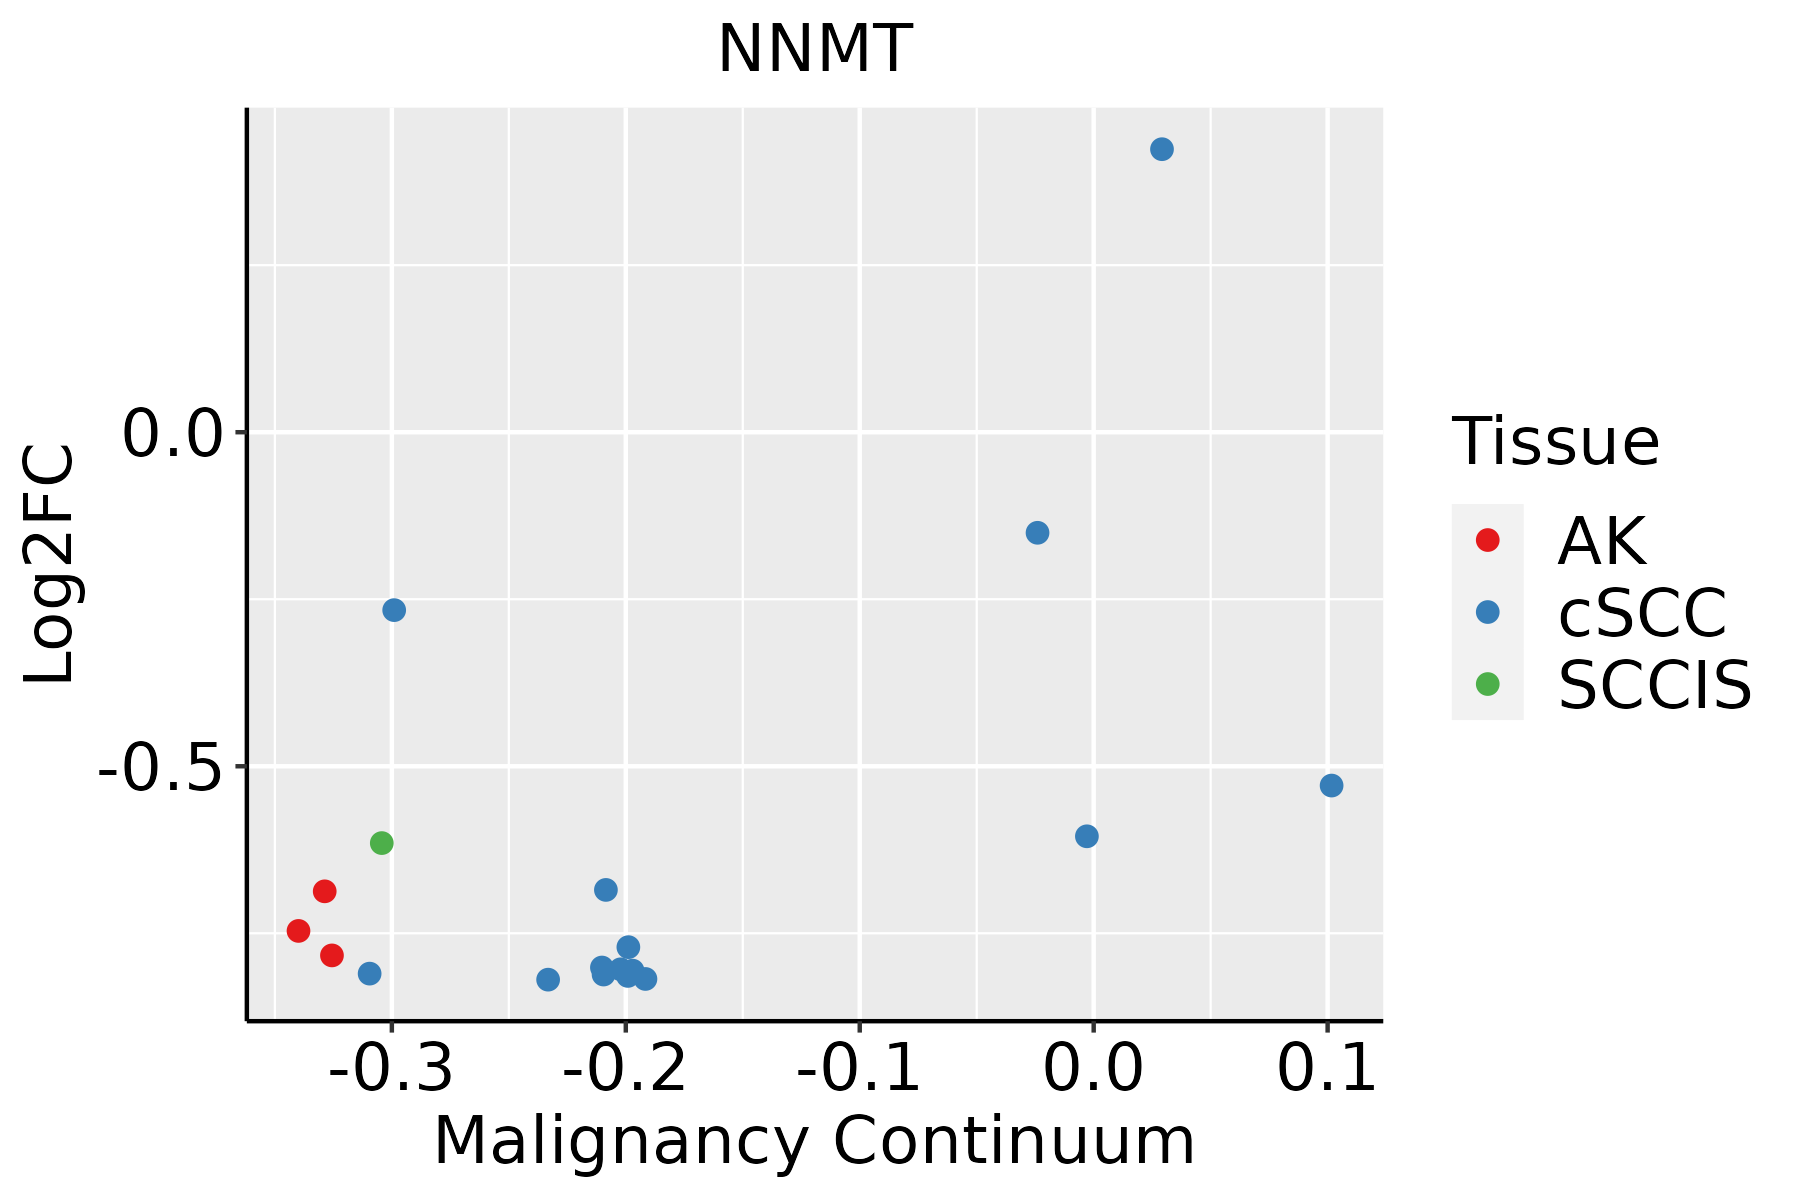 | AK: Actinic keratosis |
| cSCC: Cutaneous squamous cell carcinoma | ||
| SCCIS:squamous cell carcinoma in situ | ||
| Thyroid | 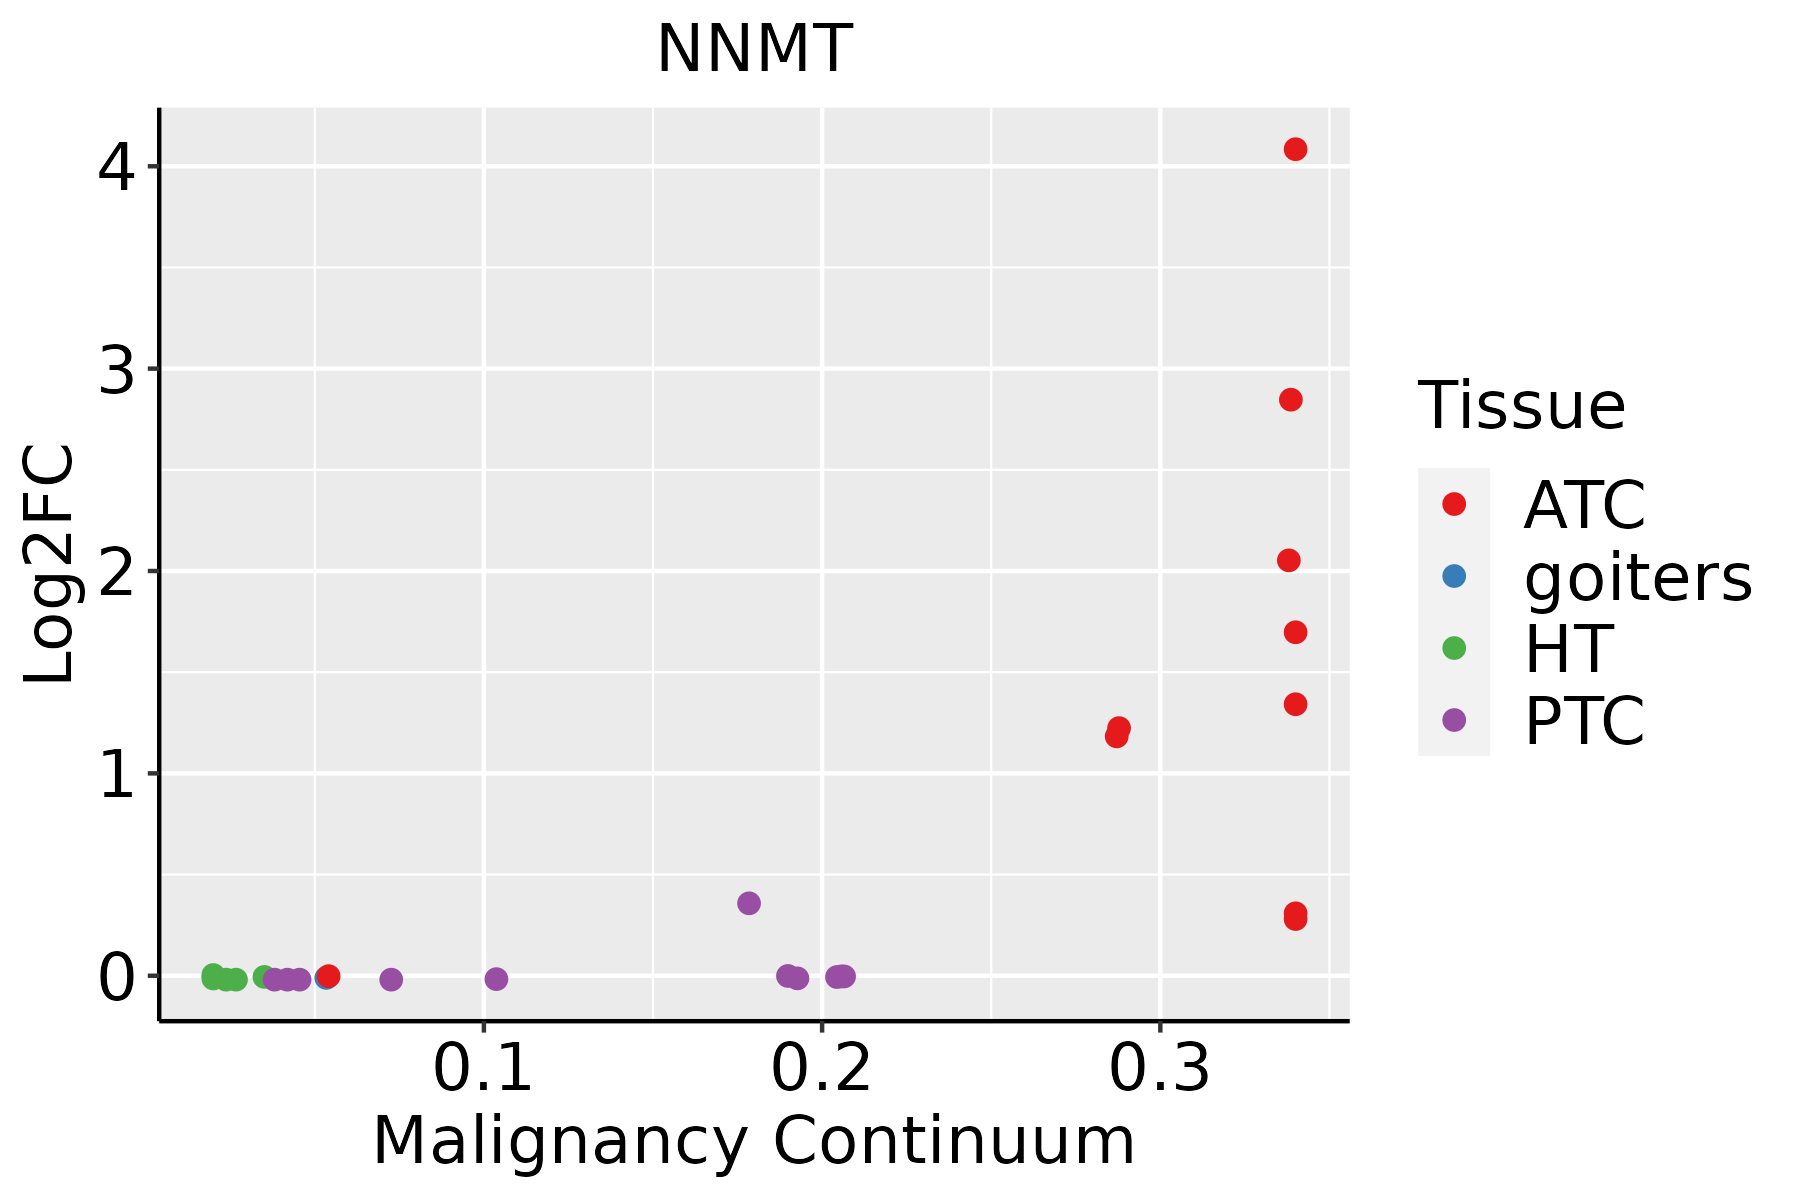 | ATC: Anaplastic thyroid cancer |
| HT: Hashimoto's thyroiditis | ||
| PTC: Papillary thyroid cancer |
| ∗log2FC in expression of this searched gene in stem-like cells from each diseased tissue sample relative to stem-like cells in normal samples in each tissue plotted against the malignancy continuum. Samples are colored based on if they are from different disease stage. |
Top |
Malignant transformation related pathway analysis |
| Find out the enriched GO biological processes and KEGG pathways involved in transition from healthy to precancer to cancer |
| Tissue | Disease Stage | Enriched GO biological Processes |
| Colorectum | AD |  |
| Colorectum | SER |  |
| Colorectum | MSS |  |
| Colorectum | MSI-H |  |
| Colorectum | FAP |  |
| ∗Top 15 enriched GO BP terms are showed in the bar plot of each disease state in each tissue. Each row represents a significant GO biological process which is colored according to the -log10(p.adjust). |
| Page: 1 2 3 4 5 6 7 8 9 |
| GO ID | Tissue | Disease Stage | Description | Gene Ratio | Bg Ratio | pvalue | p.adjust | Count |
| GO:00091179 | Breast | Precancer | nucleotide metabolic process | 56/1080 | 489/18723 | 7.40e-07 | 3.00e-05 | 56 |
| GO:00067539 | Breast | Precancer | nucleoside phosphate metabolic process | 56/1080 | 497/18723 | 1.24e-06 | 4.70e-05 | 56 |
| GO:00091655 | Breast | Precancer | nucleotide biosynthetic process | 32/1080 | 254/18723 | 2.72e-05 | 6.21e-04 | 32 |
| GO:19012935 | Breast | Precancer | nucleoside phosphate biosynthetic process | 32/1080 | 256/18723 | 3.18e-05 | 6.97e-04 | 32 |
| GO:00311004 | Breast | Precancer | animal organ regeneration | 14/1080 | 76/18723 | 9.92e-05 | 1.83e-03 | 14 |
| GO:00310995 | Breast | Precancer | regeneration | 25/1080 | 198/18723 | 1.91e-04 | 3.06e-03 | 25 |
| GO:00094108 | Breast | Precancer | response to xenobiotic stimulus | 45/1080 | 462/18723 | 4.17e-04 | 5.56e-03 | 45 |
| GO:00060066 | Breast | Precancer | glucose metabolic process | 23/1080 | 196/18723 | 9.54e-04 | 1.07e-02 | 23 |
| GO:00059966 | Breast | Precancer | monosaccharide metabolic process | 27/1080 | 257/18723 | 1.94e-03 | 1.88e-02 | 27 |
| GO:00193186 | Breast | Precancer | hexose metabolic process | 25/1080 | 237/18723 | 2.64e-03 | 2.36e-02 | 25 |
| GO:00620126 | Breast | Precancer | regulation of small molecule metabolic process | 32/1080 | 334/18723 | 3.45e-03 | 2.87e-02 | 32 |
| GO:0042401 | Breast | Precancer | cellular biogenic amine biosynthetic process | 7/1080 | 37/18723 | 4.68e-03 | 3.60e-02 | 7 |
| GO:0009309 | Breast | Precancer | amine biosynthetic process | 7/1080 | 38/18723 | 5.46e-03 | 4.01e-02 | 7 |
| GO:00065963 | Breast | Precancer | polyamine biosynthetic process | 4/1080 | 14/18723 | 6.92e-03 | 4.67e-02 | 4 |
| GO:000675313 | Breast | IDC | nucleoside phosphate metabolic process | 68/1434 | 497/18723 | 2.01e-06 | 8.23e-05 | 68 |
| GO:000911713 | Breast | IDC | nucleotide metabolic process | 67/1434 | 489/18723 | 2.28e-06 | 9.05e-05 | 67 |
| GO:190129313 | Breast | IDC | nucleoside phosphate biosynthetic process | 41/1434 | 256/18723 | 5.15e-06 | 1.73e-04 | 41 |
| GO:000916513 | Breast | IDC | nucleotide biosynthetic process | 40/1434 | 254/18723 | 1.01e-05 | 2.81e-04 | 40 |
| GO:000941013 | Breast | IDC | response to xenobiotic stimulus | 62/1434 | 462/18723 | 1.05e-05 | 2.88e-04 | 62 |
| GO:003110012 | Breast | IDC | animal organ regeneration | 17/1434 | 76/18723 | 4.85e-05 | 1.07e-03 | 17 |
| Page: 1 2 3 4 5 6 7 8 9 10 11 12 13 14 15 16 17 18 19 20 21 |
| Pathway ID | Tissue | Disease Stage | Description | Gene Ratio | Bg Ratio | pvalue | p.adjust | qvalue | Count |
| Page: 1 |
Top |
Cell-cell communication analysis |
| Identification of potential cell-cell interactions between two cell types and their ligand-receptor pairs for different disease states |
| Ligand | Receptor | LRpair | Pathway | Tissue | Disease Stage |
| Page: 1 |
Top |
Single-cell gene regulatory network inference analysis |
| Find out the significant the regulons (TFs) and the target genes of each regulon across cell types for different disease states |
| TF | Cell Type | Tissue | Disease Stage | Target Gene | RSS | Regulon Activity |
| ∗The dot plots of a searched regulon are shown for all cell subpopulations in each disease state of each tissue based on the regulon specific score inferred using pySCENIC and by calculating the average expression. |
| Page: 1 |
Top |
Somatic mutation of malignant transformation related genes |
| Annotation of somatic variants for genes involved in malignant transformation |
| Hugo Symbol | Variant Class | Variant Classification | dbSNP RS | HGVSc | HGVSp | HGVSp Short | SWISSPROT | BIOTYPE | SIFT | PolyPhen | Tumor Sample Barcode | Tissue | Histology | Sex | Age | Stage | Therapy Types | Drugs | Outcome |
| NNMT | deletion | Frame_Shift_Del | novel | c.175delN | p.Leu59Ter | p.L59* | P40261 | protein_coding | TCGA-D8-A27V-01 | Breast | breast invasive carcinoma | Female | <65 | I/II | Hormone Therapy | tamoxiphen | SD | ||
| NNMT | SNV | Missense_Mutation | rs141072720 | c.52N>T | p.Arg18Trp | p.R18W | P40261 | protein_coding | deleterious(0) | possibly_damaging(0.865) | TCGA-C5-A7CK-01 | Cervix | cervical & endocervical cancer | Female | <65 | I/II | Chemotherapy | cisplatin | SD |
| NNMT | SNV | Missense_Mutation | c.616N>C | p.Ile206Leu | p.I206L | P40261 | protein_coding | deleterious(0.01) | benign(0.08) | TCGA-AA-3510-01 | Colorectum | colon adenocarcinoma | Male | >=65 | I/II | Unknown | Unknown | SD | |
| NNMT | SNV | Missense_Mutation | novel | c.703N>G | p.Phe235Val | p.F235V | P40261 | protein_coding | tolerated(0.27) | benign(0.445) | TCGA-AA-3663-01 | Colorectum | colon adenocarcinoma | Male | <65 | I/II | Unknown | Unknown | SD |
| NNMT | SNV | Missense_Mutation | rs750805211 | c.697N>A | p.Glu233Lys | p.E233K | P40261 | protein_coding | tolerated(0.52) | benign(0.015) | TCGA-AG-A002-01 | Colorectum | rectum adenocarcinoma | Male | <65 | I/II | Unknown | Unknown | SD |
| NNMT | SNV | Missense_Mutation | c.141G>T | p.Lys47Asn | p.K47N | P40261 | protein_coding | deleterious(0.02) | benign(0.151) | TCGA-A5-A0G1-01 | Endometrium | uterine corpus endometrioid carcinoma | Female | >=65 | I/II | Unknown | Unknown | SD | |
| NNMT | SNV | Missense_Mutation | novel | c.56N>C | p.Asp19Ala | p.D19A | P40261 | protein_coding | tolerated(0.5) | benign(0.006) | TCGA-A5-A1OF-01 | Endometrium | uterine corpus endometrioid carcinoma | Female | <65 | I/II | Unknown | Unknown | SD |
| NNMT | SNV | Missense_Mutation | novel | c.187N>T | p.Gly63Cys | p.G63C | P40261 | protein_coding | deleterious(0) | probably_damaging(1) | TCGA-A5-A2K5-01 | Endometrium | uterine corpus endometrioid carcinoma | Female | >=65 | I/II | Unknown | Unknown | SD |
| NNMT | SNV | Missense_Mutation | c.133N>A | p.Leu45Ile | p.L45I | P40261 | protein_coding | deleterious(0.04) | benign(0.283) | TCGA-AP-A051-01 | Endometrium | uterine corpus endometrioid carcinoma | Female | >=65 | I/II | Unknown | Unknown | SD | |
| NNMT | SNV | Missense_Mutation | c.416N>C | p.Leu139Pro | p.L139P | P40261 | protein_coding | deleterious(0) | probably_damaging(1) | TCGA-AP-A051-01 | Endometrium | uterine corpus endometrioid carcinoma | Female | >=65 | I/II | Unknown | Unknown | SD |
| Page: 1 2 3 4 |
Top |
Related drugs of malignant transformation related genes |
| Identification of chemicals and drugs interact with genes involved in malignant transfromation |
| (DGIdb 4.0) |
| Entrez ID | Symbol | Category | Interaction Types | Drug Claim Name | Drug Name | PMIDs |
| 4837 | NNMT | DRUGGABLE GENOME | NIACIN | NIACIN | ||
| 4837 | NNMT | DRUGGABLE GENOME | ARI-3037MO |
| Page: 1 |

Copyright 2023-Present -The University of Texas Health Science Center at Houston |