
|
|||||
|
 | |
| |
| |
| |
| |
| |
|
Gene: NIT2 |
Gene summary for NIT2 |
| Gene information | Species | Human | Gene symbol | NIT2 | Gene ID | 56954 |
| Gene name | nitrilase family member 2 | |
| Gene Alias | HEL-S-8a | |
| Cytomap | 3q12.2 | |
| Gene Type | protein-coding | GO ID | GO:0006082 | UniProtAcc | Q9NQR4 |
Top |
Malignant transformation analysis |
| Identification of the aberrant gene expression in precancerous and cancerous lesions by comparing the gene expression of stem-like cells in diseased tissues with normal stem cells |
| Entrez ID | Symbol | Replicates | Species | Organ | Tissue | Adj P-value | Log2FC | Malignancy |
| 56954 | NIT2 | SYSMH4 | Human | Oral cavity | OSCC | 3.15e-08 | 2.13e-01 | 0.1226 |
| 56954 | NIT2 | SYSMH5 | Human | Oral cavity | OSCC | 9.64e-04 | 2.28e-01 | 0.0647 |
| 56954 | NIT2 | SYSMH6 | Human | Oral cavity | OSCC | 7.26e-11 | 7.48e-01 | 0.1275 |
| 56954 | NIT2 | P4_S8_cSCC | Human | Skin | cSCC | 2.95e-03 | 3.25e-02 | -0.3095 |
| 56954 | NIT2 | P5_S10_cSCC | Human | Skin | cSCC | 8.33e-06 | -3.10e-03 | -0.299 |
| 56954 | NIT2 | P1_cSCC | Human | Skin | cSCC | 2.24e-33 | 1.09e+00 | 0.0292 |
| 56954 | NIT2 | P2_cSCC | Human | Skin | cSCC | 1.37e-17 | 5.57e-01 | -0.024 |
| 56954 | NIT2 | P4_cSCC | Human | Skin | cSCC | 9.07e-35 | 8.58e-01 | -0.00290000000000005 |
| 56954 | NIT2 | P10_cSCC | Human | Skin | cSCC | 1.06e-27 | 8.21e-01 | 0.1017 |
| 56954 | NIT2 | cSCC_p8 | Human | Skin | cSCC | 8.95e-04 | -4.02e-02 | -0.1971 |
| 56954 | NIT2 | male-WTA | Human | Thyroid | PTC | 2.16e-23 | 1.86e-02 | 0.1037 |
| 56954 | NIT2 | PTC01 | Human | Thyroid | PTC | 7.76e-09 | 2.01e-02 | 0.1899 |
| 56954 | NIT2 | PTC04 | Human | Thyroid | PTC | 5.23e-14 | 1.43e-01 | 0.1927 |
| 56954 | NIT2 | PTC05 | Human | Thyroid | PTC | 1.83e-12 | 3.98e-01 | 0.2065 |
| 56954 | NIT2 | PTC06 | Human | Thyroid | PTC | 6.36e-22 | 5.14e-01 | 0.2057 |
| 56954 | NIT2 | PTC07 | Human | Thyroid | PTC | 8.29e-33 | 4.31e-01 | 0.2044 |
| 56954 | NIT2 | ATC12 | Human | Thyroid | ATC | 8.23e-09 | 1.50e-02 | 0.34 |
| 56954 | NIT2 | ATC13 | Human | Thyroid | ATC | 2.81e-23 | 4.28e-01 | 0.34 |
| 56954 | NIT2 | ATC2 | Human | Thyroid | ATC | 6.21e-09 | 9.47e-01 | 0.34 |
| 56954 | NIT2 | ATC4 | Human | Thyroid | ATC | 6.53e-11 | 9.89e-02 | 0.34 |
| Page: 1 2 3 4 5 6 7 |
| Tissue | Expression Dynamics | Abbreviation |
| Esophagus |  | ESCC: Esophageal squamous cell carcinoma |
| HGIN: High-grade intraepithelial neoplasias | ||
| LGIN: Low-grade intraepithelial neoplasias | ||
| Liver |  | HCC: Hepatocellular carcinoma |
| NAFLD: Non-alcoholic fatty liver disease | ||
| Oral Cavity | 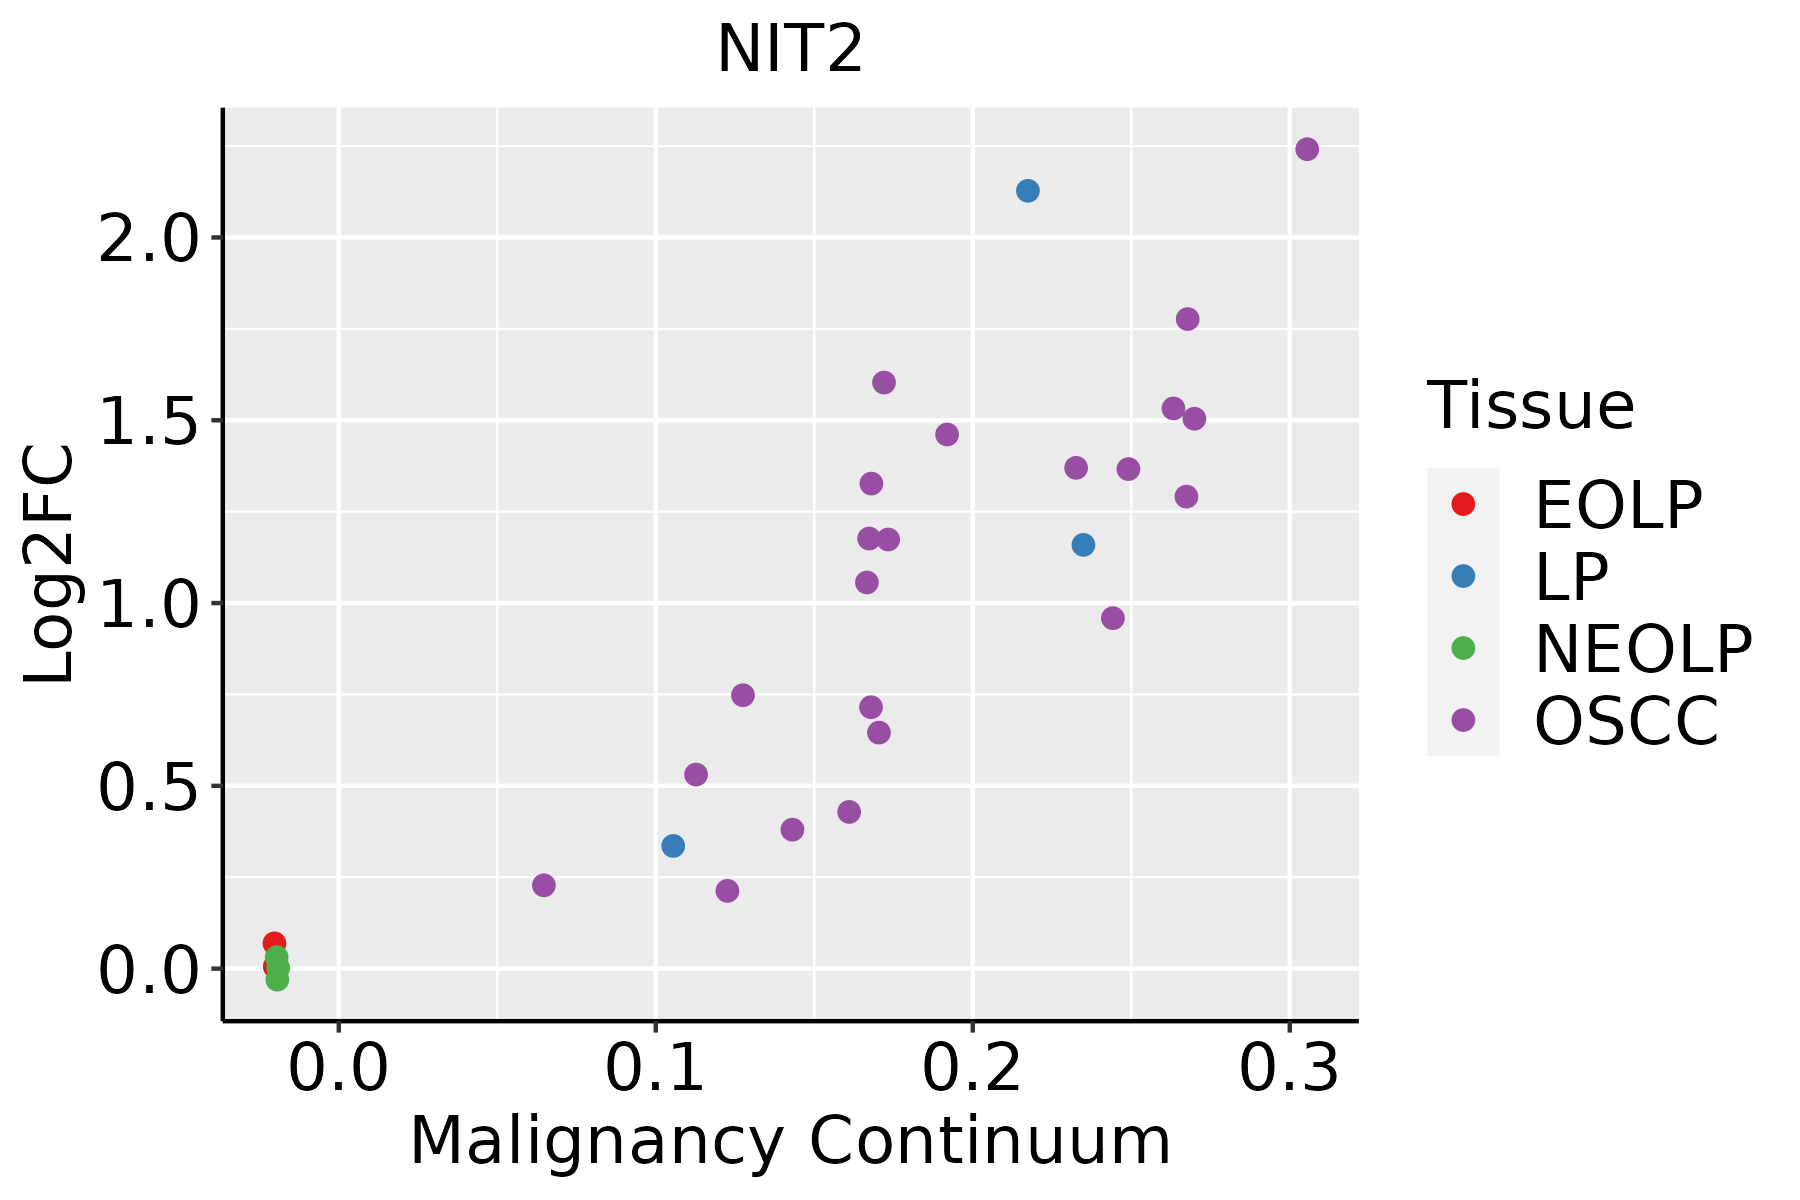 | EOLP: Erosive Oral lichen planus |
| LP: leukoplakia | ||
| NEOLP: Non-erosive oral lichen planus | ||
| OSCC: Oral squamous cell carcinoma | ||
| Skin | 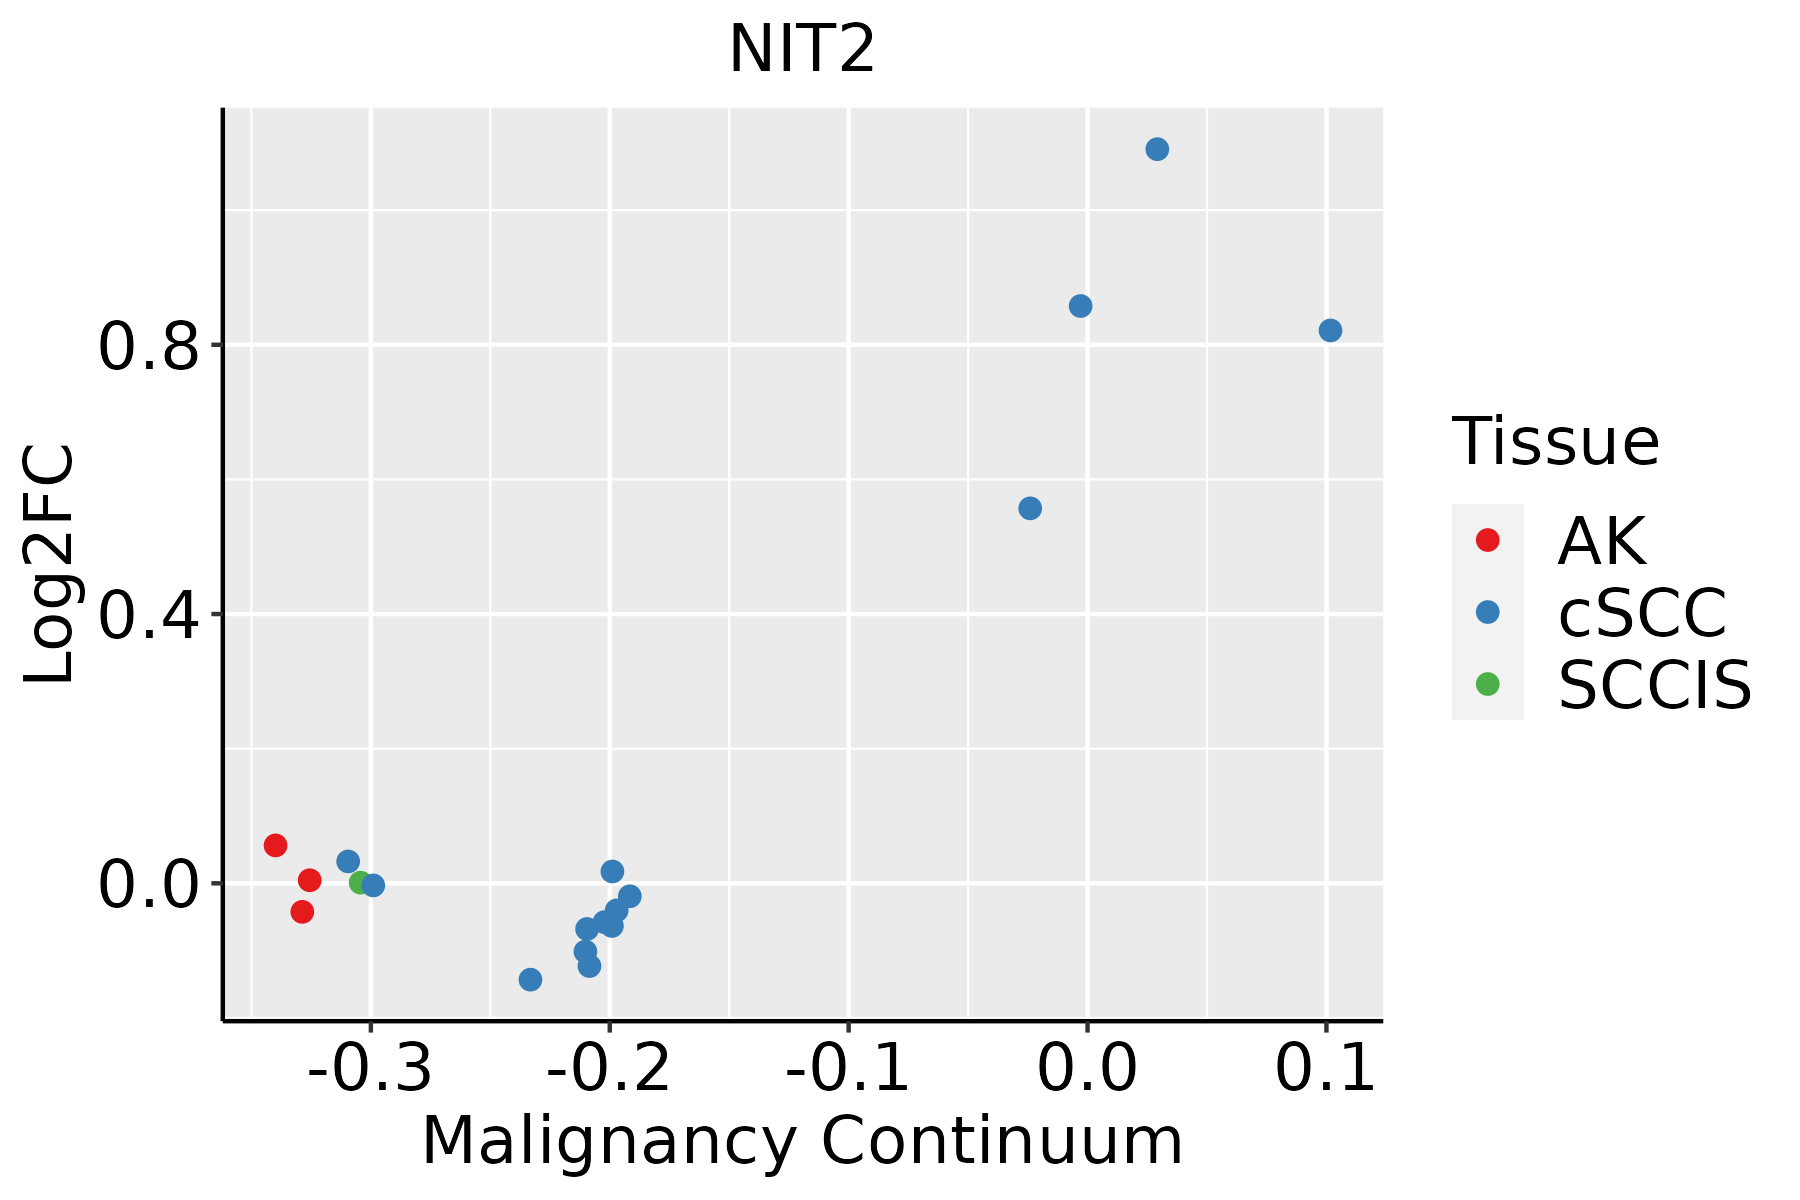 | AK: Actinic keratosis |
| cSCC: Cutaneous squamous cell carcinoma | ||
| SCCIS:squamous cell carcinoma in situ | ||
| Thyroid |  | ATC: Anaplastic thyroid cancer |
| HT: Hashimoto's thyroiditis | ||
| PTC: Papillary thyroid cancer |
| ∗log2FC in expression of this searched gene in stem-like cells from each diseased tissue sample relative to stem-like cells in normal samples in each tissue plotted against the malignancy continuum. Samples are colored based on if they are from different disease stage. |
Top |
Malignant transformation related pathway analysis |
| Find out the enriched GO biological processes and KEGG pathways involved in transition from healthy to precancer to cancer |
| Tissue | Disease Stage | Enriched GO biological Processes |
| Colorectum | AD |  |
| Colorectum | SER |  |
| Colorectum | MSS |  |
| Colorectum | MSI-H |  |
| Colorectum | FAP |  |
| ∗Top 15 enriched GO BP terms are showed in the bar plot of each disease state in each tissue. Each row represents a significant GO biological process which is colored according to the -log10(p.adjust). |
| Page: 1 2 3 4 5 6 7 8 9 |
| GO ID | Tissue | Disease Stage | Description | Gene Ratio | Bg Ratio | pvalue | p.adjust | Count |
| GO:00436485 | Esophagus | ESCC | dicarboxylic acid metabolic process | 58/8552 | 96/18723 | 2.55e-03 | 1.09e-02 | 58 |
| GO:19016051 | Liver | Cirrhotic | alpha-amino acid metabolic process | 82/4634 | 195/18723 | 7.72e-08 | 2.30e-06 | 82 |
| GO:000652011 | Liver | Cirrhotic | cellular amino acid metabolic process | 103/4634 | 284/18723 | 8.88e-06 | 1.30e-04 | 103 |
| GO:004364811 | Liver | Cirrhotic | dicarboxylic acid metabolic process | 43/4634 | 96/18723 | 1.42e-05 | 1.97e-04 | 43 |
| GO:00090661 | Liver | Cirrhotic | aspartate family amino acid metabolic process | 21/4634 | 49/18723 | 4.13e-03 | 2.21e-02 | 21 |
| GO:19016052 | Liver | HCC | alpha-amino acid metabolic process | 124/7958 | 195/18723 | 2.07e-09 | 5.79e-08 | 124 |
| GO:00436482 | Liver | HCC | dicarboxylic acid metabolic process | 68/7958 | 96/18723 | 1.73e-08 | 4.14e-07 | 68 |
| GO:00065202 | Liver | HCC | cellular amino acid metabolic process | 167/7958 | 284/18723 | 1.91e-08 | 4.56e-07 | 167 |
| GO:00090662 | Liver | HCC | aspartate family amino acid metabolic process | 34/7958 | 49/18723 | 1.28e-04 | 1.06e-03 | 34 |
| GO:0009064 | Liver | HCC | glutamine family amino acid metabolic process | 47/7958 | 78/18723 | 1.17e-03 | 6.54e-03 | 47 |
| GO:00436484 | Oral cavity | OSCC | dicarboxylic acid metabolic process | 50/7305 | 96/18723 | 6.24e-03 | 2.35e-02 | 50 |
| GO:00436486 | Skin | cSCC | dicarboxylic acid metabolic process | 38/4864 | 96/18723 | 2.38e-03 | 1.38e-02 | 38 |
| Page: 1 |
| Pathway ID | Tissue | Disease Stage | Description | Gene Ratio | Bg Ratio | pvalue | p.adjust | qvalue | Count |
| Page: 1 |
Top |
Cell-cell communication analysis |
| Identification of potential cell-cell interactions between two cell types and their ligand-receptor pairs for different disease states |
| Ligand | Receptor | LRpair | Pathway | Tissue | Disease Stage |
| Page: 1 |
Top |
Single-cell gene regulatory network inference analysis |
| Find out the significant the regulons (TFs) and the target genes of each regulon across cell types for different disease states |
| TF | Cell Type | Tissue | Disease Stage | Target Gene | RSS | Regulon Activity |
| ∗The dot plots of a searched regulon are shown for all cell subpopulations in each disease state of each tissue based on the regulon specific score inferred using pySCENIC and by calculating the average expression. |
| Page: 1 |
Top |
Somatic mutation of malignant transformation related genes |
| Annotation of somatic variants for genes involved in malignant transformation |
| Hugo Symbol | Variant Class | Variant Classification | dbSNP RS | HGVSc | HGVSp | HGVSp Short | SWISSPROT | BIOTYPE | SIFT | PolyPhen | Tumor Sample Barcode | Tissue | Histology | Sex | Age | Stage | Therapy Types | Drugs | Outcome |
| NIT2 | SNV | Missense_Mutation | c.58N>G | p.Asn20Asp | p.N20D | Q9NQR4 | protein_coding | deleterious(0) | probably_damaging(1) | TCGA-BH-A18G-01 | Breast | breast invasive carcinoma | Female | >=65 | I/II | Unknown | Unknown | SD | |
| NIT2 | SNV | Missense_Mutation | c.107N>T | p.Ala36Val | p.A36V | Q9NQR4 | protein_coding | deleterious(0.01) | possibly_damaging(0.642) | TCGA-D8-A1J8-01 | Breast | breast invasive carcinoma | Female | >=65 | I/II | Hormone Therapy | nolvadex | SD | |
| NIT2 | SNV | Missense_Mutation | novel | c.166N>C | p.Glu56Gln | p.E56Q | Q9NQR4 | protein_coding | tolerated(0.31) | benign(0.024) | TCGA-VS-A8EL-01 | Cervix | cervical & endocervical cancer | Female | <65 | I/II | Chemotherapy | cisplatin | CR |
| NIT2 | SNV | Missense_Mutation | rs373969032 | c.764N>A | p.Arg255His | p.R255H | Q9NQR4 | protein_coding | deleterious(0) | probably_damaging(0.988) | TCGA-AA-3679-01 | Colorectum | colon adenocarcinoma | Male | <65 | III/IV | Chemotherapy | folinic | SD |
| NIT2 | SNV | Missense_Mutation | novel | c.119N>A | p.Ser40Tyr | p.S40Y | Q9NQR4 | protein_coding | deleterious(0) | possibly_damaging(0.686) | TCGA-CA-6717-01 | Colorectum | colon adenocarcinoma | Male | <65 | I/II | Chemotherapy | oxaliplatin | CR |
| NIT2 | SNV | Missense_Mutation | c.382G>A | p.Glu128Lys | p.E128K | Q9NQR4 | protein_coding | deleterious(0) | probably_damaging(0.998) | TCGA-AG-3892-01 | Colorectum | rectum adenocarcinoma | Female | <65 | I/II | Unknown | Unknown | SD | |
| NIT2 | SNV | Missense_Mutation | novel | c.19N>A | p.Ala7Thr | p.A7T | Q9NQR4 | protein_coding | deleterious(0.03) | probably_damaging(0.956) | TCGA-A5-A0G1-01 | Endometrium | uterine corpus endometrioid carcinoma | Female | >=65 | I/II | Unknown | Unknown | SD |
| NIT2 | SNV | Missense_Mutation | rs201591317 | c.578N>A | p.Arg193Gln | p.R193Q | Q9NQR4 | protein_coding | tolerated(0.1) | probably_damaging(0.971) | TCGA-A5-A2K5-01 | Endometrium | uterine corpus endometrioid carcinoma | Female | >=65 | I/II | Unknown | Unknown | SD |
| NIT2 | SNV | Missense_Mutation | novel | c.749N>C | p.Lys250Thr | p.K250T | Q9NQR4 | protein_coding | tolerated(0.68) | benign(0.006) | TCGA-AJ-A3EL-01 | Endometrium | uterine corpus endometrioid carcinoma | Female | <65 | I/II | Unknown | Unknown | SD |
| NIT2 | SNV | Missense_Mutation | novel | c.290N>A | p.Cys97Tyr | p.C97Y | Q9NQR4 | protein_coding | deleterious(0) | probably_damaging(0.999) | TCGA-AP-A059-01 | Endometrium | uterine corpus endometrioid carcinoma | Female | >=65 | I/II | Unknown | Unknown | SD |
| Page: 1 2 3 4 |
Top |
Related drugs of malignant transformation related genes |
| Identification of chemicals and drugs interact with genes involved in malignant transfromation |
| (DGIdb 4.0) |
| Entrez ID | Symbol | Category | Interaction Types | Drug Claim Name | Drug Name | PMIDs |
| Page: 1 |

Copyright 2023-Present -The University of Texas Health Science Center at Houston |