
|
|||||
|
 | |
| |
| |
| |
| |
| |
|
Gene: NIPSNAP1 |
Gene summary for NIPSNAP1 |
| Gene information | Species | Human | Gene symbol | NIPSNAP1 | Gene ID | 8508 |
| Gene name | nipsnap homolog 1 | |
| Gene Alias | NIPSNAP1 | |
| Cytomap | 22q12.2 | |
| Gene Type | protein-coding | GO ID | GO:0003008 | UniProtAcc | B4DQI7 |
Top |
Malignant transformation analysis |
| Identification of the aberrant gene expression in precancerous and cancerous lesions by comparing the gene expression of stem-like cells in diseased tissues with normal stem cells |
| Entrez ID | Symbol | Replicates | Species | Organ | Tissue | Adj P-value | Log2FC | Malignancy |
| 8508 | NIPSNAP1 | C51 | Human | Oral cavity | OSCC | 1.64e-14 | 6.71e-01 | 0.2674 |
| 8508 | NIPSNAP1 | C57 | Human | Oral cavity | OSCC | 1.51e-12 | 5.34e-01 | 0.1679 |
| 8508 | NIPSNAP1 | C06 | Human | Oral cavity | OSCC | 1.44e-09 | 1.10e+00 | 0.2699 |
| 8508 | NIPSNAP1 | C07 | Human | Oral cavity | OSCC | 1.08e-04 | 7.87e-01 | 0.2491 |
| 8508 | NIPSNAP1 | C08 | Human | Oral cavity | OSCC | 2.83e-52 | 9.57e-01 | 0.1919 |
| 8508 | NIPSNAP1 | LN22 | Human | Oral cavity | OSCC | 6.95e-18 | 1.36e+00 | 0.1733 |
| 8508 | NIPSNAP1 | LN46 | Human | Oral cavity | OSCC | 1.22e-13 | 4.78e-01 | 0.1666 |
| 8508 | NIPSNAP1 | LP15 | Human | Oral cavity | LP | 2.82e-07 | 9.00e-01 | 0.2174 |
| 8508 | NIPSNAP1 | LP17 | Human | Oral cavity | LP | 6.76e-05 | 7.07e-01 | 0.2349 |
| 8508 | NIPSNAP1 | SYSMH1 | Human | Oral cavity | OSCC | 2.20e-04 | 1.47e-01 | 0.1127 |
| 8508 | NIPSNAP1 | SYSMH2 | Human | Oral cavity | OSCC | 7.63e-10 | 2.80e-01 | 0.2326 |
| 8508 | NIPSNAP1 | SYSMH3 | Human | Oral cavity | OSCC | 2.87e-17 | 4.43e-01 | 0.2442 |
| 8508 | NIPSNAP1 | SYSMH4 | Human | Oral cavity | OSCC | 3.87e-03 | 1.36e-01 | 0.1226 |
| 8508 | NIPSNAP1 | SYSMH6 | Human | Oral cavity | OSCC | 1.38e-07 | 2.35e-01 | 0.1275 |
| 8508 | NIPSNAP1 | P1_cSCC | Human | Skin | cSCC | 6.56e-14 | 4.40e-01 | 0.0292 |
| 8508 | NIPSNAP1 | P2_cSCC | Human | Skin | cSCC | 1.27e-10 | 3.21e-01 | -0.024 |
| 8508 | NIPSNAP1 | P4_cSCC | Human | Skin | cSCC | 3.78e-03 | 1.91e-01 | -0.00290000000000005 |
| 8508 | NIPSNAP1 | P10_cSCC | Human | Skin | cSCC | 2.31e-07 | 2.72e-01 | 0.1017 |
| Page: 1 2 3 4 5 6 |
| Tissue | Expression Dynamics | Abbreviation |
| Colorectum (GSE201348) |  | FAP: Familial adenomatous polyposis |
| CRC: Colorectal cancer | ||
| Colorectum (HTA11) |  | AD: Adenomas |
| SER: Sessile serrated lesions | ||
| MSI-H: Microsatellite-high colorectal cancer | ||
| MSS: Microsatellite stable colorectal cancer | ||
| Esophagus | 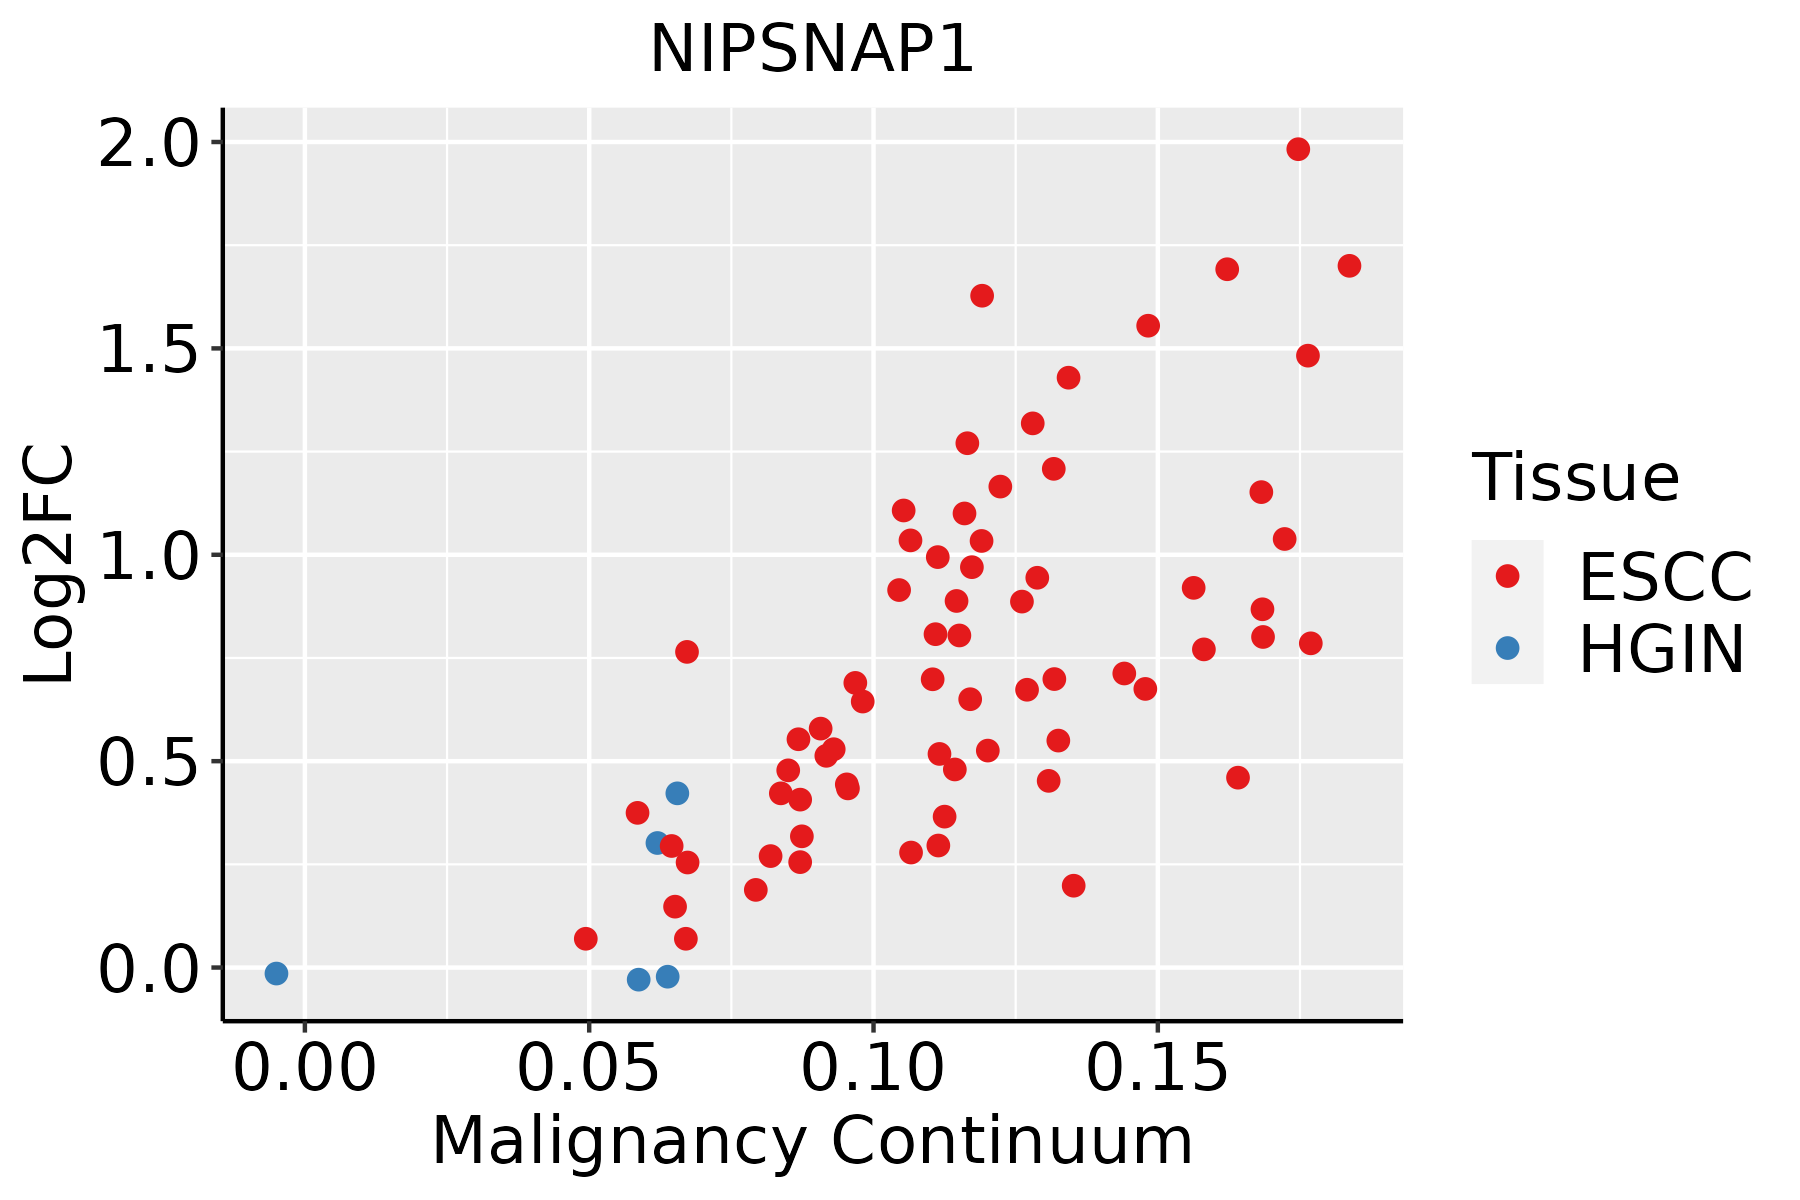 | ESCC: Esophageal squamous cell carcinoma |
| HGIN: High-grade intraepithelial neoplasias | ||
| LGIN: Low-grade intraepithelial neoplasias | ||
| Liver | 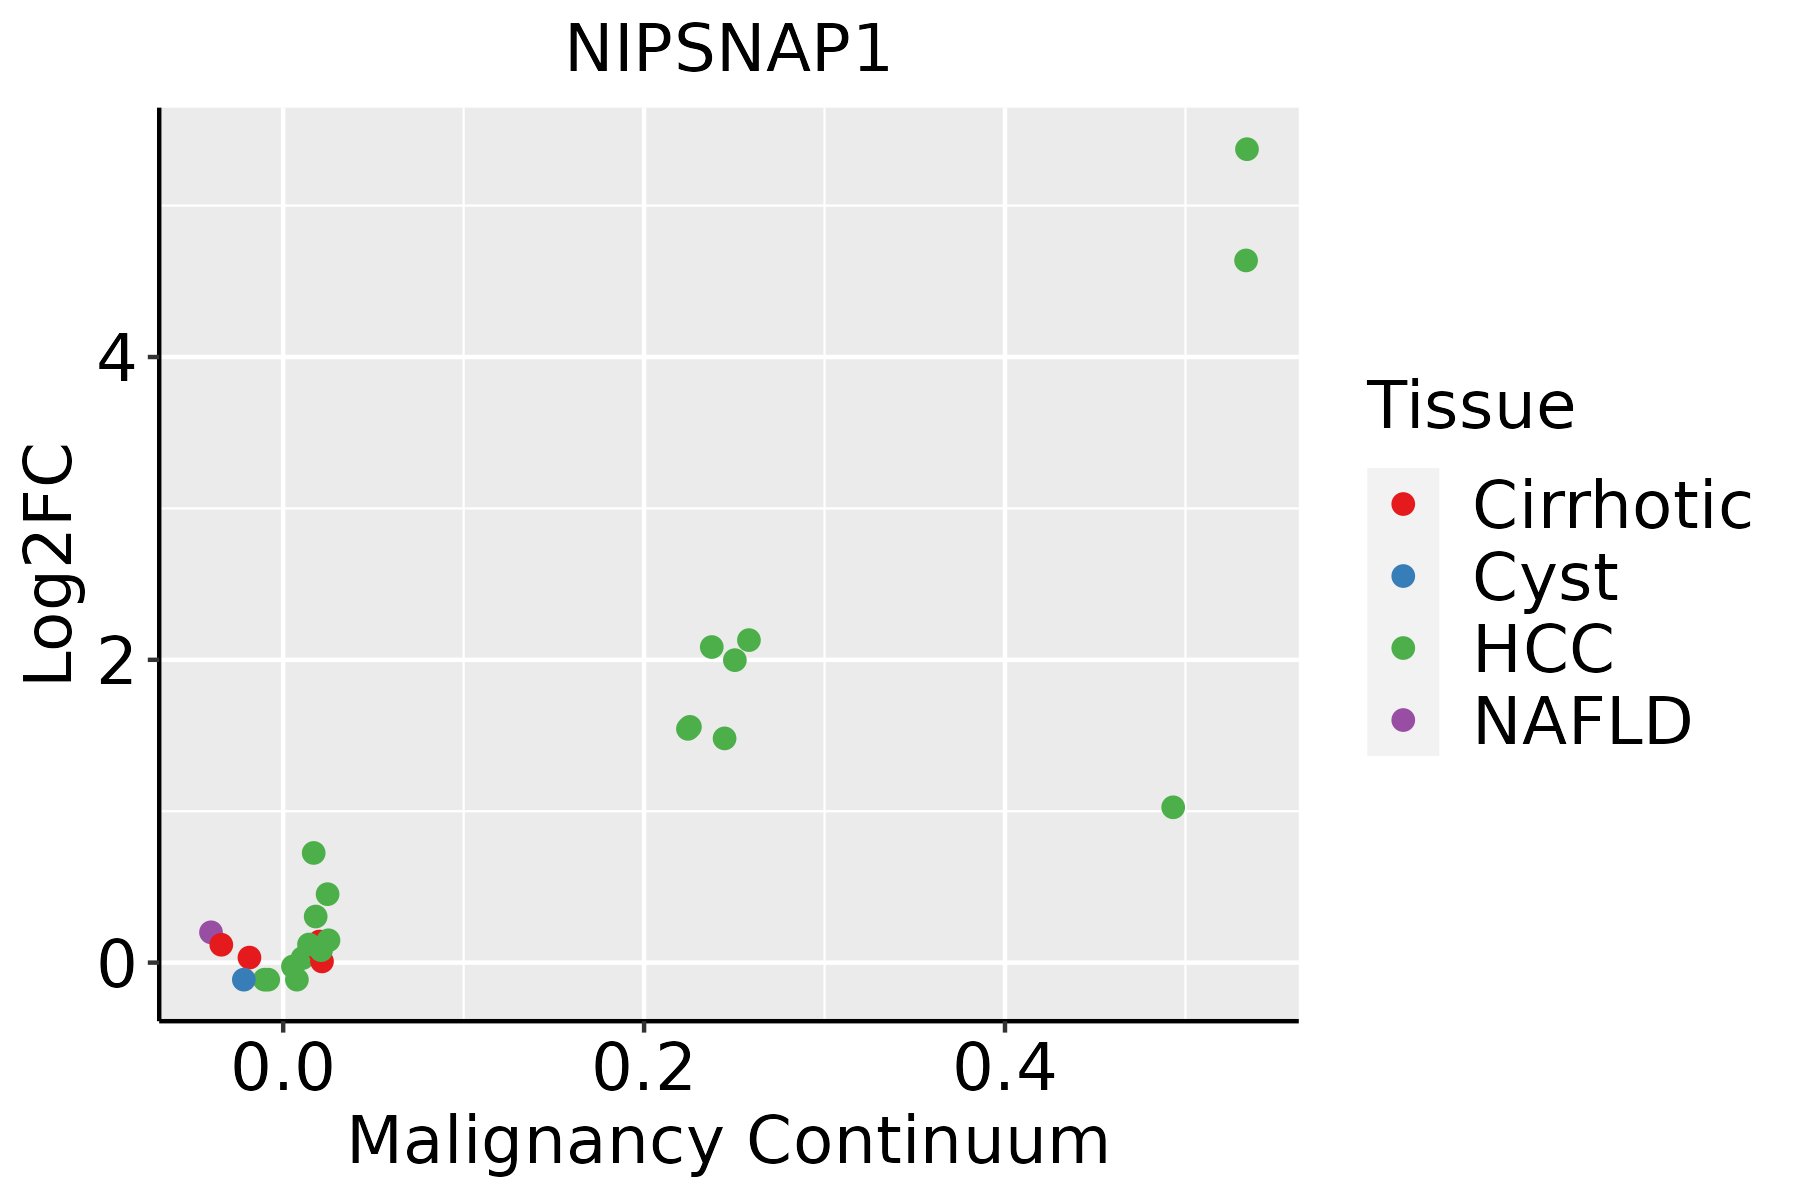 | HCC: Hepatocellular carcinoma |
| NAFLD: Non-alcoholic fatty liver disease | ||
| Oral Cavity | 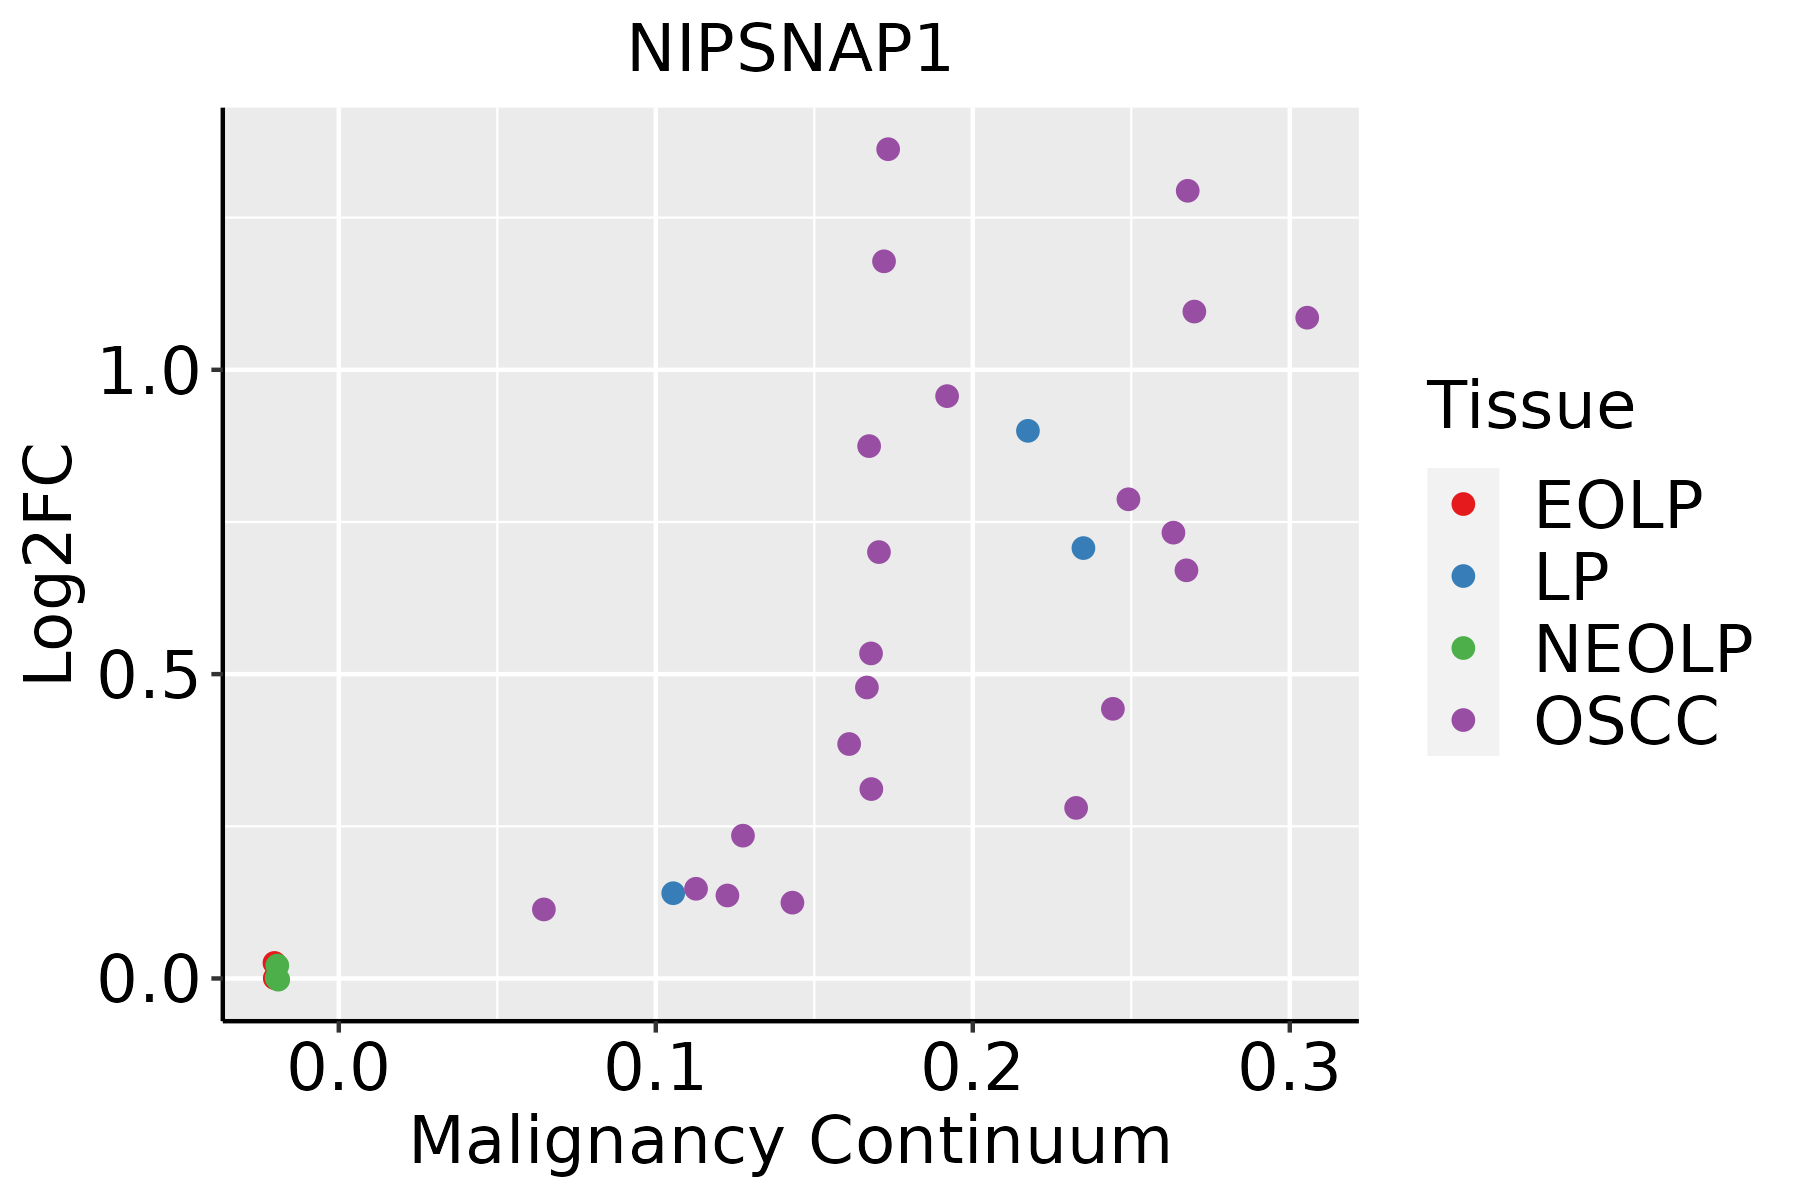 | EOLP: Erosive Oral lichen planus |
| LP: leukoplakia | ||
| NEOLP: Non-erosive oral lichen planus | ||
| OSCC: Oral squamous cell carcinoma | ||
| Skin |  | AK: Actinic keratosis |
| cSCC: Cutaneous squamous cell carcinoma | ||
| SCCIS:squamous cell carcinoma in situ |
| ∗log2FC in expression of this searched gene in stem-like cells from each diseased tissue sample relative to stem-like cells in normal samples in each tissue plotted against the malignancy continuum. Samples are colored based on if they are from different disease stage. |
Top |
Malignant transformation related pathway analysis |
| Find out the enriched GO biological processes and KEGG pathways involved in transition from healthy to precancer to cancer |
| Tissue | Disease Stage | Enriched GO biological Processes |
| Colorectum | AD |  |
| Colorectum | SER |  |
| Colorectum | MSS |  |
| Colorectum | MSI-H |  |
| Colorectum | FAP |  |
| ∗Top 15 enriched GO BP terms are showed in the bar plot of each disease state in each tissue. Each row represents a significant GO biological process which is colored according to the -log10(p.adjust). |
| Page: 1 2 3 4 5 6 7 8 9 |
| GO ID | Tissue | Disease Stage | Description | Gene Ratio | Bg Ratio | pvalue | p.adjust | Count |
| Page: 1 |
| Pathway ID | Tissue | Disease Stage | Description | Gene Ratio | Bg Ratio | pvalue | p.adjust | qvalue | Count |
| Page: 1 |
Top |
Cell-cell communication analysis |
| Identification of potential cell-cell interactions between two cell types and their ligand-receptor pairs for different disease states |
| Ligand | Receptor | LRpair | Pathway | Tissue | Disease Stage |
| Page: 1 |
Top |
Single-cell gene regulatory network inference analysis |
| Find out the significant the regulons (TFs) and the target genes of each regulon across cell types for different disease states |
| TF | Cell Type | Tissue | Disease Stage | Target Gene | RSS | Regulon Activity |
| ∗The dot plots of a searched regulon are shown for all cell subpopulations in each disease state of each tissue based on the regulon specific score inferred using pySCENIC and by calculating the average expression. |
| Page: 1 |
Top |
Somatic mutation of malignant transformation related genes |
| Annotation of somatic variants for genes involved in malignant transformation |
| Hugo Symbol | Variant Class | Variant Classification | dbSNP RS | HGVSc | HGVSp | HGVSp Short | SWISSPROT | BIOTYPE | SIFT | PolyPhen | Tumor Sample Barcode | Tissue | Histology | Sex | Age | Stage | Therapy Types | Drugs | Outcome |
| NIPSNAP1 | SNV | Missense_Mutation | c.634N>G | p.Gln212Glu | p.Q212E | Q9BPW8 | protein_coding | deleterious(0) | benign(0.349) | TCGA-EK-A2PG-01 | Cervix | cervical & endocervical cancer | Female | >=65 | I/II | Unknown | Unknown | SD | |
| NIPSNAP1 | SNV | Missense_Mutation | c.475N>A | p.Leu159Met | p.L159M | Q9BPW8 | protein_coding | deleterious(0) | probably_damaging(0.982) | TCGA-AA-3713-01 | Colorectum | colon adenocarcinoma | Male | >=65 | III/IV | Chemotherapy | 5-fluorouracil | PR | |
| NIPSNAP1 | SNV | Missense_Mutation | c.740N>A | p.Arg247Gln | p.R247Q | Q9BPW8 | protein_coding | deleterious(0.03) | possibly_damaging(0.629) | TCGA-AA-A00N-01 | Colorectum | colon adenocarcinoma | Male | >=65 | I/II | Unknown | Unknown | PD | |
| NIPSNAP1 | SNV | Missense_Mutation | novel | c.745N>A | p.Ala249Thr | p.A249T | Q9BPW8 | protein_coding | tolerated(0.05) | benign(0.055) | TCGA-AP-A1DK-01 | Endometrium | uterine corpus endometrioid carcinoma | Female | <65 | I/II | Unknown | Unknown | SD |
| NIPSNAP1 | SNV | Missense_Mutation | novel | c.656N>A | p.Gly219Asp | p.G219D | Q9BPW8 | protein_coding | deleterious(0) | probably_damaging(0.988) | TCGA-AX-A1CE-01 | Endometrium | uterine corpus endometrioid carcinoma | Female | <65 | I/II | Unspecific | Paclitaxel | SD |
| NIPSNAP1 | SNV | Missense_Mutation | c.307N>A | p.Asp103Asn | p.D103N | Q9BPW8 | protein_coding | tolerated(0.27) | benign(0.065) | TCGA-B5-A0JY-01 | Endometrium | uterine corpus endometrioid carcinoma | Female | <65 | III/IV | Chemotherapy | doxorubicin | SD | |
| NIPSNAP1 | SNV | Missense_Mutation | novel | c.356N>G | p.Gln119Arg | p.Q119R | Q9BPW8 | protein_coding | deleterious(0) | probably_damaging(0.922) | TCGA-B5-A1MW-01 | Endometrium | uterine corpus endometrioid carcinoma | Female | <65 | I/II | Unknown | Unknown | PD |
| NIPSNAP1 | SNV | Missense_Mutation | c.525N>T | p.Glu175Asp | p.E175D | Q9BPW8 | protein_coding | tolerated(0.15) | benign(0.012) | TCGA-55-8092-01 | Lung | lung adenocarcinoma | Male | >=65 | I/II | Unknown | Unknown | PD | |
| NIPSNAP1 | SNV | Missense_Mutation | c.631N>T | p.Arg211Trp | p.R211W | Q9BPW8 | protein_coding | deleterious(0) | probably_damaging(1) | TCGA-39-5019-01 | Lung | lung squamous cell carcinoma | Male | >=65 | I/II | Unknown | Unknown | PD | |
| NIPSNAP1 | SNV | Missense_Mutation | c.458N>T | p.Arg153Met | p.R153M | Q9BPW8 | protein_coding | deleterious(0.01) | benign(0.375) | TCGA-66-2773-01 | Lung | lung squamous cell carcinoma | Male | >=65 | I/II | Unknown | Unknown | SD |
| Page: 1 2 |
Top |
Related drugs of malignant transformation related genes |
| Identification of chemicals and drugs interact with genes involved in malignant transfromation |
| (DGIdb 4.0) |
| Entrez ID | Symbol | Category | Interaction Types | Drug Claim Name | Drug Name | PMIDs |
| Page: 1 |

Copyright 2023-Present -The University of Texas Health Science Center at Houston |