
|
|||||
|
 | |
| |
| |
| |
| |
| |
|
Gene: NHP2 |
Gene summary for NHP2 |
| Gene information | Species | Human | Gene symbol | NHP2 | Gene ID | 55651 |
| Gene name | NHP2 ribonucleoprotein | |
| Gene Alias | DKCB2 | |
| Cytomap | 5q35.3 | |
| Gene Type | protein-coding | GO ID | GO:0000154 | UniProtAcc | J3QSY4 |
Top |
Malignant transformation analysis |
| Identification of the aberrant gene expression in precancerous and cancerous lesions by comparing the gene expression of stem-like cells in diseased tissues with normal stem cells |
| Entrez ID | Symbol | Replicates | Species | Organ | Tissue | Adj P-value | Log2FC | Malignancy |
| 55651 | NHP2 | P79T-E | Human | Esophagus | ESCC | 4.55e-27 | 8.89e-01 | 0.1154 |
| 55651 | NHP2 | P80T-E | Human | Esophagus | ESCC | 4.33e-52 | 2.68e+00 | 0.155 |
| 55651 | NHP2 | P82T-E | Human | Esophagus | ESCC | 1.78e-19 | 1.45e+00 | 0.1072 |
| 55651 | NHP2 | P83T-E | Human | Esophagus | ESCC | 8.96e-61 | 2.42e+00 | 0.1738 |
| 55651 | NHP2 | P84T-E | Human | Esophagus | ESCC | 4.54e-09 | 1.10e+00 | 0.0933 |
| 55651 | NHP2 | P89T-E | Human | Esophagus | ESCC | 5.38e-23 | 2.72e+00 | 0.1752 |
| 55651 | NHP2 | P91T-E | Human | Esophagus | ESCC | 2.00e-25 | 3.06e+00 | 0.1828 |
| 55651 | NHP2 | P107T-E | Human | Esophagus | ESCC | 2.08e-71 | 2.91e+00 | 0.171 |
| 55651 | NHP2 | P126T-E | Human | Esophagus | ESCC | 4.05e-12 | 1.90e+00 | 0.1125 |
| 55651 | NHP2 | P127T-E | Human | Esophagus | ESCC | 2.06e-21 | 2.81e-01 | 0.0826 |
| 55651 | NHP2 | P128T-E | Human | Esophagus | ESCC | 3.00e-43 | 1.68e+00 | 0.1241 |
| 55651 | NHP2 | P130T-E | Human | Esophagus | ESCC | 1.22e-93 | 2.55e+00 | 0.1676 |
| 55651 | NHP2 | S43 | Human | Liver | Cirrhotic | 1.91e-15 | -4.12e-01 | -0.0187 |
| 55651 | NHP2 | HCC1_Meng | Human | Liver | HCC | 2.64e-69 | 4.41e-01 | 0.0246 |
| 55651 | NHP2 | HCC2_Meng | Human | Liver | HCC | 2.47e-44 | 7.88e-03 | 0.0107 |
| 55651 | NHP2 | cirrhotic1 | Human | Liver | Cirrhotic | 6.10e-20 | 2.54e-01 | 0.0202 |
| 55651 | NHP2 | cirrhotic2 | Human | Liver | Cirrhotic | 2.59e-24 | 2.89e-01 | 0.0201 |
| 55651 | NHP2 | cirrhotic3 | Human | Liver | Cirrhotic | 4.63e-21 | 2.99e-01 | 0.0215 |
| 55651 | NHP2 | HCC1 | Human | Liver | HCC | 6.41e-13 | 5.18e+00 | 0.5336 |
| 55651 | NHP2 | HCC2 | Human | Liver | HCC | 1.08e-14 | 5.29e+00 | 0.5341 |
| Page: 1 2 3 4 5 6 7 8 9 10 11 |
| Tissue | Expression Dynamics | Abbreviation |
| Breast | 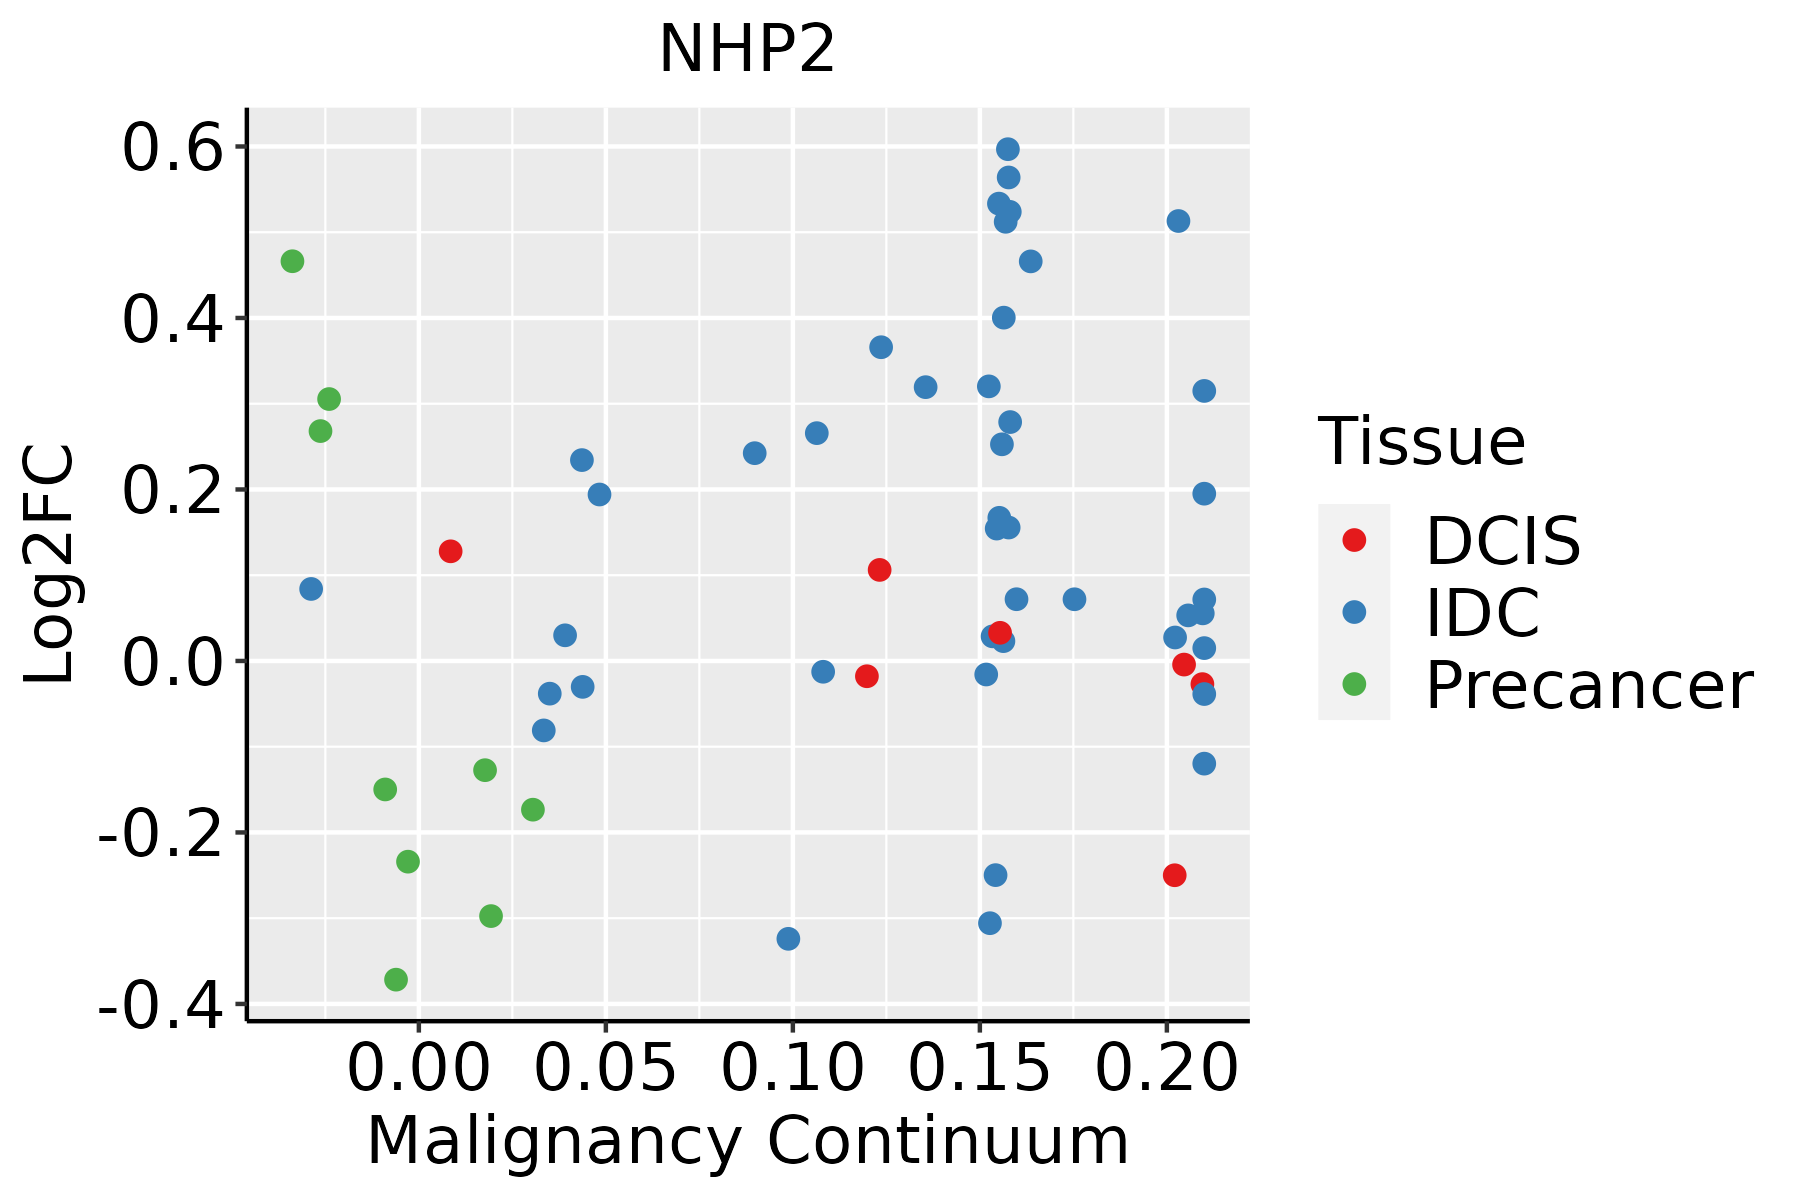 | IDC: Invasive ductal carcinoma |
| DCIS: Ductal carcinoma in situ | ||
| Precancer(BRCA1-mut): Precancerous lesion from BRCA1 mutation carriers | ||
| Endometrium | 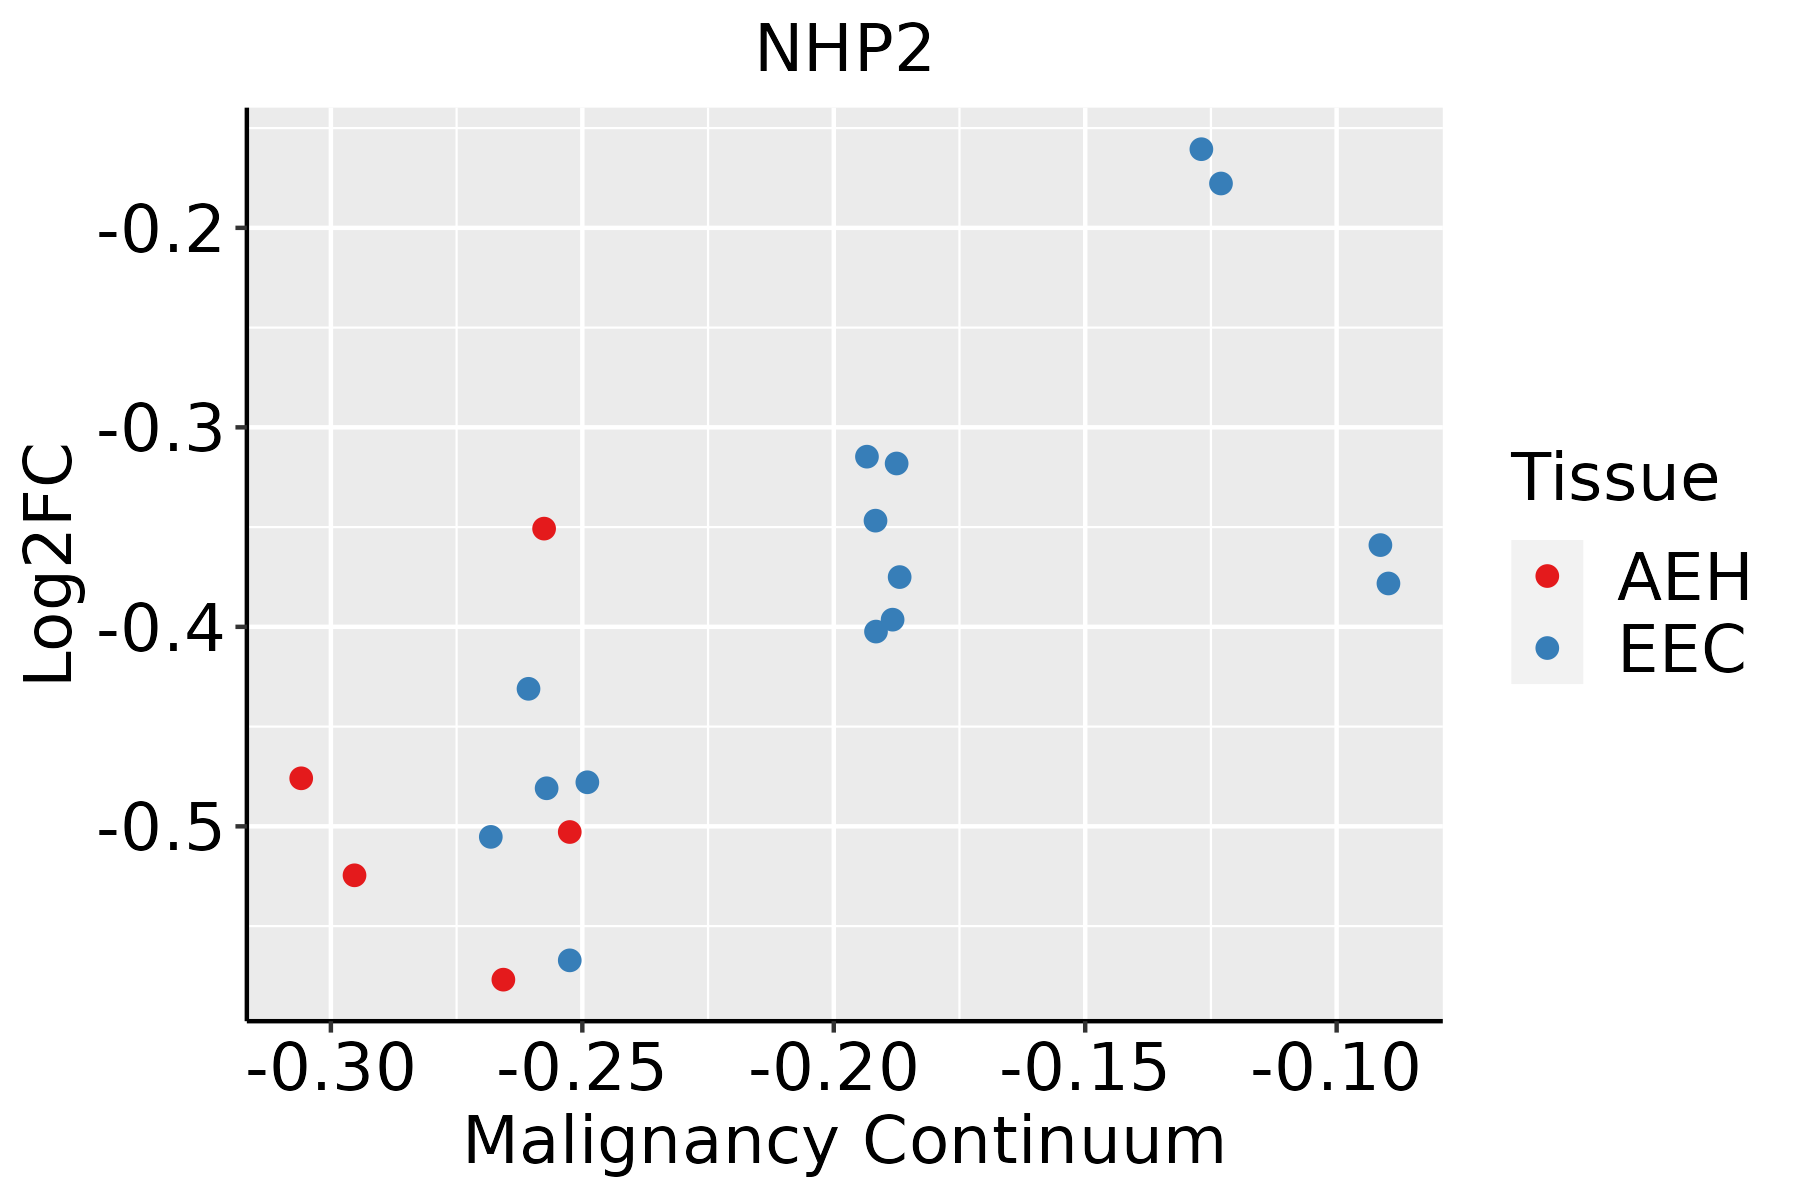 | AEH: Atypical endometrial hyperplasia |
| EEC: Endometrioid Cancer | ||
| Esophagus | 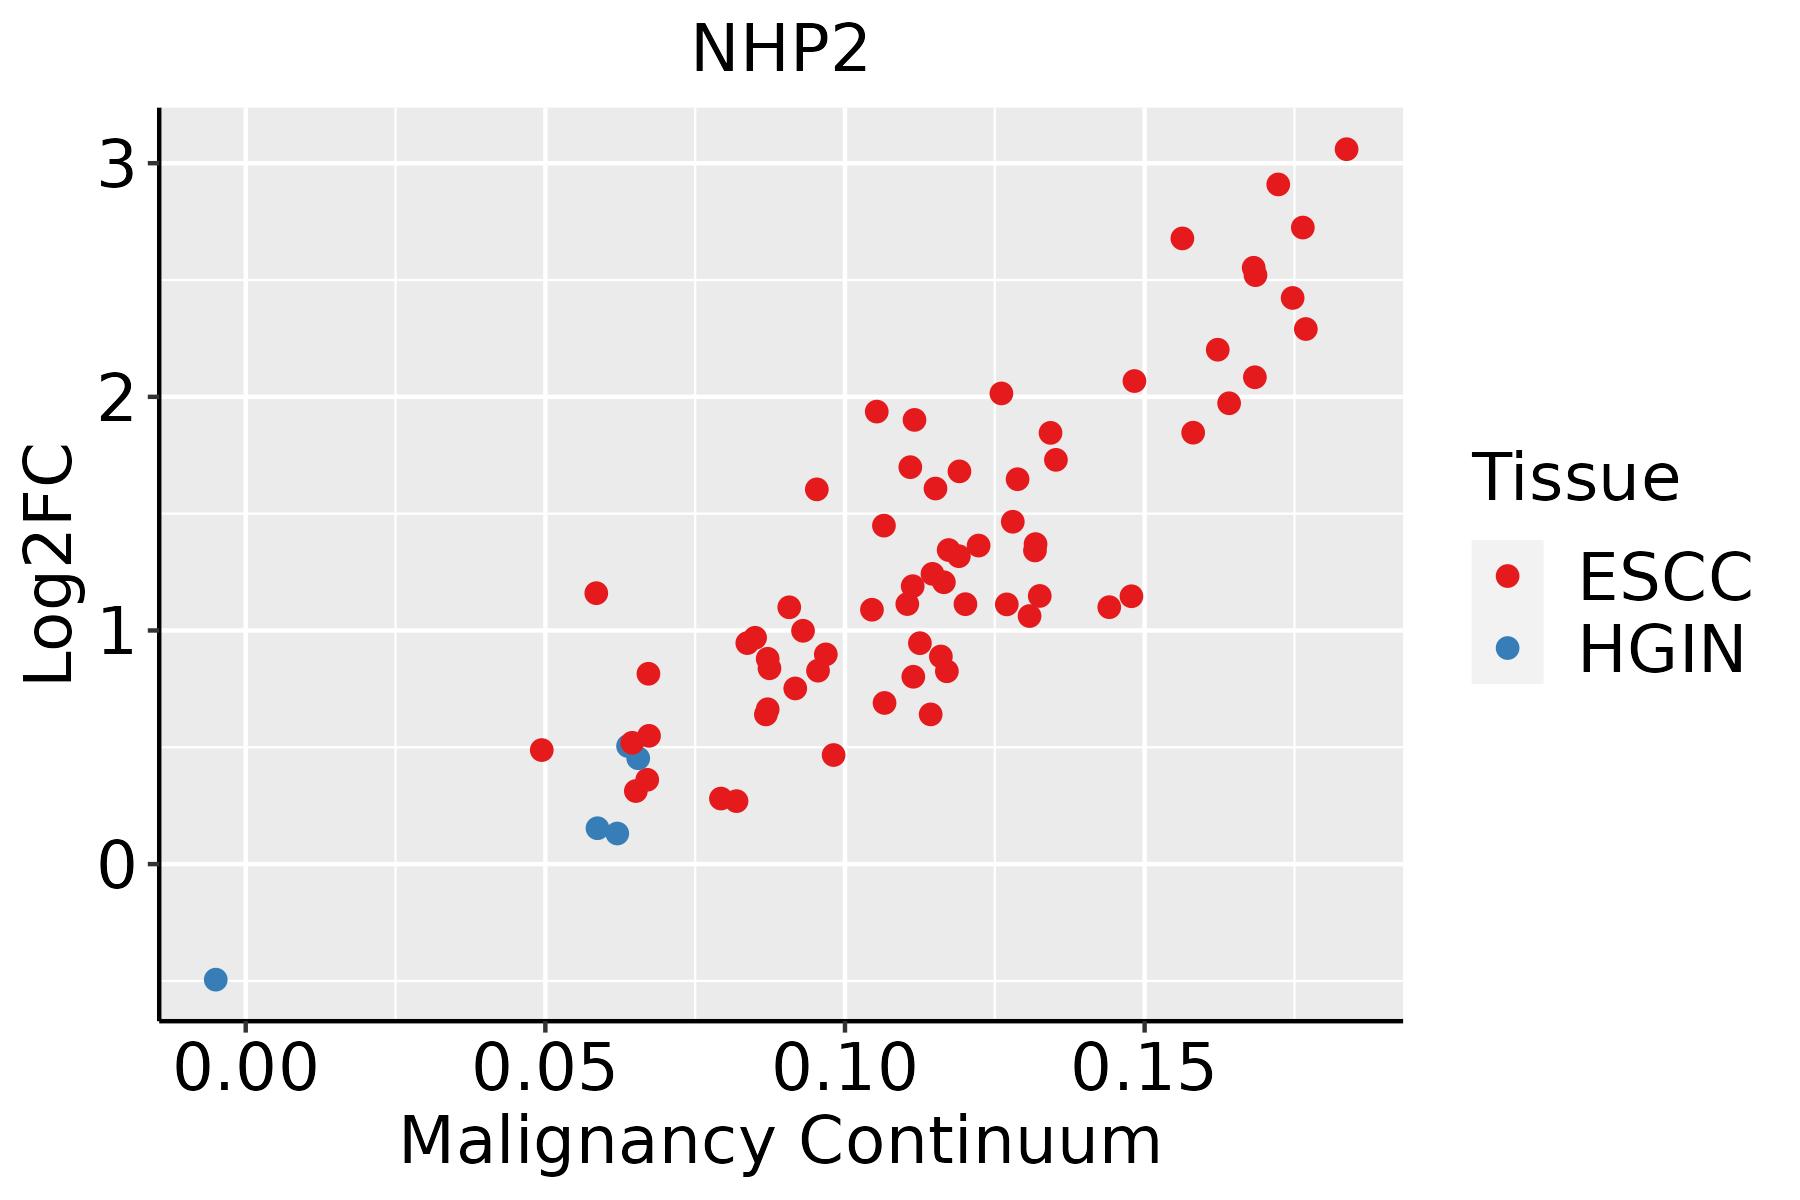 | ESCC: Esophageal squamous cell carcinoma |
| HGIN: High-grade intraepithelial neoplasias | ||
| LGIN: Low-grade intraepithelial neoplasias | ||
| Liver |  | HCC: Hepatocellular carcinoma |
| NAFLD: Non-alcoholic fatty liver disease | ||
| Oral Cavity | 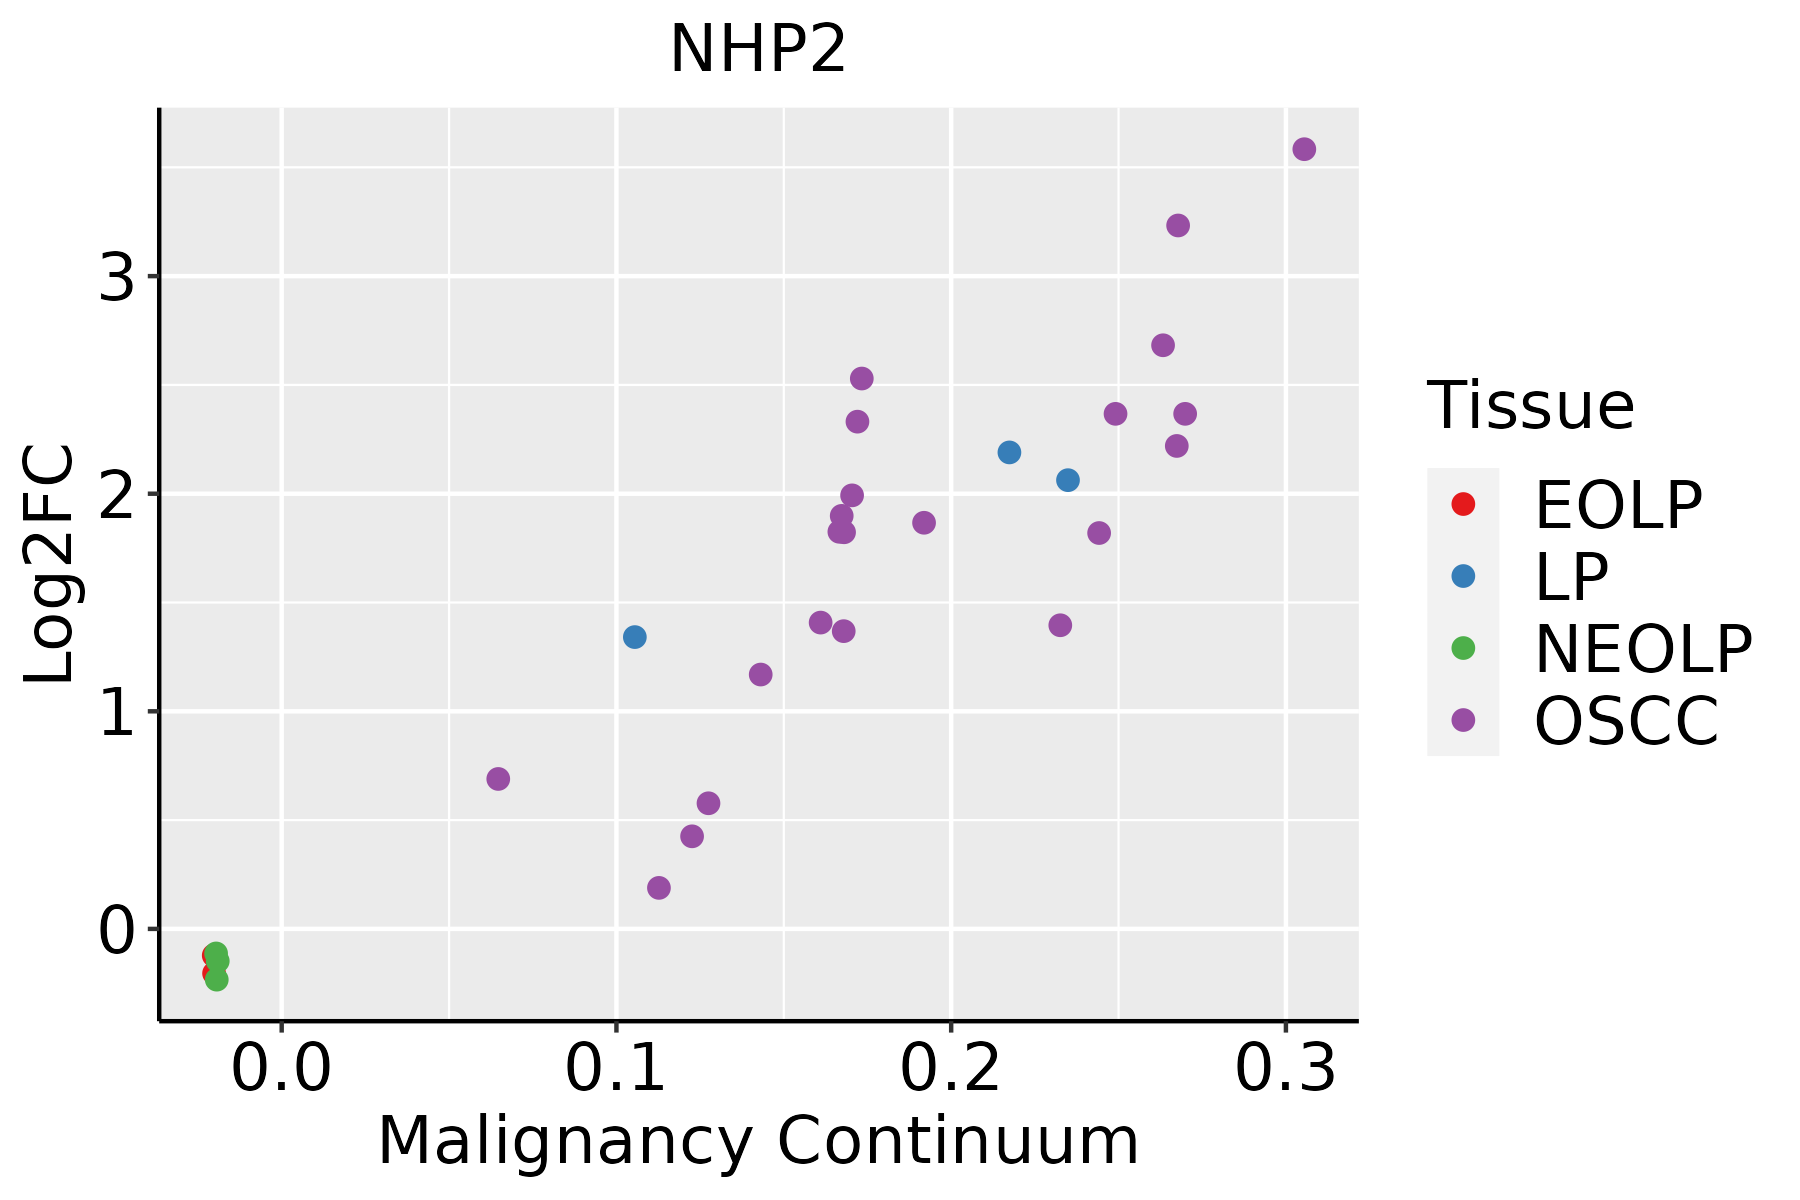 | EOLP: Erosive Oral lichen planus |
| LP: leukoplakia | ||
| NEOLP: Non-erosive oral lichen planus | ||
| OSCC: Oral squamous cell carcinoma | ||
| Prostate |  | BPH: Benign Prostatic Hyperplasia |
| Skin | 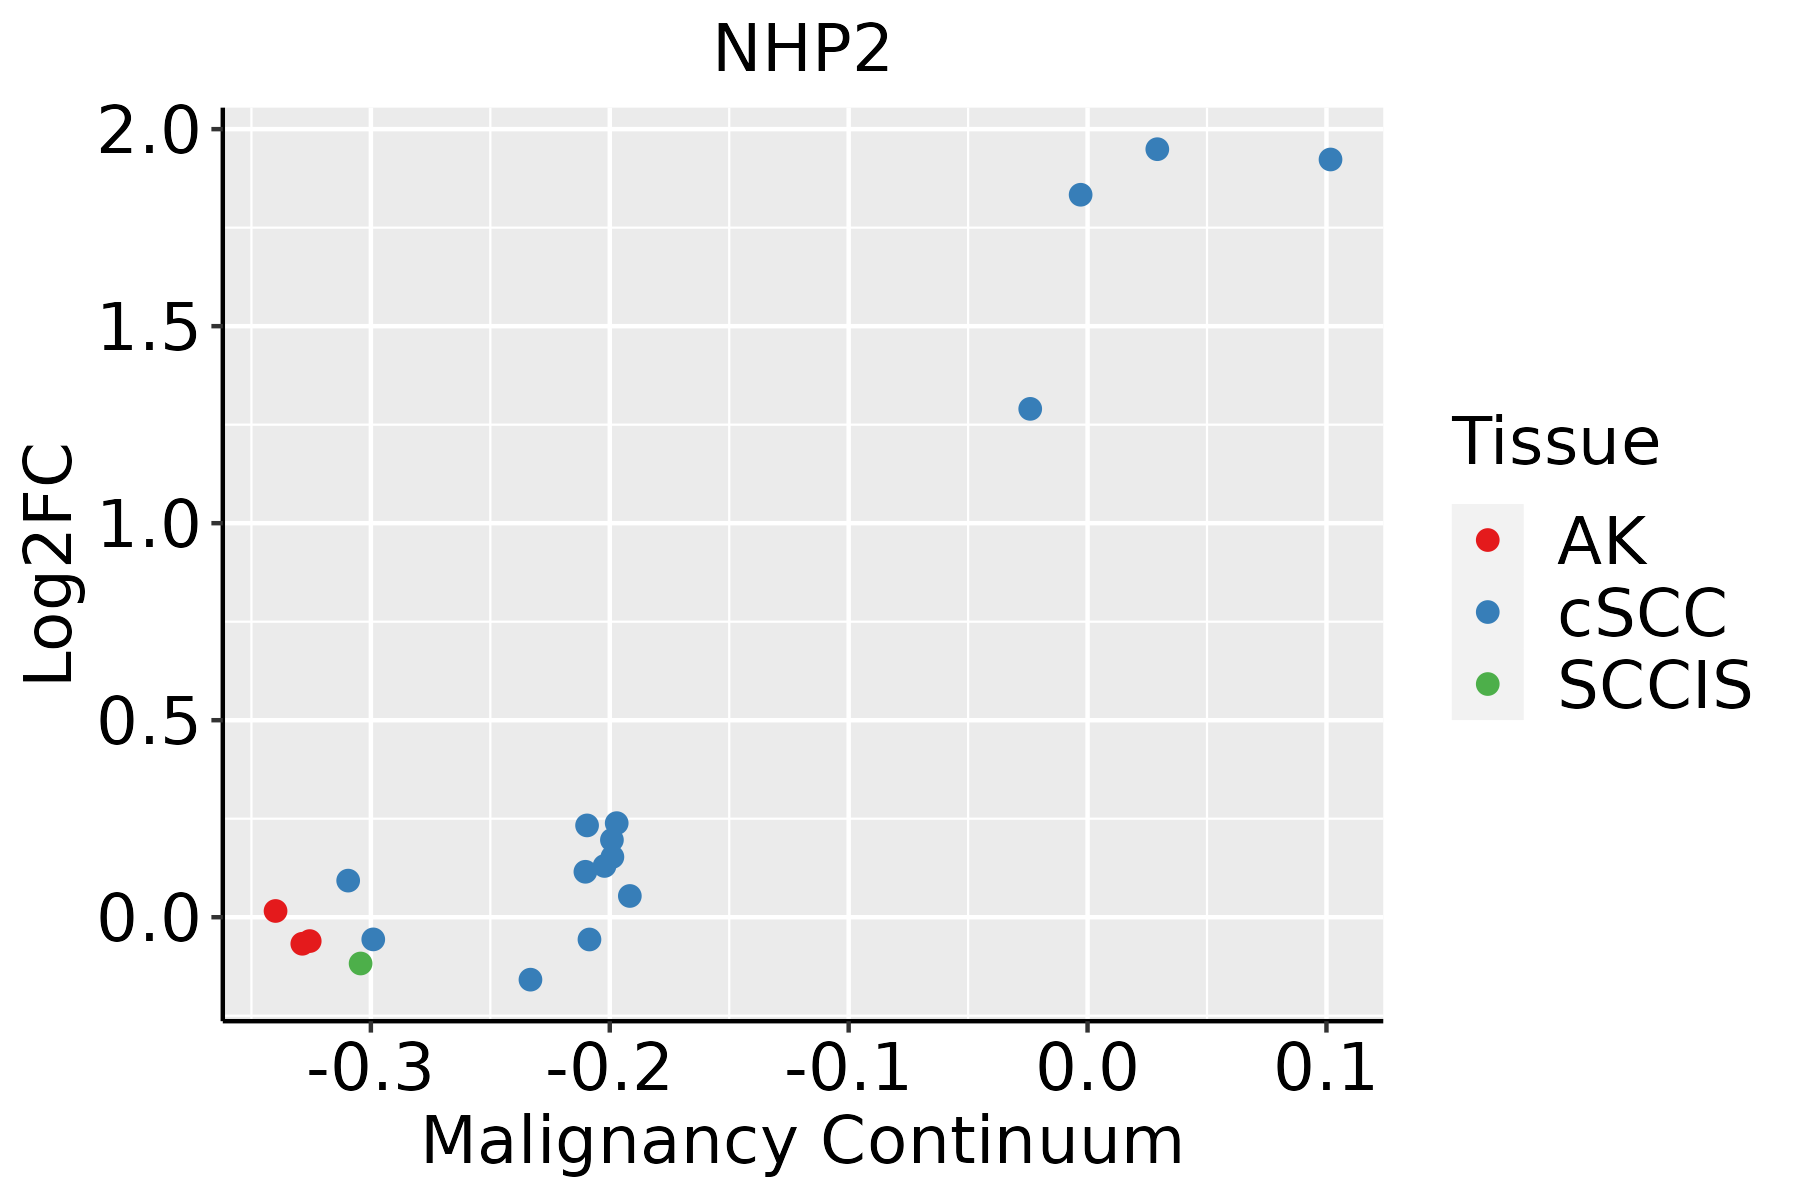 | AK: Actinic keratosis |
| cSCC: Cutaneous squamous cell carcinoma | ||
| SCCIS:squamous cell carcinoma in situ | ||
| Thyroid | 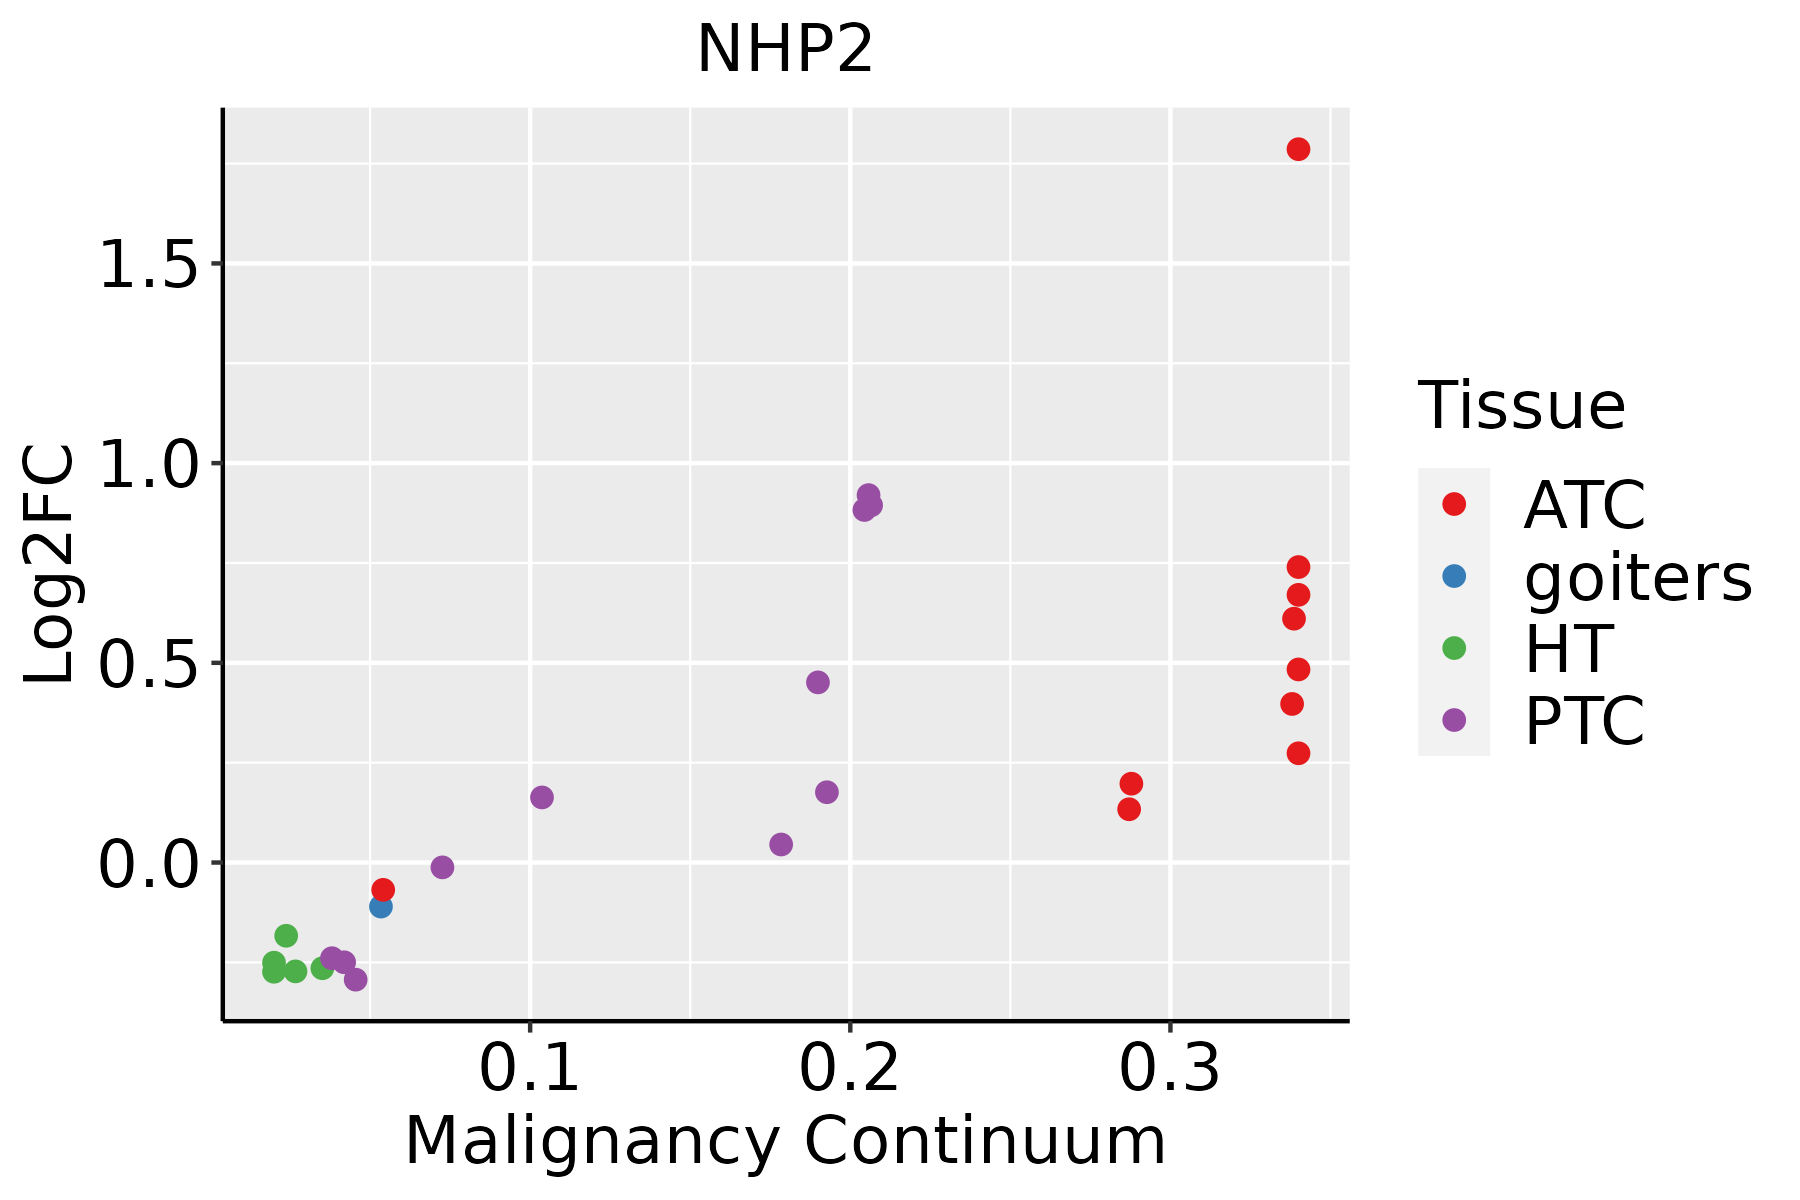 | ATC: Anaplastic thyroid cancer |
| HT: Hashimoto's thyroiditis | ||
| PTC: Papillary thyroid cancer |
| ∗log2FC in expression of this searched gene in stem-like cells from each diseased tissue sample relative to stem-like cells in normal samples in each tissue plotted against the malignancy continuum. Samples are colored based on if they are from different disease stage. |
Top |
Malignant transformation related pathway analysis |
| Find out the enriched GO biological processes and KEGG pathways involved in transition from healthy to precancer to cancer |
| Tissue | Disease Stage | Enriched GO biological Processes |
| Colorectum | AD |  |
| Colorectum | SER |  |
| Colorectum | MSS |  |
| Colorectum | MSI-H |  |
| Colorectum | FAP |  |
| ∗Top 15 enriched GO BP terms are showed in the bar plot of each disease state in each tissue. Each row represents a significant GO biological process which is colored according to the -log10(p.adjust). |
| Page: 1 2 3 4 5 6 7 8 9 |
| GO ID | Tissue | Disease Stage | Description | Gene Ratio | Bg Ratio | pvalue | p.adjust | Count |
| GO:00226139 | Breast | Precancer | ribonucleoprotein complex biogenesis | 79/1080 | 463/18723 | 2.11e-18 | 1.03e-15 | 79 |
| GO:00422549 | Breast | Precancer | ribosome biogenesis | 52/1080 | 299/18723 | 7.35e-13 | 1.51e-10 | 52 |
| GO:00422739 | Breast | Precancer | ribosomal large subunit biogenesis | 22/1080 | 72/18723 | 5.03e-11 | 5.61e-09 | 22 |
| GO:00063646 | Breast | Precancer | rRNA processing | 35/1080 | 225/18723 | 7.90e-08 | 4.60e-06 | 35 |
| GO:00160726 | Breast | Precancer | rRNA metabolic process | 36/1080 | 236/18723 | 8.59e-08 | 4.84e-06 | 36 |
| GO:00108338 | Breast | Precancer | telomere maintenance via telomere lengthening | 15/1080 | 81/18723 | 5.31e-05 | 1.11e-03 | 15 |
| GO:00007238 | Breast | Precancer | telomere maintenance | 20/1080 | 131/18723 | 6.10e-05 | 1.25e-03 | 20 |
| GO:00344705 | Breast | Precancer | ncRNA processing | 42/1080 | 395/18723 | 9.91e-05 | 1.83e-03 | 42 |
| GO:19048743 | Breast | Precancer | positive regulation of telomerase RNA localization to Cajal body | 6/1080 | 15/18723 | 1.16e-04 | 2.08e-03 | 6 |
| GO:00070047 | Breast | Precancer | telomere maintenance via telomerase | 13/1080 | 69/18723 | 1.37e-04 | 2.38e-03 | 13 |
| GO:00062786 | Breast | Precancer | RNA-dependent DNA biosynthetic process | 13/1080 | 75/18723 | 3.27e-04 | 4.64e-03 | 13 |
| GO:19048723 | Breast | Precancer | regulation of telomerase RNA localization to Cajal body | 6/1080 | 18/18723 | 3.70e-04 | 5.04e-03 | 6 |
| GO:00906703 | Breast | Precancer | RNA localization to Cajal body | 6/1080 | 19/18723 | 5.14e-04 | 6.65e-03 | 6 |
| GO:00906713 | Breast | Precancer | telomerase RNA localization to Cajal body | 6/1080 | 19/18723 | 5.14e-04 | 6.65e-03 | 6 |
| GO:00906723 | Breast | Precancer | telomerase RNA localization | 6/1080 | 19/18723 | 5.14e-04 | 6.65e-03 | 6 |
| GO:00906853 | Breast | Precancer | RNA localization to nucleus | 6/1080 | 19/18723 | 5.14e-04 | 6.65e-03 | 6 |
| GO:00322003 | Breast | Precancer | telomere organization | 20/1080 | 159/18723 | 8.45e-04 | 9.82e-03 | 20 |
| GO:00004703 | Breast | Precancer | maturation of LSU-rRNA | 7/1080 | 28/18723 | 8.46e-04 | 9.82e-03 | 7 |
| GO:00346604 | Breast | Precancer | ncRNA metabolic process | 45/1080 | 485/18723 | 1.15e-03 | 1.26e-02 | 45 |
| GO:00064039 | Breast | Precancer | RNA localization | 23/1080 | 201/18723 | 1.34e-03 | 1.41e-02 | 23 |
| Page: 1 2 3 4 5 6 7 8 9 10 11 12 13 14 15 16 17 18 19 20 |
| Pathway ID | Tissue | Disease Stage | Description | Gene Ratio | Bg Ratio | pvalue | p.adjust | qvalue | Count |
| Page: 1 |
Top |
Cell-cell communication analysis |
| Identification of potential cell-cell interactions between two cell types and their ligand-receptor pairs for different disease states |
| Ligand | Receptor | LRpair | Pathway | Tissue | Disease Stage |
| Page: 1 |
Top |
Single-cell gene regulatory network inference analysis |
| Find out the significant the regulons (TFs) and the target genes of each regulon across cell types for different disease states |
| TF | Cell Type | Tissue | Disease Stage | Target Gene | RSS | Regulon Activity |
| ∗The dot plots of a searched regulon are shown for all cell subpopulations in each disease state of each tissue based on the regulon specific score inferred using pySCENIC and by calculating the average expression. |
| Page: 1 |
Top |
Somatic mutation of malignant transformation related genes |
| Annotation of somatic variants for genes involved in malignant transformation |
| Hugo Symbol | Variant Class | Variant Classification | dbSNP RS | HGVSc | HGVSp | HGVSp Short | SWISSPROT | BIOTYPE | SIFT | PolyPhen | Tumor Sample Barcode | Tissue | Histology | Sex | Age | Stage | Therapy Types | Drugs | Outcome |
| NHP2 | deletion | Frame_Shift_Del | novel | c.99delN | p.Ile34SerfsTer22 | p.I34Sfs*22 | Q9NX24 | protein_coding | TCGA-D8-A27V-01 | Breast | breast invasive carcinoma | Female | <65 | I/II | Hormone Therapy | tamoxiphen | SD | ||
| NHP2 | SNV | Missense_Mutation | c.235A>G | p.Met79Val | p.M79V | Q9NX24 | protein_coding | tolerated(1) | benign(0) | TCGA-F4-6570-01 | Colorectum | colon adenocarcinoma | Female | >=65 | I/II | Unknown | Unknown | SD | |
| NHP2 | SNV | Missense_Mutation | c.418N>A | p.Asp140Asn | p.D140N | Q9NX24 | protein_coding | tolerated(0.11) | benign(0.007) | TCGA-CI-6619-01 | Colorectum | rectum adenocarcinoma | Male | <65 | III/IV | Unknown | Unknown | SD | |
| NHP2 | SNV | Missense_Mutation | c.242N>C | p.Leu81Ser | p.L81S | Q9NX24 | protein_coding | deleterious(0) | possibly_damaging(0.773) | TCGA-B5-A11G-01 | Endometrium | uterine corpus endometrioid carcinoma | Female | >=65 | I/II | Unknown | Unknown | SD | |
| NHP2 | SNV | Missense_Mutation | rs752392516 | c.364N>T | p.Arg122Cys | p.R122C | Q9NX24 | protein_coding | deleterious(0) | probably_damaging(0.931) | TCGA-B5-A1MR-01 | Endometrium | uterine corpus endometrioid carcinoma | Female | >=65 | III/IV | Unknown | Unknown | SD |
| NHP2 | SNV | Missense_Mutation | novel | c.404N>G | p.Tyr135Cys | p.Y135C | Q9NX24 | protein_coding | deleterious(0) | probably_damaging(1) | TCGA-DI-A1BU-01 | Endometrium | uterine corpus endometrioid carcinoma | Female | <65 | I/II | Chemotherapy | paclitaxel | SD |
| NHP2 | SNV | Missense_Mutation | novel | c.43G>T | p.Ala15Ser | p.A15S | Q9NX24 | protein_coding | tolerated(0.51) | benign(0.018) | TCGA-FI-A2F4-01 | Endometrium | uterine corpus endometrioid carcinoma | Female | <65 | I/II | Unknown | Unknown | SD |
| NHP2 | SNV | Missense_Mutation | c.177G>C | p.Gln59His | p.Q59H | Q9NX24 | protein_coding | tolerated(0.41) | possibly_damaging(0.77) | TCGA-55-6979-01 | Lung | lung adenocarcinoma | Female | <65 | I/II | Chemotherapy | carboplatin | PD | |
| NHP2 | SNV | Missense_Mutation | c.418N>A | p.Asp140Asn | p.D140N | Q9NX24 | protein_coding | tolerated(0.11) | benign(0.007) | TCGA-L9-A8F4-01 | Lung | lung adenocarcinoma | Female | <65 | I/II | Unknown | Unknown | SD | |
| NHP2 | SNV | Missense_Mutation | novel | c.259C>G | p.Pro87Ala | p.P87A | Q9NX24 | protein_coding | deleterious(0) | probably_damaging(0.994) | TCGA-34-2609-01 | Lung | lung squamous cell carcinoma | Male | >=65 | I/II | Chemotherapy | gemcitabine | PD |
| Page: 1 2 |
Top |
Related drugs of malignant transformation related genes |
| Identification of chemicals and drugs interact with genes involved in malignant transfromation |
| (DGIdb 4.0) |
| Entrez ID | Symbol | Category | Interaction Types | Drug Claim Name | Drug Name | PMIDs |
| Page: 1 |

Copyright 2023-Present -The University of Texas Health Science Center at Houston |