| Tissue | Expression Dynamics | Abbreviation |
| Esophagus |  | ESCC: Esophageal squamous cell carcinoma |
| HGIN: High-grade intraepithelial neoplasias |
| LGIN: Low-grade intraepithelial neoplasias |
| Liver | 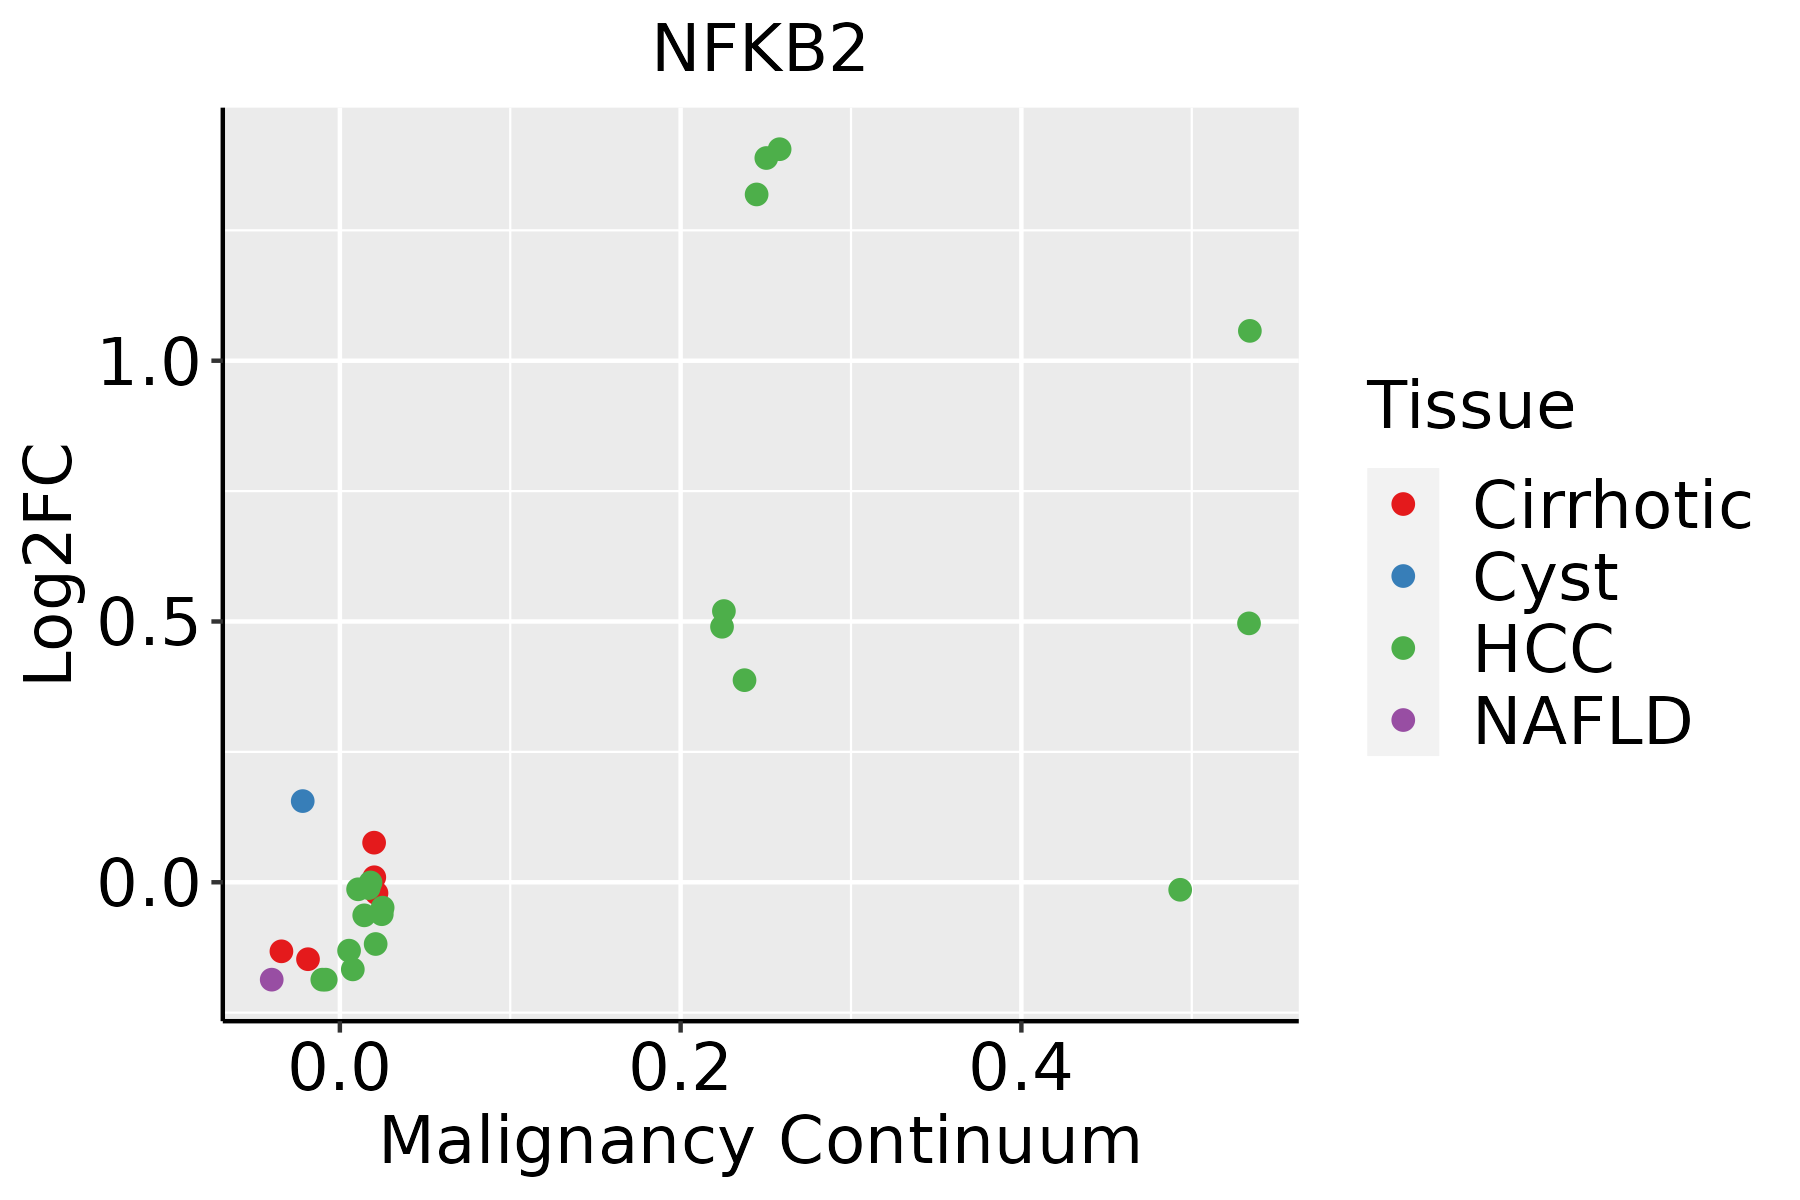 | HCC: Hepatocellular carcinoma |
| NAFLD: Non-alcoholic fatty liver disease |
| Oral Cavity | 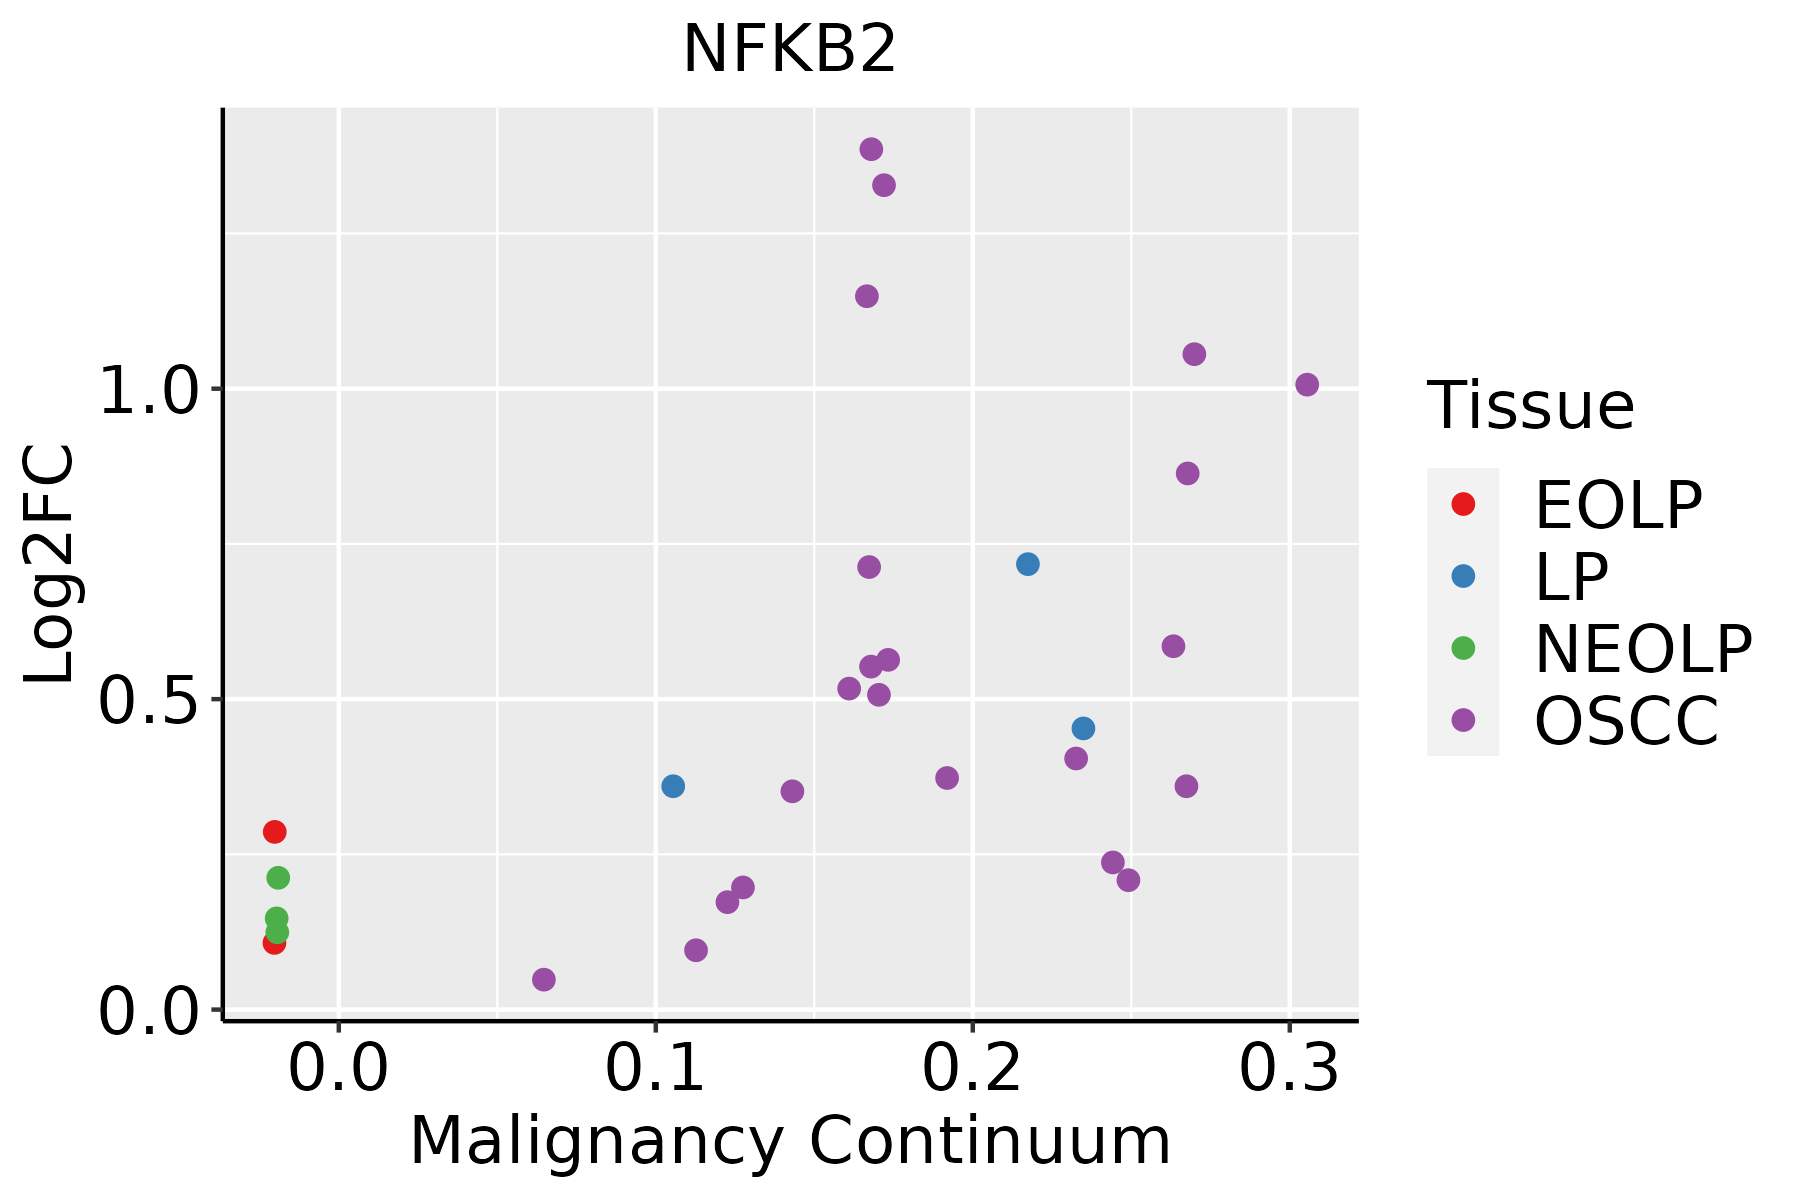 | EOLP: Erosive Oral lichen planus |
| LP: leukoplakia |
| NEOLP: Non-erosive oral lichen planus |
| OSCC: Oral squamous cell carcinoma |
| Prostate | 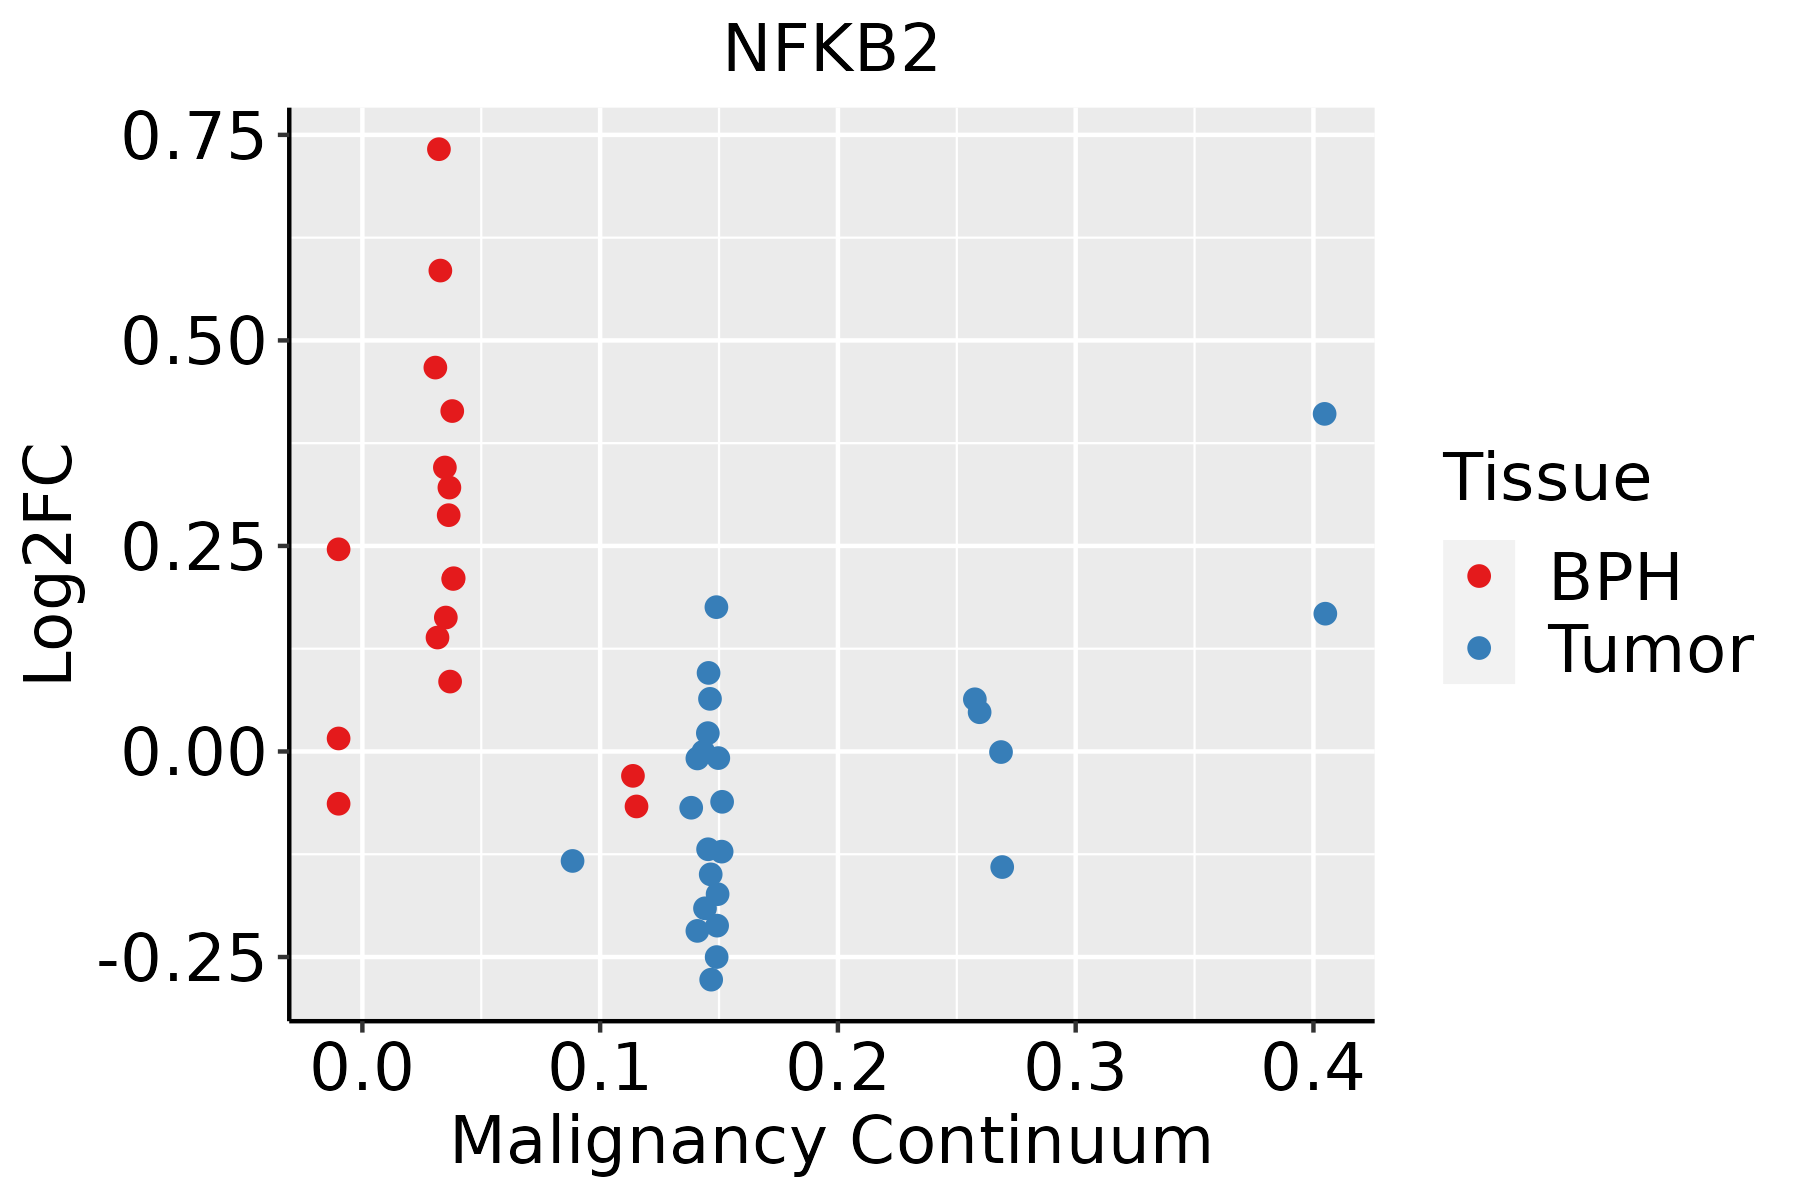 | BPH: Benign Prostatic Hyperplasia |
| Thyroid | 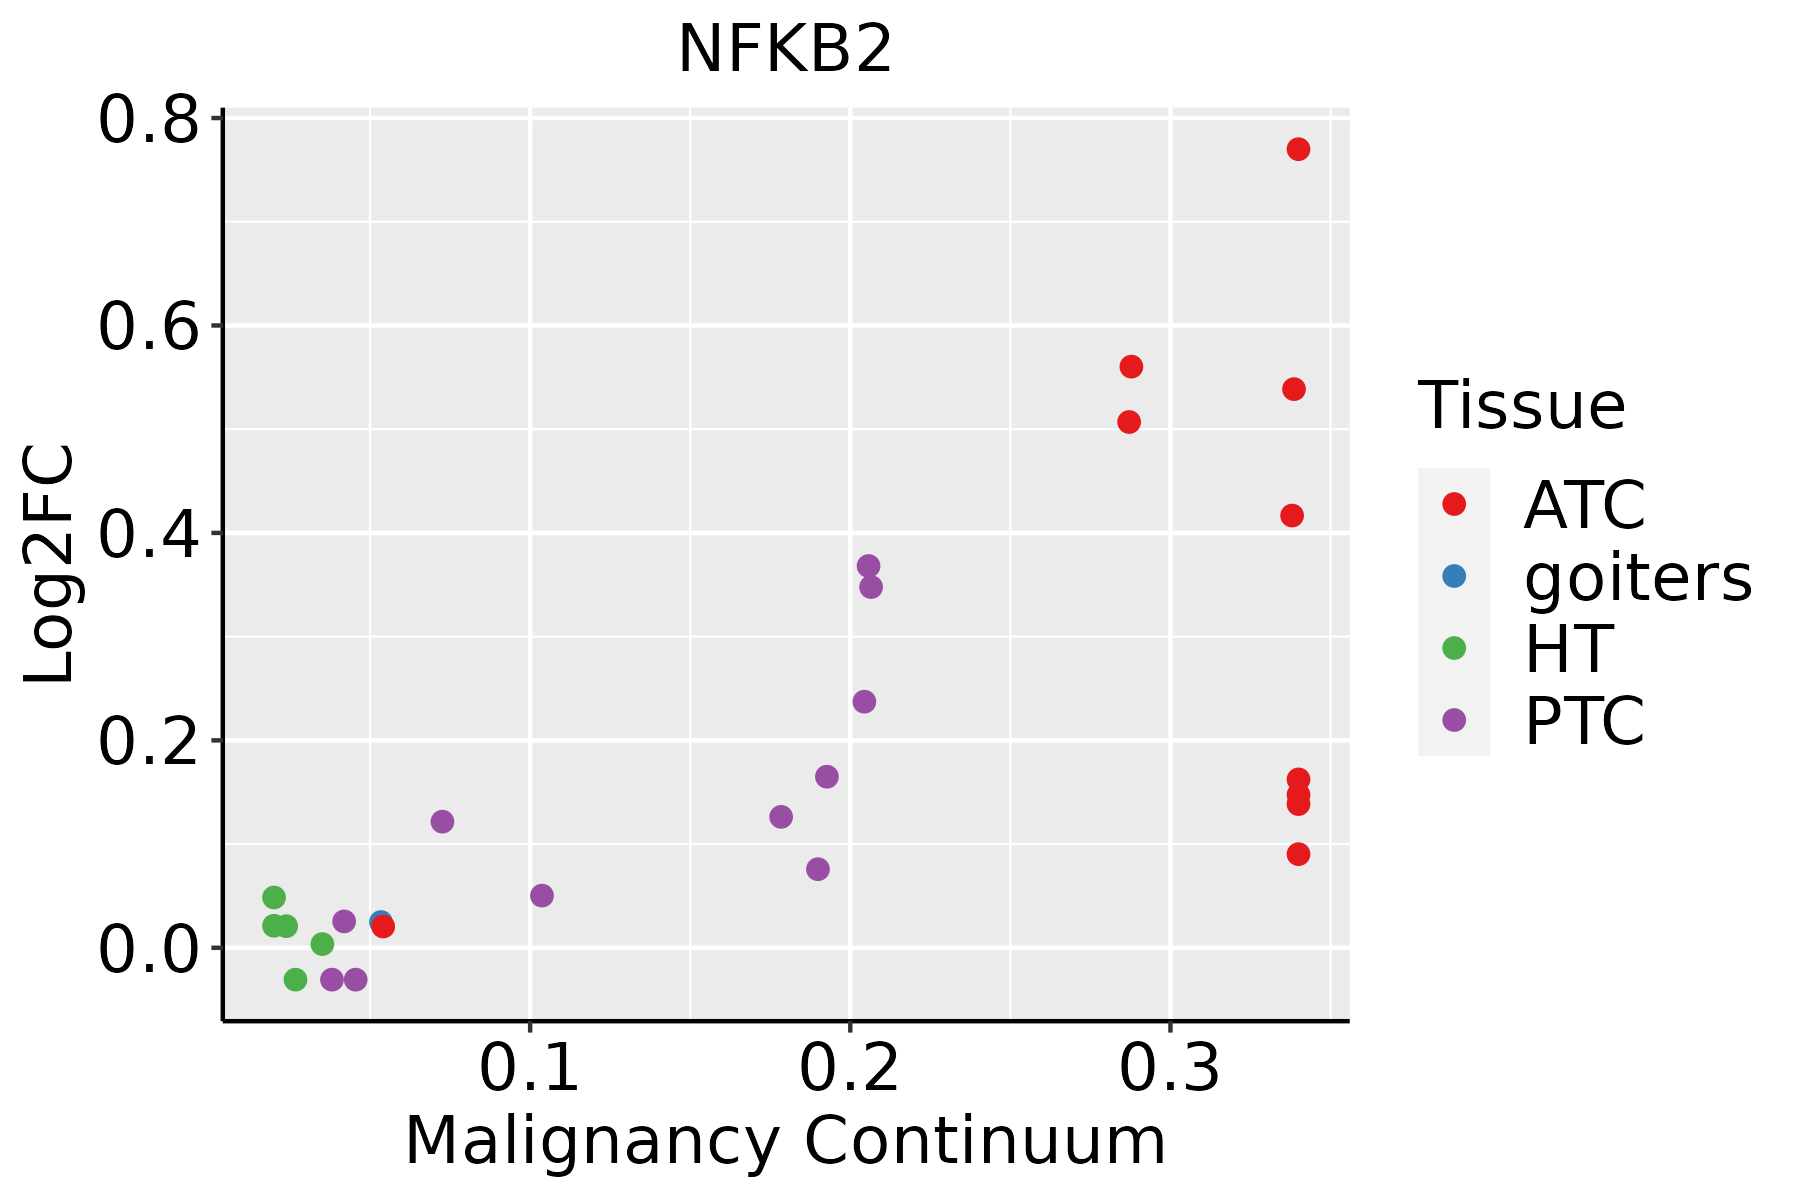 | ATC: Anaplastic thyroid cancer |
| HT: Hashimoto's thyroiditis |
| PTC: Papillary thyroid cancer |
| GO ID | Tissue | Disease Stage | Description | Gene Ratio | Bg Ratio | pvalue | p.adjust | Count |
| GO:000756820 | Esophagus | ESCC | aging | 201/8552 | 339/18723 | 2.64e-07 | 3.94e-06 | 201 |
| GO:00301984 | Esophagus | ESCC | extracellular matrix organization | 171/8552 | 301/18723 | 6.08e-05 | 4.67e-04 | 171 |
| GO:00430624 | Esophagus | ESCC | extracellular structure organization | 171/8552 | 302/18723 | 7.73e-05 | 5.76e-04 | 171 |
| GO:00452294 | Esophagus | ESCC | external encapsulating structure organization | 172/8552 | 304/18723 | 7.80e-05 | 5.80e-04 | 172 |
| GO:003249619 | Esophagus | ESCC | response to lipopolysaccharide | 191/8552 | 343/18723 | 1.11e-04 | 7.73e-04 | 191 |
| GO:004851118 | Esophagus | ESCC | rhythmic process | 164/8552 | 298/18723 | 6.80e-04 | 3.57e-03 | 164 |
| GO:000223719 | Esophagus | ESCC | response to molecule of bacterial origin | 194/8552 | 363/18723 | 1.64e-03 | 7.61e-03 | 194 |
| GO:0002467 | Esophagus | ESCC | germinal center formation | 12/8552 | 14/18723 | 2.51e-03 | 1.08e-02 | 12 |
| GO:00380615 | Esophagus | ESCC | NIK/NF-kappaB signaling | 81/8552 | 143/18723 | 5.33e-03 | 2.00e-02 | 81 |
| GO:000756812 | Liver | Cirrhotic | aging | 117/4634 | 339/18723 | 3.13e-05 | 3.91e-04 | 117 |
| GO:004851111 | Liver | Cirrhotic | rhythmic process | 103/4634 | 298/18723 | 8.47e-05 | 9.19e-04 | 103 |
| GO:0038061 | Liver | Cirrhotic | NIK/NF-kappaB signaling | 54/4634 | 143/18723 | 3.64e-04 | 3.07e-03 | 54 |
| GO:00324966 | Liver | Cirrhotic | response to lipopolysaccharide | 111/4634 | 343/18723 | 8.15e-04 | 5.95e-03 | 111 |
| GO:00022376 | Liver | Cirrhotic | response to molecule of bacterial origin | 113/4634 | 363/18723 | 3.23e-03 | 1.81e-02 | 113 |
| GO:000756822 | Liver | HCC | aging | 185/7958 | 339/18723 | 4.28e-06 | 5.50e-05 | 185 |
| GO:004851121 | Liver | HCC | rhythmic process | 156/7958 | 298/18723 | 3.54e-04 | 2.46e-03 | 156 |
| GO:003249611 | Liver | HCC | response to lipopolysaccharide | 174/7958 | 343/18723 | 1.19e-03 | 6.62e-03 | 174 |
| GO:000223711 | Liver | HCC | response to molecule of bacterial origin | 181/7958 | 363/18723 | 2.58e-03 | 1.24e-02 | 181 |
| GO:00380611 | Liver | HCC | NIK/NF-kappaB signaling | 77/7958 | 143/18723 | 3.98e-03 | 1.76e-02 | 77 |
| GO:000756818 | Oral cavity | OSCC | aging | 194/7305 | 339/18723 | 6.18e-12 | 2.33e-10 | 194 |
| Pathway ID | Tissue | Disease Stage | Description | Gene Ratio | Bg Ratio | pvalue | p.adjust | qvalue | Count |
| hsa05166211 | Esophagus | ESCC | Human T-cell leukemia virus 1 infection | 164/4205 | 222/8465 | 8.13e-14 | 2.09e-12 | 1.07e-12 | 164 |
| hsa05169210 | Esophagus | ESCC | Epstein-Barr virus infection | 151/4205 | 202/8465 | 1.55e-13 | 3.45e-12 | 1.77e-12 | 151 |
| hsa0520325 | Esophagus | ESCC | Viral carcinogenesis | 137/4205 | 204/8465 | 2.47e-07 | 1.88e-06 | 9.62e-07 | 137 |
| hsa046259 | Esophagus | ESCC | C-type lectin receptor signaling pathway | 73/4205 | 104/8465 | 1.57e-05 | 7.98e-05 | 4.09e-05 | 73 |
| hsa0513428 | Esophagus | ESCC | Legionellosis | 42/4205 | 57/8465 | 1.83e-04 | 6.90e-04 | 3.53e-04 | 42 |
| hsa040645 | Esophagus | ESCC | NF-kappa B signaling pathway | 67/4205 | 104/8465 | 1.62e-03 | 4.89e-03 | 2.50e-03 | 67 |
| hsa05166310 | Esophagus | ESCC | Human T-cell leukemia virus 1 infection | 164/4205 | 222/8465 | 8.13e-14 | 2.09e-12 | 1.07e-12 | 164 |
| hsa0516937 | Esophagus | ESCC | Epstein-Barr virus infection | 151/4205 | 202/8465 | 1.55e-13 | 3.45e-12 | 1.77e-12 | 151 |
| hsa0520335 | Esophagus | ESCC | Viral carcinogenesis | 137/4205 | 204/8465 | 2.47e-07 | 1.88e-06 | 9.62e-07 | 137 |
| hsa0462513 | Esophagus | ESCC | C-type lectin receptor signaling pathway | 73/4205 | 104/8465 | 1.57e-05 | 7.98e-05 | 4.09e-05 | 73 |
| hsa0513436 | Esophagus | ESCC | Legionellosis | 42/4205 | 57/8465 | 1.83e-04 | 6.90e-04 | 3.53e-04 | 42 |
| hsa0406412 | Esophagus | ESCC | NF-kappa B signaling pathway | 67/4205 | 104/8465 | 1.62e-03 | 4.89e-03 | 2.50e-03 | 67 |
| hsa0516614 | Liver | Cirrhotic | Human T-cell leukemia virus 1 infection | 87/2530 | 222/8465 | 1.69e-03 | 8.01e-03 | 4.94e-03 | 87 |
| hsa0513412 | Liver | Cirrhotic | Legionellosis | 28/2530 | 57/8465 | 1.71e-03 | 8.01e-03 | 4.94e-03 | 28 |
| hsa0516914 | Liver | Cirrhotic | Epstein-Barr virus infection | 80/2530 | 202/8465 | 1.80e-03 | 8.33e-03 | 5.13e-03 | 80 |
| hsa05203 | Liver | Cirrhotic | Viral carcinogenesis | 76/2530 | 204/8465 | 1.34e-02 | 4.20e-02 | 2.59e-02 | 76 |
| hsa0516615 | Liver | Cirrhotic | Human T-cell leukemia virus 1 infection | 87/2530 | 222/8465 | 1.69e-03 | 8.01e-03 | 4.94e-03 | 87 |
| hsa0513413 | Liver | Cirrhotic | Legionellosis | 28/2530 | 57/8465 | 1.71e-03 | 8.01e-03 | 4.94e-03 | 28 |
| hsa0516915 | Liver | Cirrhotic | Epstein-Barr virus infection | 80/2530 | 202/8465 | 1.80e-03 | 8.33e-03 | 5.13e-03 | 80 |
| hsa052031 | Liver | Cirrhotic | Viral carcinogenesis | 76/2530 | 204/8465 | 1.34e-02 | 4.20e-02 | 2.59e-02 | 76 |
| Hugo Symbol | Variant Class | Variant Classification | dbSNP RS | HGVSc | HGVSp | HGVSp Short | SWISSPROT | BIOTYPE | SIFT | PolyPhen | Tumor Sample Barcode | Tissue | Histology | Sex | Age | Stage | Therapy Types | Drugs | Outcome |
| NFKB2 | SNV | Missense_Mutation | novel | c.919N>A | p.Leu307Met | p.L307M | Q00653 | protein_coding | deleterious(0.01) | probably_damaging(0.999) | TCGA-AN-A046-01 | Breast | breast invasive carcinoma | Female | >=65 | I/II | Unknown | Unknown | SD |
| NFKB2 | SNV | Missense_Mutation | | c.419A>G | p.His140Arg | p.H140R | Q00653 | protein_coding | deleterious(0) | probably_damaging(0.999) | TCGA-AO-A128-01 | Breast | breast invasive carcinoma | Female | <65 | I/II | Chemotherapy | doxorubicin | SD |
| NFKB2 | SNV | Missense_Mutation | novel | c.146N>A | p.Arg49Lys | p.R49K | Q00653 | protein_coding | deleterious(0.01) | possibly_damaging(0.722) | TCGA-B6-A0WZ-01 | Breast | breast invasive carcinoma | Female | <65 | I/II | Unknown | Unknown | PD |
| NFKB2 | SNV | Missense_Mutation | | c.830N>T | p.Ser277Phe | p.S277F | Q00653 | protein_coding | deleterious(0) | probably_damaging(0.959) | TCGA-BH-A0DE-01 | Breast | breast invasive carcinoma | Female | <65 | I/II | Unknown | Unknown | SD |
| NFKB2 | SNV | Missense_Mutation | rs775379081 | c.479N>A | p.Arg160His | p.R160H | Q00653 | protein_coding | deleterious(0.01) | probably_damaging(0.969) | TCGA-C8-A8HR-01 | Breast | breast invasive carcinoma | Female | <65 | III/IV | Chemotherapy | 5-fluorouracil | CR |
| NFKB2 | SNV | Missense_Mutation | rs767315544 | c.1773N>T | p.Gln591His | p.Q591H | Q00653 | protein_coding | tolerated(0.67) | benign(0.006) | TCGA-E2-A1IN-01 | Breast | breast invasive carcinoma | Female | <65 | I/II | Hormone Therapy | arimidex | SD |
| NFKB2 | insertion | Frame_Shift_Ins | novel | c.771_772insTGCTTGCTTTCATGGTT | p.Ile258CysfsTer46 | p.I258Cfs*46 | Q00653 | protein_coding | | | TCGA-A7-A0CJ-01 | Breast | breast invasive carcinoma | Female | <65 | I/II | Chemotherapy | cytoxan | SD |
| NFKB2 | deletion | Frame_Shift_Del | | c.879delC | p.Tyr294IlefsTer4 | p.Y294Ifs*4 | Q00653 | protein_coding | | | TCGA-A7-A0DA-01 | Breast | breast invasive carcinoma | Female | <65 | I/II | Chemotherapy | adriamycin | SD |
| NFKB2 | insertion | Frame_Shift_Ins | novel | c.1015_1016insCAAGCTGTGCAGTCAAACA | p.Arg339ProfsTer173 | p.R339Pfs*173 | Q00653 | protein_coding | | | TCGA-AR-A0TY-01 | Breast | breast invasive carcinoma | Female | <65 | I/II | Unspecific | Paclitaxel | PD |
| NFKB2 | SNV | Missense_Mutation | novel | c.65C>A | p.Ser22Tyr | p.S22Y | Q00653 | protein_coding | tolerated(0.05) | benign(0.084) | TCGA-2W-A8YY-01 | Cervix | cervical & endocervical cancer | Female | <65 | I/II | Chemotherapy | cisplatin | CR |
| Entrez ID | Symbol | Category | Interaction Types | Drug Claim Name | Drug Name | PMIDs |
| 4791 | NFKB2 | CLINICALLY ACTIONABLE, DRUGGABLE GENOME, KINASE, TRANSCRIPTION FACTOR | | Quinoxaline derivative 3 | | |
| 4791 | NFKB2 | CLINICALLY ACTIONABLE, DRUGGABLE GENOME, KINASE, TRANSCRIPTION FACTOR | | 1-hydroxyl-3,5-bis(4-hydroxylstyryl)benzene derivative 1 | | |
| 4791 | NFKB2 | CLINICALLY ACTIONABLE, DRUGGABLE GENOME, KINASE, TRANSCRIPTION FACTOR | | MD1003 | | |
| 4791 | NFKB2 | CLINICALLY ACTIONABLE, DRUGGABLE GENOME, KINASE, TRANSCRIPTION FACTOR | | PG-490-88 | | |
| 4791 | NFKB2 | CLINICALLY ACTIONABLE, DRUGGABLE GENOME, KINASE, TRANSCRIPTION FACTOR | | PMID25553724-Compound-US20138552206 5 | | |
| 4791 | NFKB2 | CLINICALLY ACTIONABLE, DRUGGABLE GENOME, KINASE, TRANSCRIPTION FACTOR | | CID 867101 | CHEMBL406557 | |
| 4791 | NFKB2 | CLINICALLY ACTIONABLE, DRUGGABLE GENOME, KINASE, TRANSCRIPTION FACTOR | | Edasalonexent | EDASALONEXENT | |
| 4791 | NFKB2 | CLINICALLY ACTIONABLE, DRUGGABLE GENOME, KINASE, TRANSCRIPTION FACTOR | | PMID25553724-Compound-US2011801300410 | | |
| 4791 | NFKB2 | CLINICALLY ACTIONABLE, DRUGGABLE GENOME, KINASE, TRANSCRIPTION FACTOR | | N-quinolin-benzene sulphonamide derivative 1 | | |
| 4791 | NFKB2 | CLINICALLY ACTIONABLE, DRUGGABLE GENOME, KINASE, TRANSCRIPTION FACTOR | | DNDI1417548 | CHEMBL2094789 | |


