
|
|||||
|
 | |
| |
| |
| |
| |
| |
|
Gene: NDUFV3 |
Gene summary for NDUFV3 |
| Gene information | Species | Human | Gene symbol | NDUFV3 | Gene ID | 4731 |
| Gene name | NADH:ubiquinone oxidoreductase subunit V3 | |
| Gene Alias | CI-10k | |
| Cytomap | 21q22.3 | |
| Gene Type | protein-coding | GO ID | GO:0006091 | UniProtAcc | P56181 |
Top |
Malignant transformation analysis |
| Identification of the aberrant gene expression in precancerous and cancerous lesions by comparing the gene expression of stem-like cells in diseased tissues with normal stem cells |
| Entrez ID | Symbol | Replicates | Species | Organ | Tissue | Adj P-value | Log2FC | Malignancy |
| 4731 | NDUFV3 | cirrhotic1 | Human | Liver | Cirrhotic | 3.18e-13 | 2.06e-01 | 0.0202 |
| 4731 | NDUFV3 | cirrhotic2 | Human | Liver | Cirrhotic | 9.43e-16 | 1.86e-01 | 0.0201 |
| 4731 | NDUFV3 | cirrhotic3 | Human | Liver | Cirrhotic | 1.50e-06 | 4.55e-02 | 0.0215 |
| 4731 | NDUFV3 | HCC1 | Human | Liver | HCC | 1.51e-03 | 4.26e+00 | 0.5336 |
| 4731 | NDUFV3 | HCC2 | Human | Liver | HCC | 5.68e-09 | 3.98e+00 | 0.5341 |
| 4731 | NDUFV3 | Pt13.b | Human | Liver | HCC | 1.68e-13 | 1.66e-02 | 0.0251 |
| 4731 | NDUFV3 | Pt14.b | Human | Liver | HCC | 1.24e-02 | 2.46e-02 | 0.018 |
| 4731 | NDUFV3 | S014 | Human | Liver | HCC | 1.29e-06 | 5.13e-01 | 0.2254 |
| 4731 | NDUFV3 | S015 | Human | Liver | HCC | 1.01e-08 | 7.68e-01 | 0.2375 |
| 4731 | NDUFV3 | S016 | Human | Liver | HCC | 4.10e-08 | 6.98e-01 | 0.2243 |
| 4731 | NDUFV3 | S027 | Human | Liver | HCC | 1.91e-11 | 1.42e+00 | 0.2446 |
| 4731 | NDUFV3 | S028 | Human | Liver | HCC | 4.69e-26 | 1.77e+00 | 0.2503 |
| 4731 | NDUFV3 | S029 | Human | Liver | HCC | 2.32e-24 | 1.91e+00 | 0.2581 |
| 4731 | NDUFV3 | C04 | Human | Oral cavity | OSCC | 2.63e-23 | 1.20e+00 | 0.2633 |
| 4731 | NDUFV3 | C21 | Human | Oral cavity | OSCC | 3.69e-31 | 1.15e+00 | 0.2678 |
| 4731 | NDUFV3 | C30 | Human | Oral cavity | OSCC | 2.30e-49 | 2.45e+00 | 0.3055 |
| 4731 | NDUFV3 | C38 | Human | Oral cavity | OSCC | 1.04e-15 | 1.54e+00 | 0.172 |
| 4731 | NDUFV3 | C43 | Human | Oral cavity | OSCC | 1.33e-11 | 3.18e-01 | 0.1704 |
| 4731 | NDUFV3 | C46 | Human | Oral cavity | OSCC | 7.41e-19 | 5.39e-01 | 0.1673 |
| 4731 | NDUFV3 | C51 | Human | Oral cavity | OSCC | 4.76e-08 | 6.18e-01 | 0.2674 |
| Page: 1 2 3 4 5 6 7 8 |
| Tissue | Expression Dynamics | Abbreviation |
| Breast | 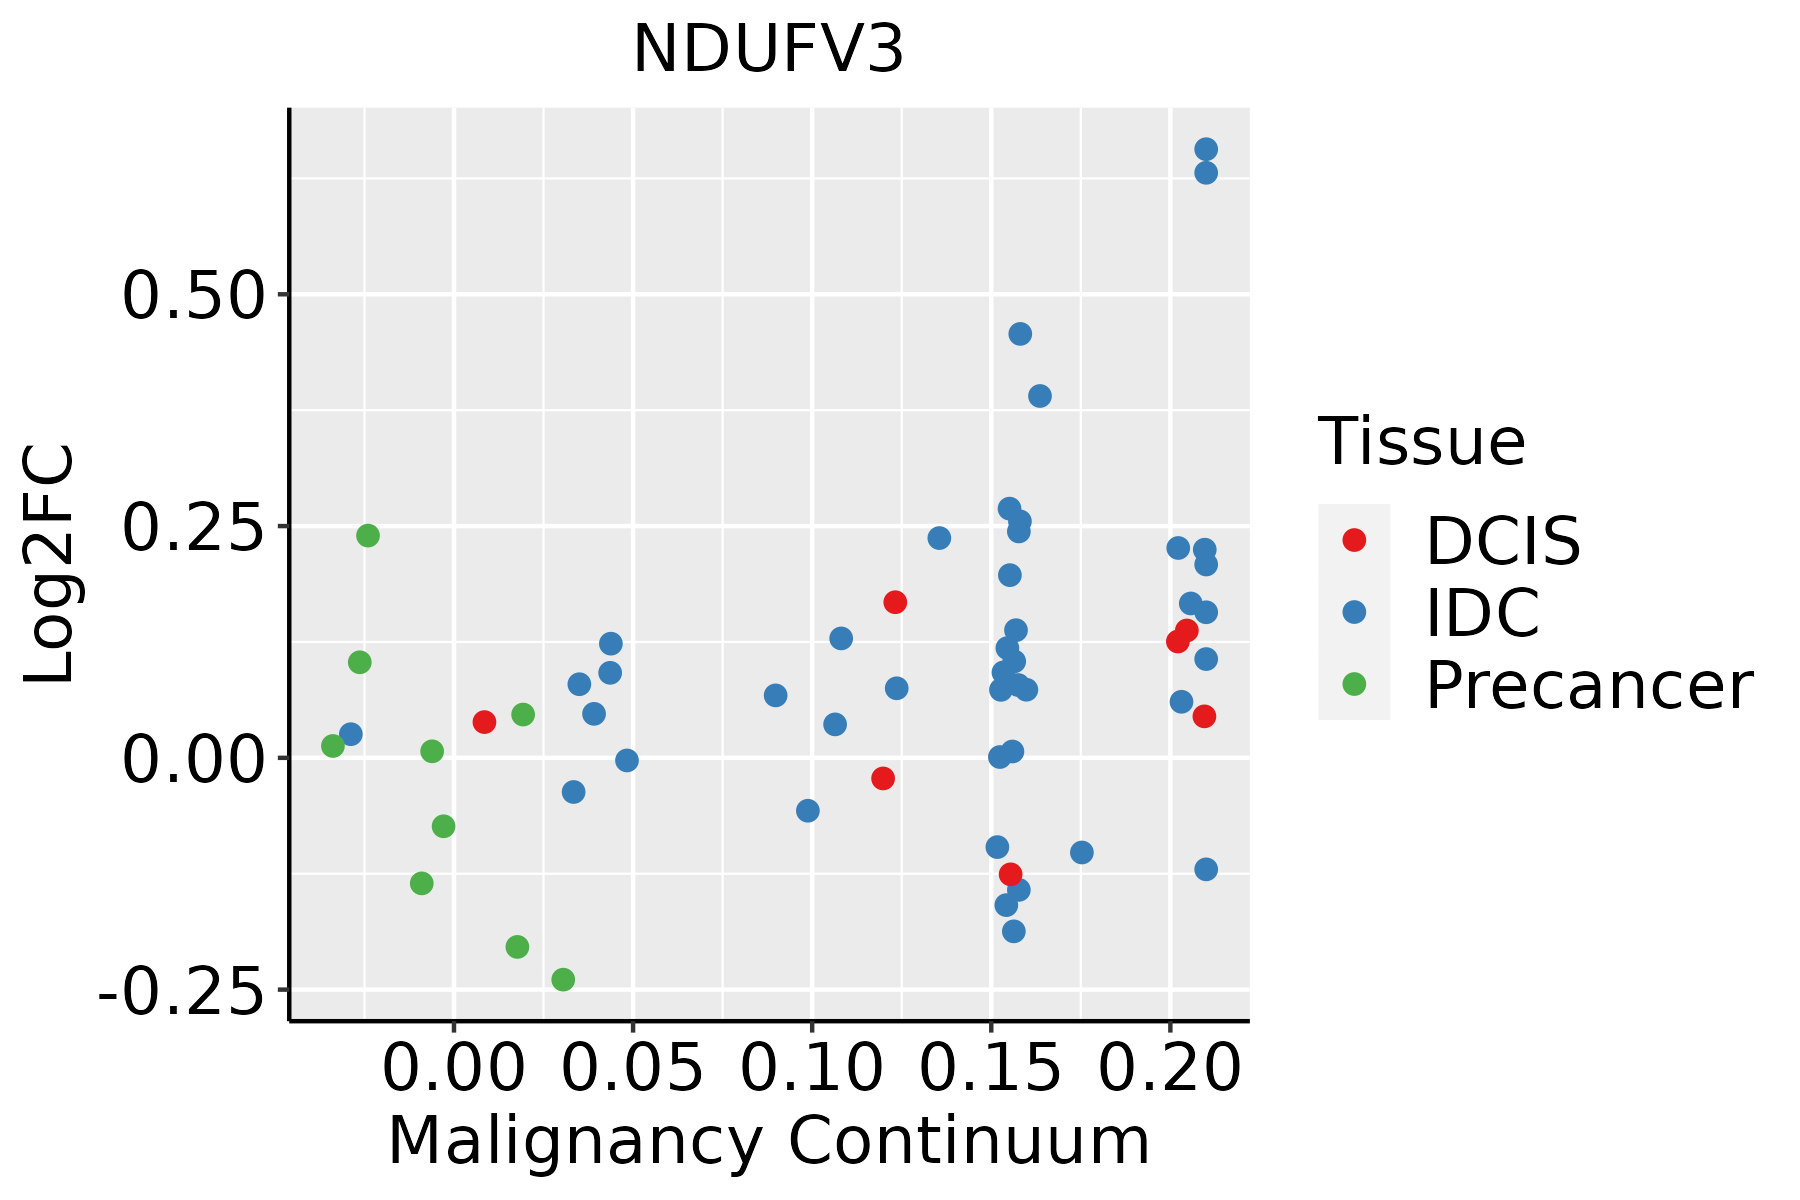 | IDC: Invasive ductal carcinoma |
| DCIS: Ductal carcinoma in situ | ||
| Precancer(BRCA1-mut): Precancerous lesion from BRCA1 mutation carriers | ||
| Colorectum (GSE201348) |  | FAP: Familial adenomatous polyposis |
| CRC: Colorectal cancer | ||
| Colorectum (HTA11) |  | AD: Adenomas |
| SER: Sessile serrated lesions | ||
| MSI-H: Microsatellite-high colorectal cancer | ||
| MSS: Microsatellite stable colorectal cancer | ||
| Esophagus | 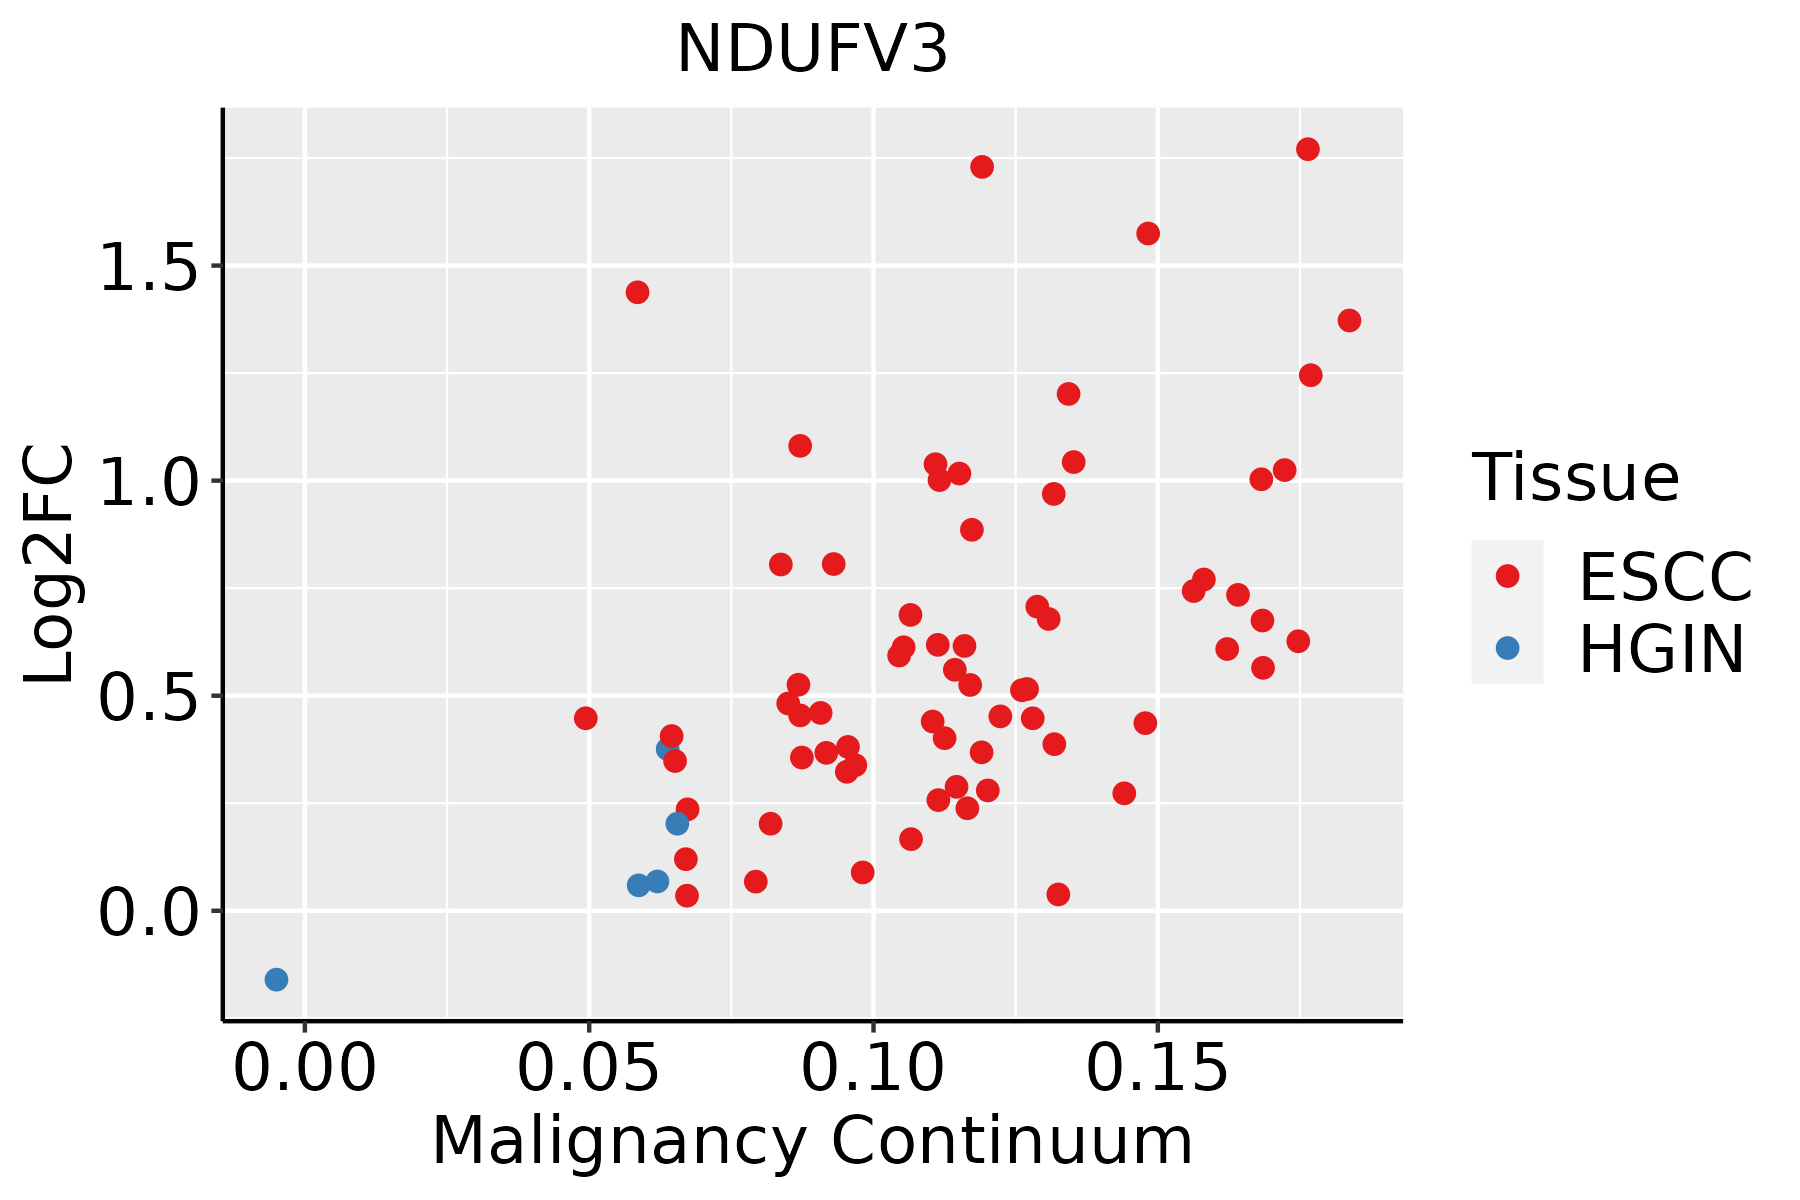 | ESCC: Esophageal squamous cell carcinoma |
| HGIN: High-grade intraepithelial neoplasias | ||
| LGIN: Low-grade intraepithelial neoplasias | ||
| Liver | 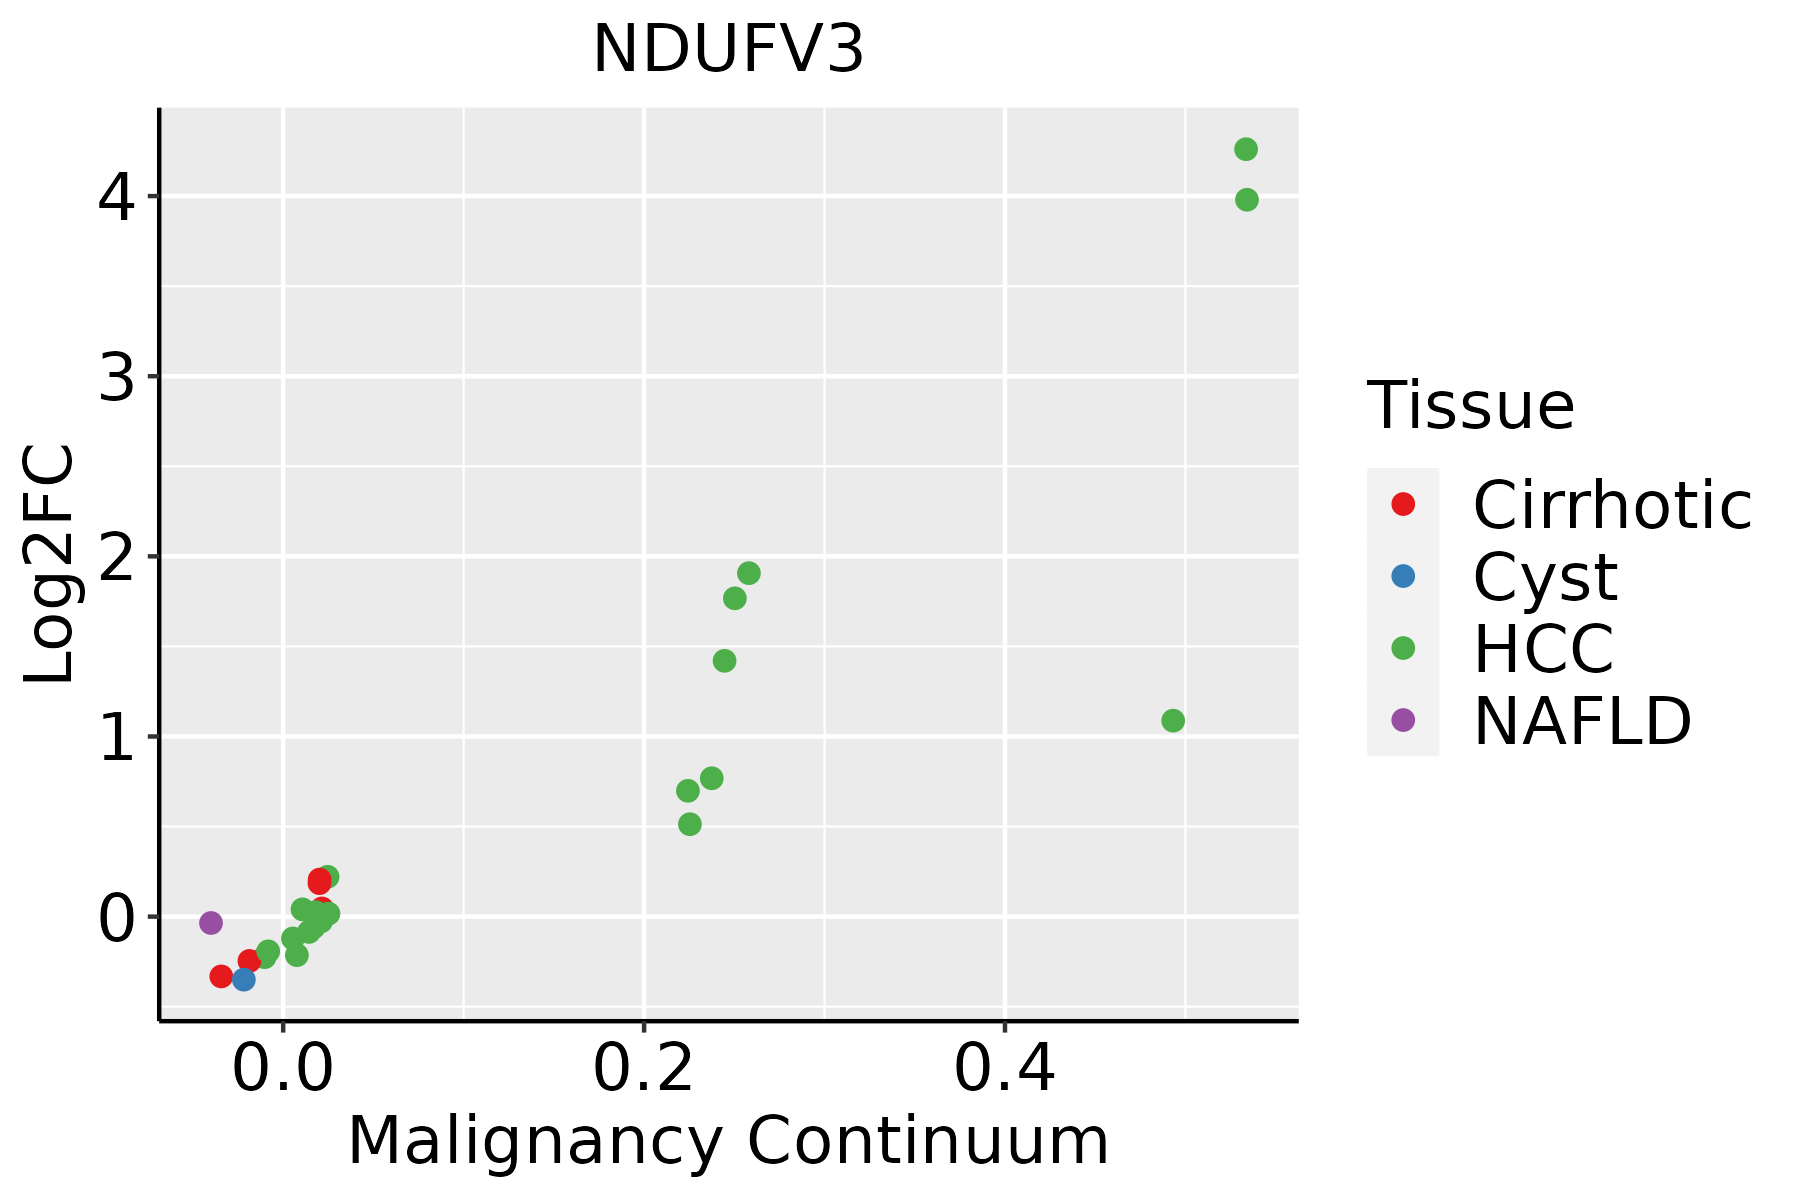 | HCC: Hepatocellular carcinoma |
| NAFLD: Non-alcoholic fatty liver disease | ||
| Oral Cavity | 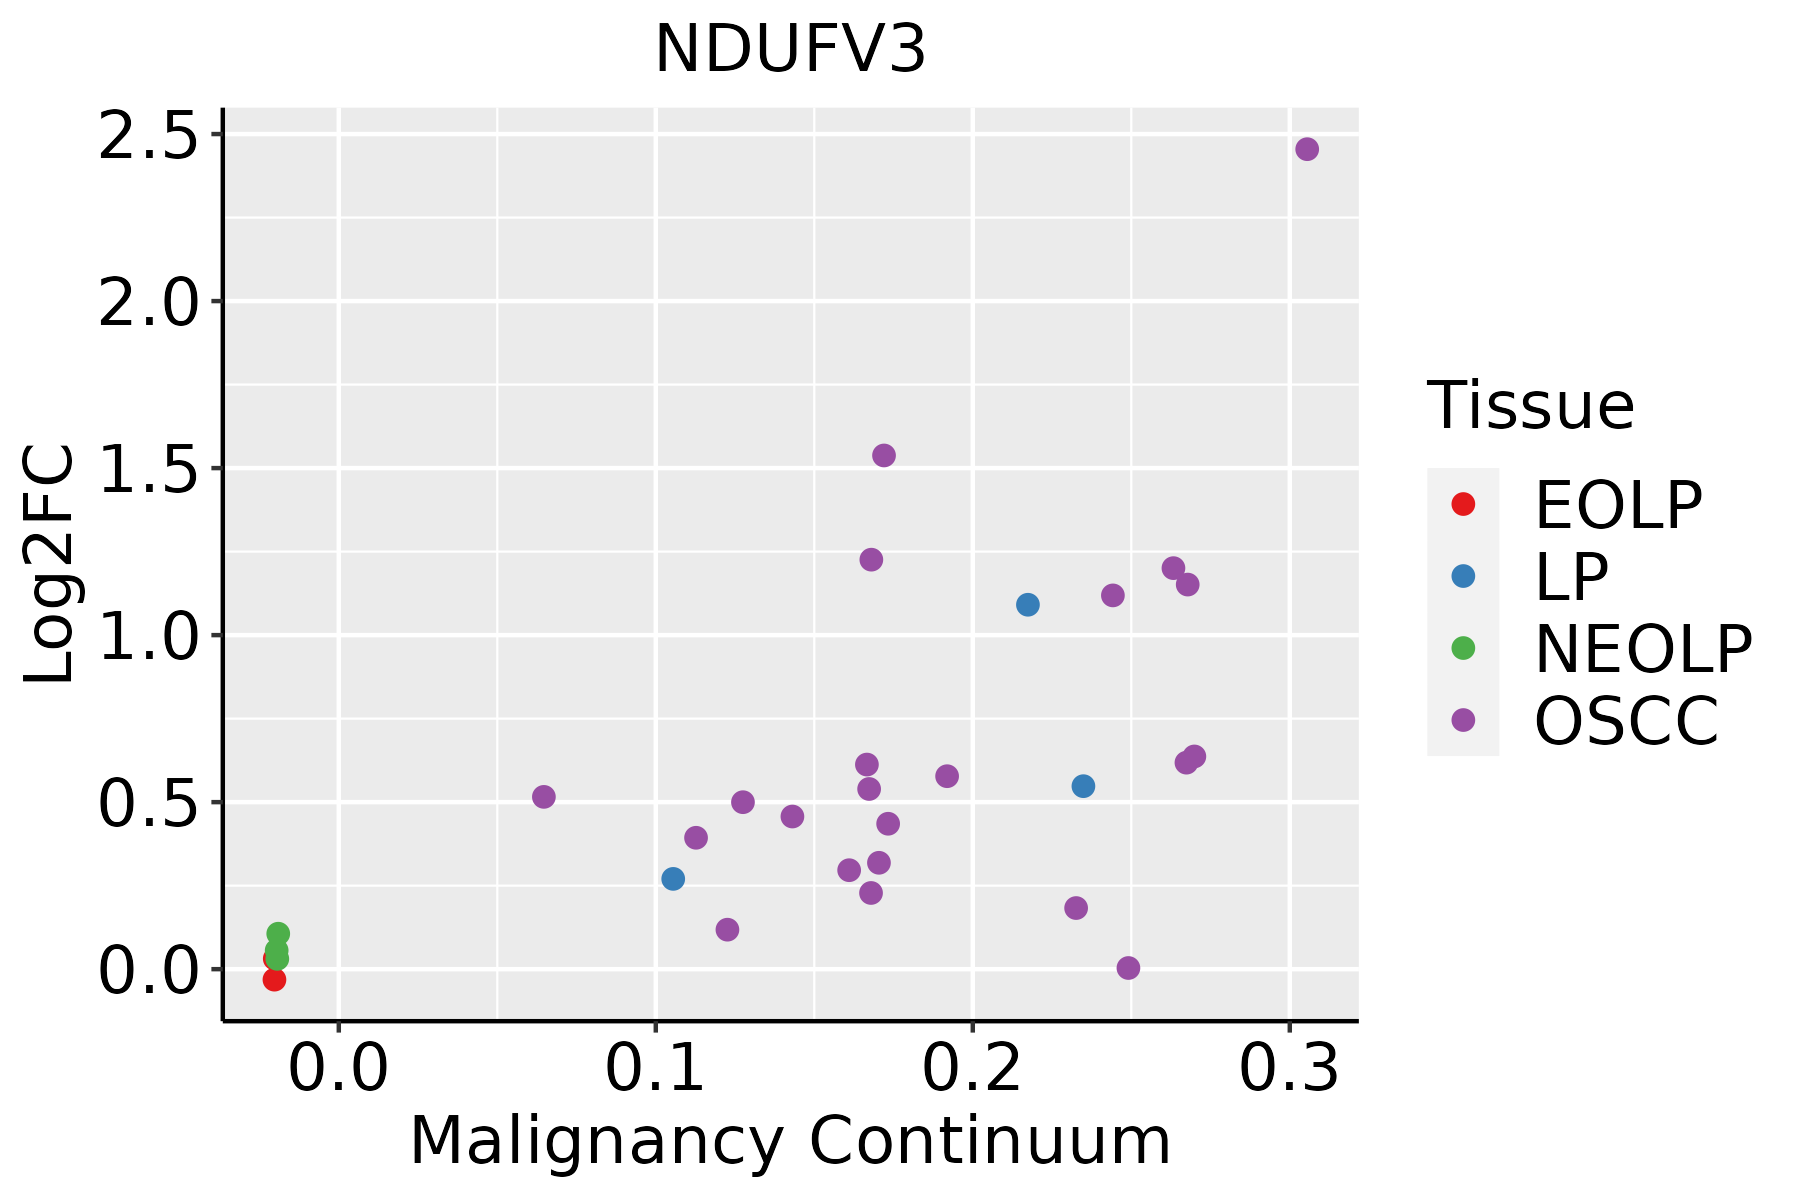 | EOLP: Erosive Oral lichen planus |
| LP: leukoplakia | ||
| NEOLP: Non-erosive oral lichen planus | ||
| OSCC: Oral squamous cell carcinoma | ||
| Prostate | 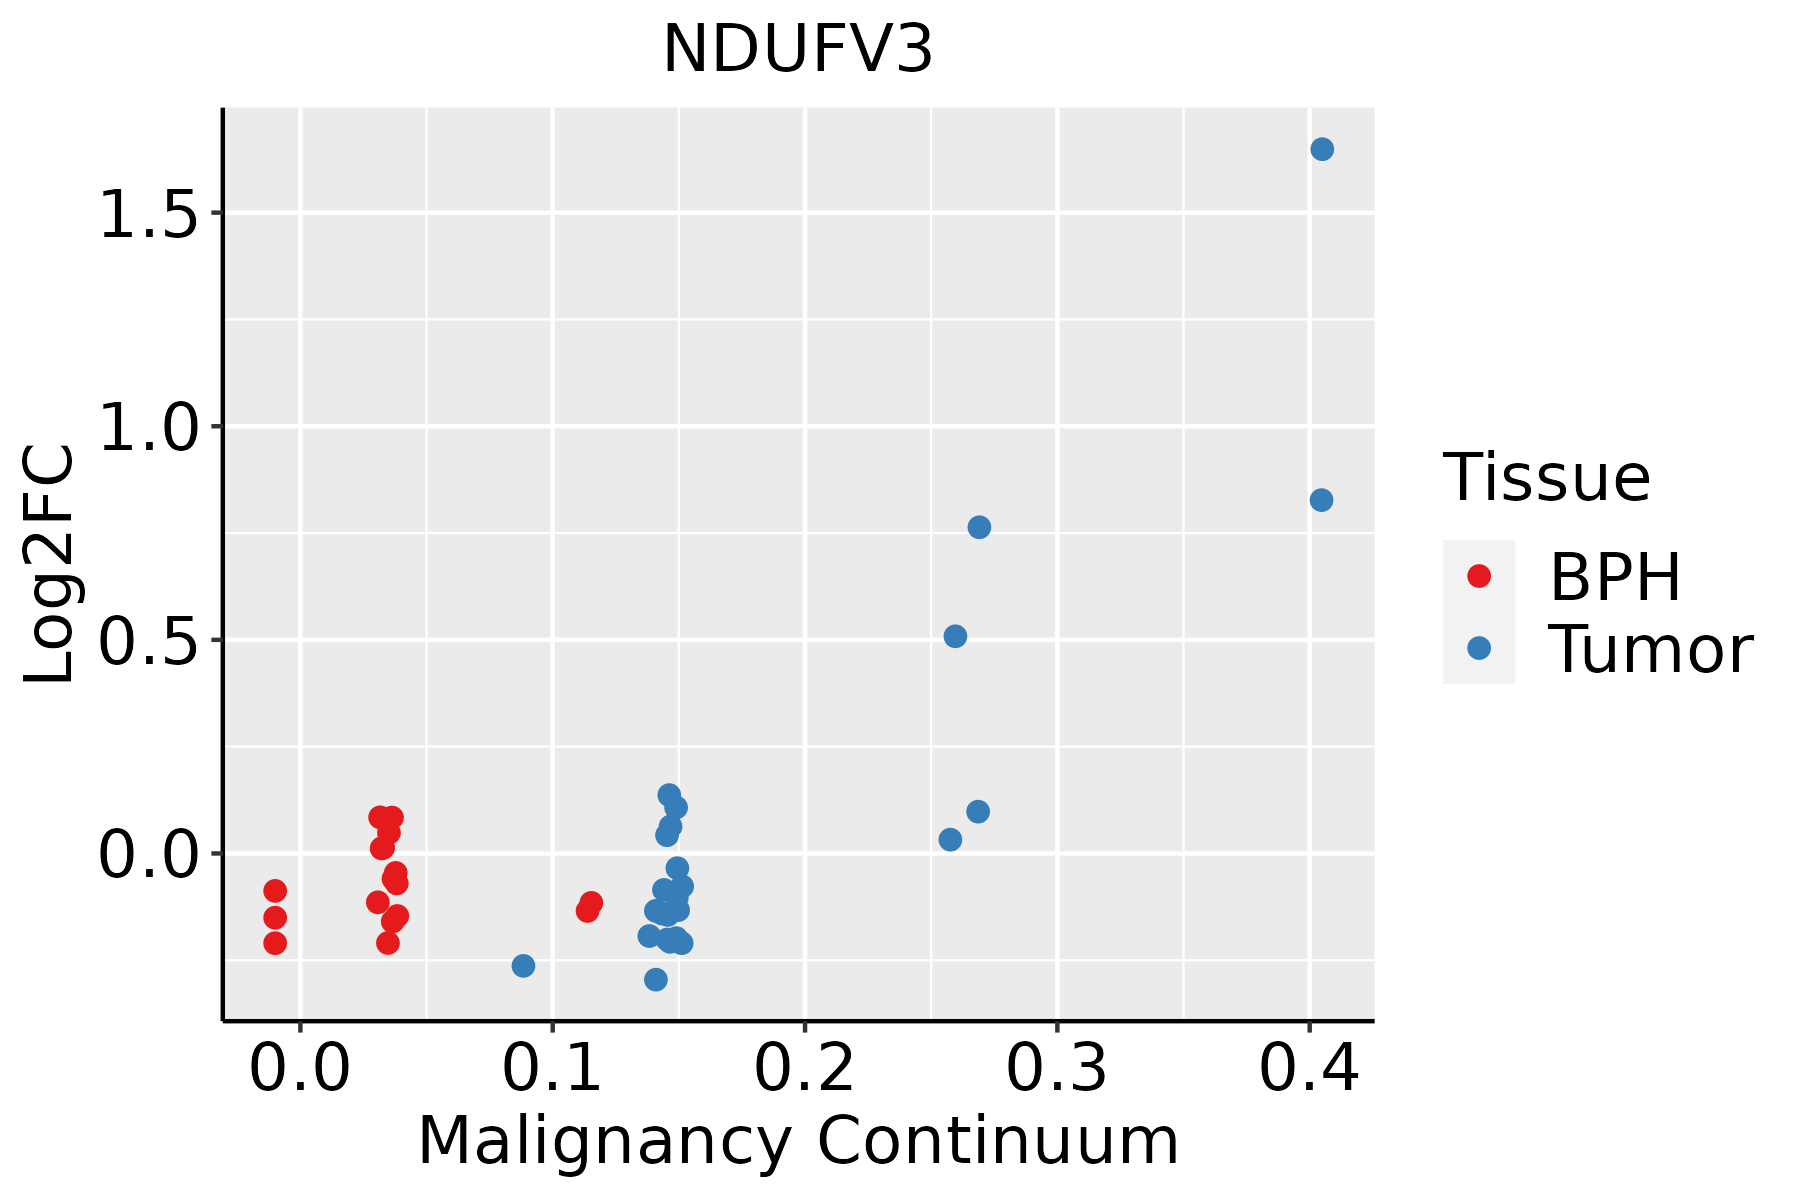 | BPH: Benign Prostatic Hyperplasia |
| Skin | 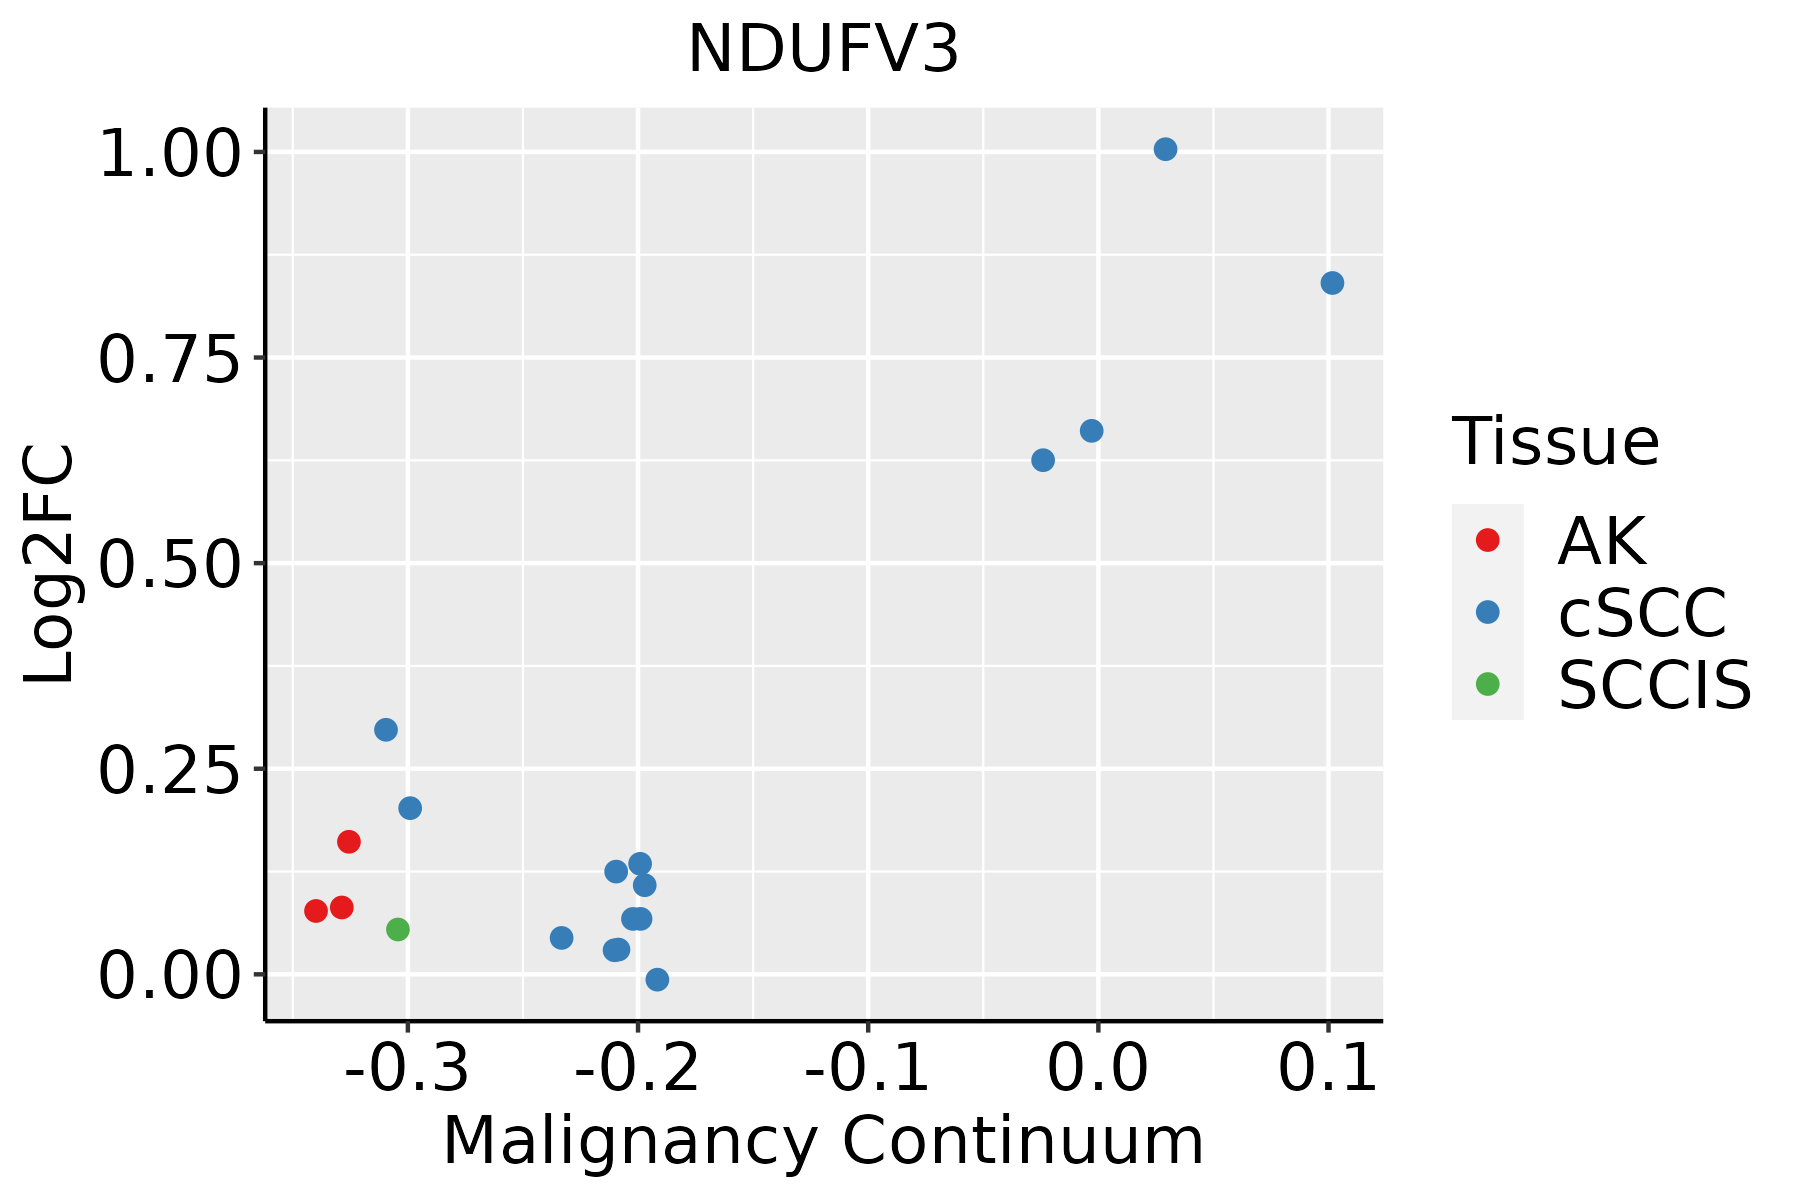 | AK: Actinic keratosis |
| cSCC: Cutaneous squamous cell carcinoma | ||
| SCCIS:squamous cell carcinoma in situ | ||
| Thyroid | 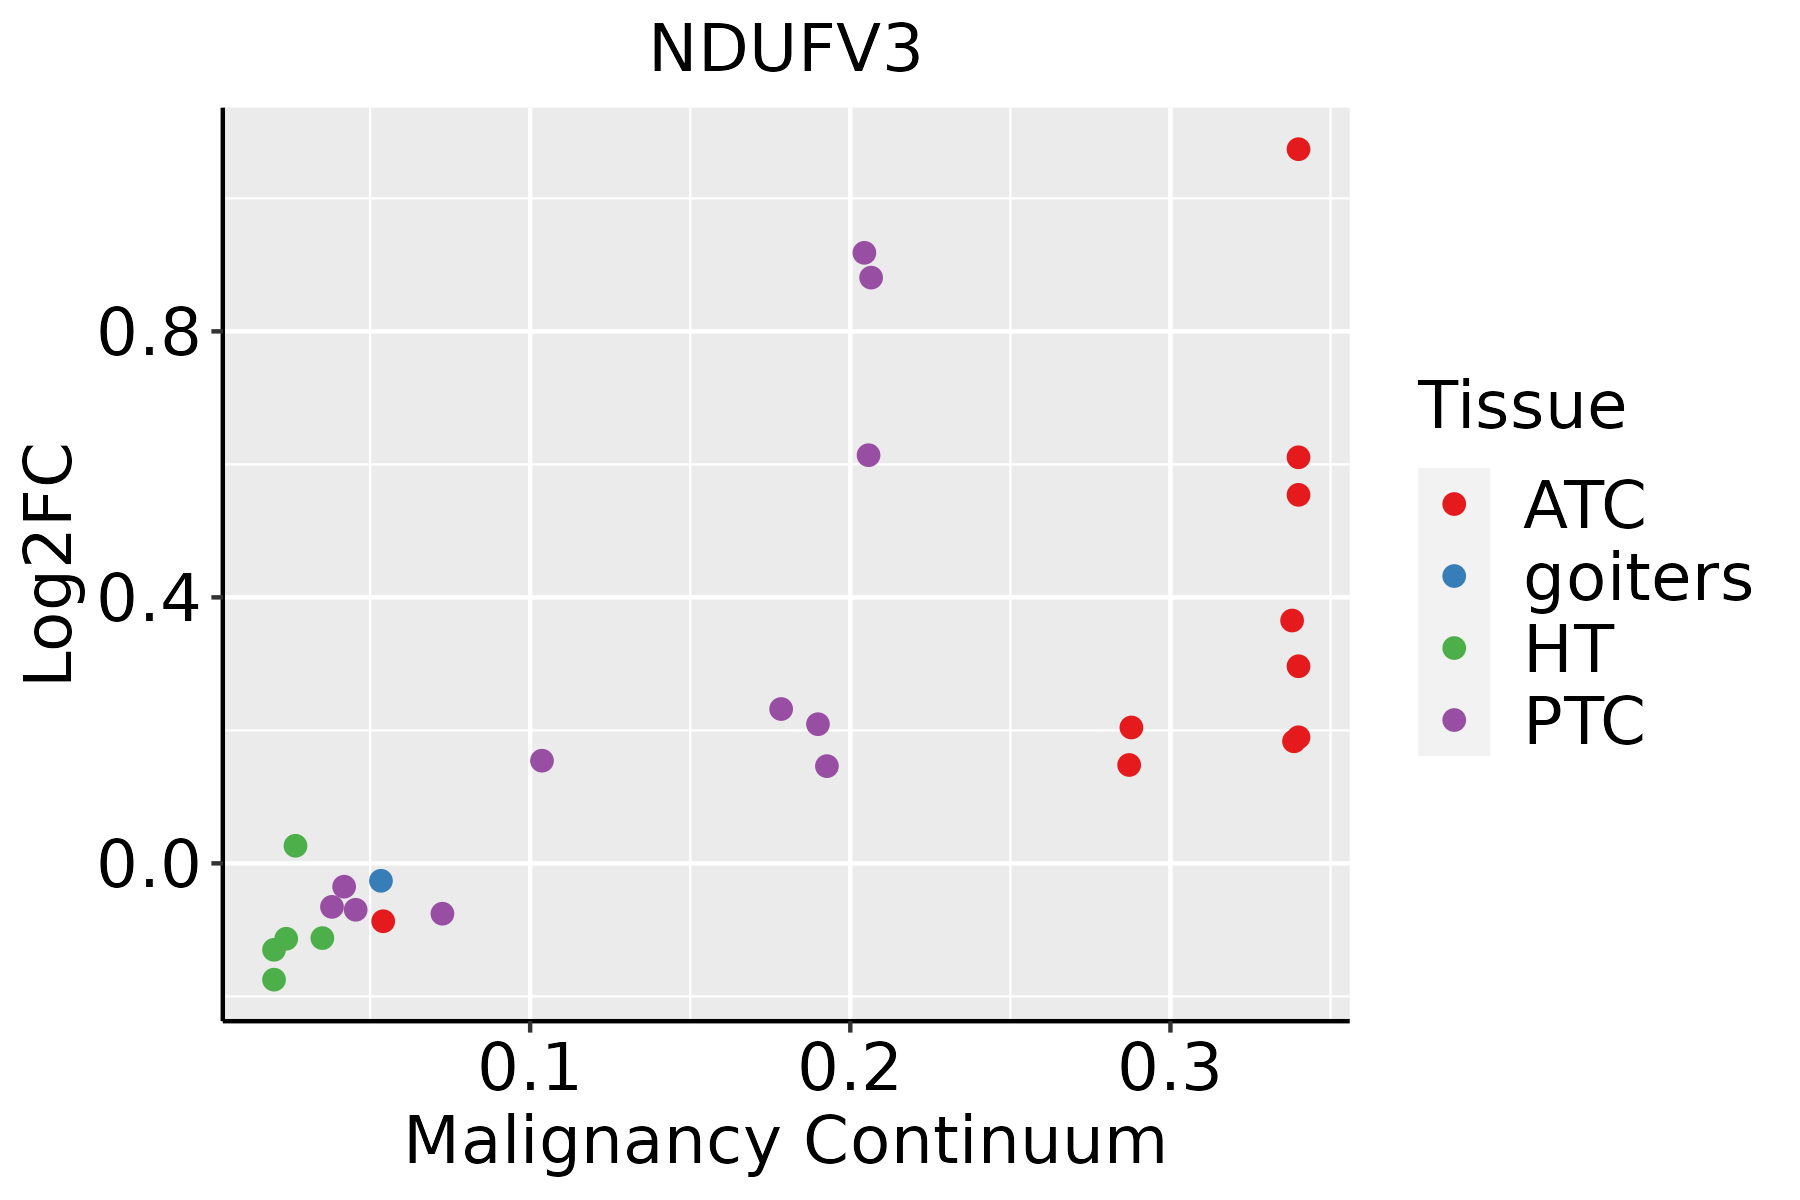 | ATC: Anaplastic thyroid cancer |
| HT: Hashimoto's thyroiditis | ||
| PTC: Papillary thyroid cancer |
| ∗log2FC in expression of this searched gene in stem-like cells from each diseased tissue sample relative to stem-like cells in normal samples in each tissue plotted against the malignancy continuum. Samples are colored based on if they are from different disease stage. |
Top |
Malignant transformation related pathway analysis |
| Find out the enriched GO biological processes and KEGG pathways involved in transition from healthy to precancer to cancer |
| Tissue | Disease Stage | Enriched GO biological Processes |
| Colorectum | AD |  |
| Colorectum | SER |  |
| Colorectum | MSS |  |
| Colorectum | MSI-H |  |
| Colorectum | FAP |  |
| ∗Top 15 enriched GO BP terms are showed in the bar plot of each disease state in each tissue. Each row represents a significant GO biological process which is colored according to the -log10(p.adjust). |
| Page: 1 2 3 4 5 6 7 8 9 |
| GO ID | Tissue | Disease Stage | Description | Gene Ratio | Bg Ratio | pvalue | p.adjust | Count |
| GO:004277513 | Breast | IDC | mitochondrial ATP synthesis coupled electron transport | 38/1434 | 95/18723 | 1.65e-18 | 9.36e-16 | 38 |
| GO:00460349 | Breast | Precancer | ATP metabolic process | 82/1080 | 277/18723 | 1.94e-36 | 5.19e-33 | 82 |
| GO:00061199 | Breast | Precancer | oxidative phosphorylation | 53/1080 | 141/18723 | 1.15e-29 | 2.04e-26 | 53 |
| GO:00090608 | Breast | Precancer | aerobic respiration | 58/1080 | 189/18723 | 5.69e-27 | 7.62e-24 | 58 |
| GO:00060918 | Breast | Precancer | generation of precursor metabolites and energy | 94/1080 | 490/18723 | 1.54e-25 | 1.64e-22 | 94 |
| GO:00453338 | Breast | Precancer | cellular respiration | 59/1080 | 230/18723 | 5.97e-23 | 5.32e-20 | 59 |
| GO:00159808 | Breast | Precancer | energy derivation by oxidation of organic compounds | 70/1080 | 318/18723 | 8.33e-23 | 6.37e-20 | 70 |
| GO:00196468 | Breast | Precancer | aerobic electron transport chain | 34/1080 | 87/18723 | 3.95e-20 | 2.64e-17 | 34 |
| GO:00427738 | Breast | Precancer | ATP synthesis coupled electron transport | 35/1080 | 95/18723 | 1.08e-19 | 5.76e-17 | 35 |
| GO:00427758 | Breast | Precancer | mitochondrial ATP synthesis coupled electron transport | 35/1080 | 95/18723 | 1.08e-19 | 5.76e-17 | 35 |
| GO:00229048 | Breast | Precancer | respiratory electron transport chain | 35/1080 | 114/18723 | 8.51e-17 | 3.26e-14 | 35 |
| GO:00229008 | Breast | Precancer | electron transport chain | 42/1080 | 175/18723 | 1.37e-15 | 4.59e-13 | 42 |
| GO:00061208 | Breast | Precancer | mitochondrial electron transport, NADH to ubiquinone | 19/1080 | 51/18723 | 2.05e-11 | 2.49e-09 | 19 |
| GO:004603414 | Breast | IDC | ATP metabolic process | 85/1434 | 277/18723 | 6.42e-30 | 1.82e-26 | 85 |
| GO:000611913 | Breast | IDC | oxidative phosphorylation | 56/1434 | 141/18723 | 1.87e-26 | 3.53e-23 | 56 |
| GO:000906013 | Breast | IDC | aerobic respiration | 61/1434 | 189/18723 | 4.42e-23 | 6.27e-20 | 61 |
| GO:000609113 | Breast | IDC | generation of precursor metabolites and energy | 103/1434 | 490/18723 | 1.53e-21 | 1.74e-18 | 103 |
| GO:004533313 | Breast | IDC | cellular respiration | 62/1434 | 230/18723 | 5.98e-19 | 4.25e-16 | 62 |
| GO:004277313 | Breast | IDC | ATP synthesis coupled electron transport | 38/1434 | 95/18723 | 1.65e-18 | 9.36e-16 | 38 |
| GO:004277323 | Breast | DCIS | ATP synthesis coupled electron transport | 38/1390 | 95/18723 | 5.72e-19 | 3.59e-16 | 38 |
| Page: 1 2 3 4 5 6 7 8 9 10 11 |
| Pathway ID | Tissue | Disease Stage | Description | Gene Ratio | Bg Ratio | pvalue | p.adjust | qvalue | Count |
| hsa0019017 | Breast | Precancer | Oxidative phosphorylation | 59/684 | 134/8465 | 6.15e-30 | 3.24e-28 | 2.48e-28 | 59 |
| hsa0501218 | Breast | Precancer | Parkinson disease | 99/684 | 266/8465 | 3.58e-42 | 5.65e-40 | 4.33e-40 | 99 |
| hsa0502016 | Breast | Precancer | Prion disease | 95/684 | 273/8465 | 1.39e-37 | 1.46e-35 | 1.12e-35 | 95 |
| hsa0541518 | Breast | Precancer | Diabetic cardiomyopathy | 63/684 | 203/8465 | 5.63e-22 | 1.48e-20 | 1.14e-20 | 63 |
| hsa0493216 | Breast | Precancer | Non-alcoholic fatty liver disease | 48/684 | 155/8465 | 6.16e-17 | 1.50e-15 | 1.15e-15 | 48 |
| hsa0501616 | Breast | Precancer | Huntington disease | 98/684 | 306/8465 | 2.85e-35 | 2.25e-33 | 1.72e-33 | 98 |
| hsa0502216 | Breast | Precancer | Pathways of neurodegeneration - multiple diseases | 112/684 | 476/8465 | 6.96e-27 | 2.44e-25 | 1.87e-25 | 112 |
| hsa0471418 | Breast | Precancer | Thermogenesis | 68/684 | 232/8465 | 4.40e-22 | 1.26e-20 | 9.69e-21 | 68 |
| hsa0501617 | Breast | Precancer | Huntington disease | 98/684 | 306/8465 | 2.85e-35 | 2.25e-33 | 1.72e-33 | 98 |
| hsa0502217 | Breast | Precancer | Pathways of neurodegeneration - multiple diseases | 112/684 | 476/8465 | 6.96e-27 | 2.44e-25 | 1.87e-25 | 112 |
| hsa0501016 | Breast | Precancer | Alzheimer disease | 103/684 | 384/8465 | 1.03e-29 | 4.66e-28 | 3.57e-28 | 103 |
| hsa0019016 | Breast | Precancer | Oxidative phosphorylation | 59/684 | 134/8465 | 6.15e-30 | 3.24e-28 | 2.48e-28 | 59 |
| hsa0501219 | Breast | Precancer | Parkinson disease | 99/684 | 266/8465 | 3.58e-42 | 5.65e-40 | 4.33e-40 | 99 |
| hsa0502017 | Breast | Precancer | Prion disease | 95/684 | 273/8465 | 1.39e-37 | 1.46e-35 | 1.12e-35 | 95 |
| hsa0501416 | Breast | Precancer | Amyotrophic lateral sclerosis | 98/684 | 364/8465 | 2.13e-28 | 8.41e-27 | 6.44e-27 | 98 |
| hsa0501417 | Breast | Precancer | Amyotrophic lateral sclerosis | 98/684 | 364/8465 | 2.13e-28 | 8.41e-27 | 6.44e-27 | 98 |
| hsa0520819 | Breast | Precancer | Chemical carcinogenesis - reactive oxygen species | 68/684 | 223/8465 | 3.61e-23 | 1.14e-21 | 8.73e-22 | 68 |
| hsa0520818 | Breast | Precancer | Chemical carcinogenesis - reactive oxygen species | 68/684 | 223/8465 | 3.61e-23 | 1.14e-21 | 8.73e-22 | 68 |
| hsa0472316 | Breast | Precancer | Retrograde endocannabinoid signaling | 25/684 | 148/8465 | 3.05e-04 | 2.47e-03 | 1.89e-03 | 25 |
| hsa0501017 | Breast | Precancer | Alzheimer disease | 103/684 | 384/8465 | 1.03e-29 | 4.66e-28 | 3.57e-28 | 103 |
| Page: 1 2 3 4 5 6 7 8 9 10 11 12 13 14 15 16 |
Top |
Cell-cell communication analysis |
| Identification of potential cell-cell interactions between two cell types and their ligand-receptor pairs for different disease states |
| Ligand | Receptor | LRpair | Pathway | Tissue | Disease Stage |
| Page: 1 |
Top |
Single-cell gene regulatory network inference analysis |
| Find out the significant the regulons (TFs) and the target genes of each regulon across cell types for different disease states |
| TF | Cell Type | Tissue | Disease Stage | Target Gene | RSS | Regulon Activity |
| ∗The dot plots of a searched regulon are shown for all cell subpopulations in each disease state of each tissue based on the regulon specific score inferred using pySCENIC and by calculating the average expression. |
| Page: 1 |
Top |
Somatic mutation of malignant transformation related genes |
| Annotation of somatic variants for genes involved in malignant transformation |
| Hugo Symbol | Variant Class | Variant Classification | dbSNP RS | HGVSc | HGVSp | HGVSp Short | SWISSPROT | BIOTYPE | SIFT | PolyPhen | Tumor Sample Barcode | Tissue | Histology | Sex | Age | Stage | Therapy Types | Drugs | Outcome |
| NDUFV3 | SNV | Missense_Mutation | rs775969714 | c.731N>A | p.Arg244Lys | p.R244K | P56181 | protein_coding | tolerated(1) | benign(0.006) | TCGA-BH-A0HB-01 | Breast | breast invasive carcinoma | Female | <65 | I/II | Chemotherapy | docetaxel | SD |
| NDUFV3 | SNV | Missense_Mutation | c.758A>G | p.Gln253Arg | p.Q253R | P56181 | protein_coding | tolerated(0.16) | benign(0.221) | TCGA-D8-A1XK-01 | Breast | breast invasive carcinoma | Female | <65 | I/II | Chemotherapy | doxorubicine+cyclophosphamide | SD | |
| NDUFV3 | SNV | Missense_Mutation | c.481N>A | p.Asp161Asn | p.D161N | P56181 | protein_coding | deleterious(0.03) | probably_damaging(0.996) | TCGA-E9-A243-01 | Breast | breast invasive carcinoma | Female | <65 | I/II | Chemotherapy | 5-fluorouracil | PD | |
| NDUFV3 | SNV | Missense_Mutation | c.1114N>A | p.Glu372Lys | p.E372K | P56181 | protein_coding | deleterious(0.01) | probably_damaging(0.952) | TCGA-AA-3492-01 | Colorectum | colon adenocarcinoma | Female | >=65 | I/II | Unknown | Unknown | SD | |
| NDUFV3 | SNV | Missense_Mutation | c.533N>A | p.Val178Glu | p.V178E | P56181 | protein_coding | tolerated(0.15) | benign(0.283) | TCGA-AD-6889-01 | Colorectum | colon adenocarcinoma | Male | >=65 | I/II | Chemotherapy | xeloda | PD | |
| NDUFV3 | SNV | Missense_Mutation | rs373783778 | c.599N>A | p.Arg200Gln | p.R200Q | P56181 | protein_coding | tolerated(0.41) | benign(0) | TCGA-AZ-4315-01 | Colorectum | colon adenocarcinoma | Male | <65 | I/II | Unknown | Unknown | SD |
| NDUFV3 | SNV | Missense_Mutation | novel | c.383N>G | p.Val128Gly | p.V128G | P56181 | protein_coding | deleterious(0) | possibly_damaging(0.881) | TCGA-CA-6717-01 | Colorectum | colon adenocarcinoma | Male | <65 | I/II | Chemotherapy | oxaliplatin | CR |
| NDUFV3 | SNV | Missense_Mutation | rs373783778 | c.599N>A | p.Arg200Gln | p.R200Q | P56181 | protein_coding | tolerated(0.41) | benign(0) | TCGA-F4-6463-01 | Colorectum | colon adenocarcinoma | Male | <65 | I/II | Unknown | Unknown | SD |
| NDUFV3 | SNV | Missense_Mutation | novel | c.810A>C | p.Lys270Asn | p.K270N | P56181 | protein_coding | tolerated(0.2) | benign(0.022) | TCGA-F5-6814-01 | Colorectum | rectum adenocarcinoma | Male | <65 | I/II | Unknown | Unknown | SD |
| NDUFV3 | SNV | Missense_Mutation | c.476N>A | p.Ser159Tyr | p.S159Y | P56181 | protein_coding | deleterious(0) | probably_damaging(0.997) | TCGA-A5-A0G1-01 | Endometrium | uterine corpus endometrioid carcinoma | Female | >=65 | I/II | Unknown | Unknown | SD |
| Page: 1 2 3 4 |
Top |
Related drugs of malignant transformation related genes |
| Identification of chemicals and drugs interact with genes involved in malignant transfromation |
| (DGIdb 4.0) |
| Entrez ID | Symbol | Category | Interaction Types | Drug Claim Name | Drug Name | PMIDs |
| 4731 | NDUFV3 | ENZYME | inhibitor | CHEMBL1703 | METFORMIN HYDROCHLORIDE | |
| 4731 | NDUFV3 | ENZYME | inhibitor | CHEMBL3545135 | NV-128 | |
| 4731 | NDUFV3 | ENZYME | inhibitor | CHEMBL3545320 | ME-344 |
| Page: 1 |

Copyright 2023-Present -The University of Texas Health Science Center at Houston |