
|
|||||
|
 | |
| |
| |
| |
| |
| |
|
Gene: NAP1L4 |
Gene summary for NAP1L4 |
| Gene information | Species | Human | Gene symbol | NAP1L4 | Gene ID | 4676 |
| Gene name | nucleosome assembly protein 1 like 4 | |
| Gene Alias | NAP1L4b | |
| Cytomap | 11p15.4 | |
| Gene Type | protein-coding | GO ID | GO:0006323 | UniProtAcc | A0A024RCC9 |
Top |
Malignant transformation analysis |
| Identification of the aberrant gene expression in precancerous and cancerous lesions by comparing the gene expression of stem-like cells in diseased tissues with normal stem cells |
| Entrez ID | Symbol | Replicates | Species | Organ | Tissue | Adj P-value | Log2FC | Malignancy |
| 4676 | NAP1L4 | LN46 | Human | Oral cavity | OSCC | 8.61e-29 | 1.14e+00 | 0.1666 |
| 4676 | NAP1L4 | LP15 | Human | Oral cavity | LP | 1.09e-09 | 1.46e+00 | 0.2174 |
| 4676 | NAP1L4 | LP17 | Human | Oral cavity | LP | 7.22e-03 | 7.53e-01 | 0.2349 |
| 4676 | NAP1L4 | EOLP-1 | Human | Oral cavity | EOLP | 7.47e-04 | 1.51e-01 | -0.0202 |
| 4676 | NAP1L4 | SYSMH1 | Human | Oral cavity | OSCC | 1.90e-14 | 5.77e-01 | 0.1127 |
| 4676 | NAP1L4 | SYSMH2 | Human | Oral cavity | OSCC | 8.34e-28 | 1.06e+00 | 0.2326 |
| 4676 | NAP1L4 | SYSMH3 | Human | Oral cavity | OSCC | 1.36e-41 | 1.20e+00 | 0.2442 |
| 4676 | NAP1L4 | SYSMH4 | Human | Oral cavity | OSCC | 1.67e-04 | 2.02e-01 | 0.1226 |
| 4676 | NAP1L4 | SYSMH5 | Human | Oral cavity | OSCC | 1.19e-16 | 6.98e-01 | 0.0647 |
| 4676 | NAP1L4 | SYSMH6 | Human | Oral cavity | OSCC | 9.62e-14 | 5.45e-01 | 0.1275 |
| 4676 | NAP1L4 | P1_S1_AK | Human | Skin | AK | 5.77e-12 | 4.60e-01 | -0.3399 |
| 4676 | NAP1L4 | P2_S3_AK | Human | Skin | AK | 1.06e-06 | 3.40e-01 | -0.3287 |
| 4676 | NAP1L4 | P3_S6_AK | Human | Skin | AK | 1.92e-02 | 3.08e-01 | -0.3256 |
| 4676 | NAP1L4 | P4_S8_cSCC | Human | Skin | cSCC | 4.19e-17 | 4.01e-01 | -0.3095 |
| 4676 | NAP1L4 | P5_S10_cSCC | Human | Skin | cSCC | 8.45e-14 | 2.81e-01 | -0.299 |
| 4676 | NAP1L4 | P1_cSCC | Human | Skin | cSCC | 4.77e-38 | 1.29e+00 | 0.0292 |
| 4676 | NAP1L4 | P2_cSCC | Human | Skin | cSCC | 3.19e-19 | 8.01e-01 | -0.024 |
| 4676 | NAP1L4 | P4_cSCC | Human | Skin | cSCC | 1.29e-29 | 9.00e-01 | -0.00290000000000005 |
| 4676 | NAP1L4 | P10_cSCC | Human | Skin | cSCC | 2.80e-38 | 1.21e+00 | 0.1017 |
| 4676 | NAP1L4 | cSCC_p9 | Human | Skin | cSCC | 2.16e-03 | 7.19e-02 | -0.1991 |
| Page: 1 2 3 4 5 6 7 |
| Tissue | Expression Dynamics | Abbreviation |
| Cervix |  | CC: Cervix cancer |
| HSIL_HPV: HPV-infected high-grade squamous intraepithelial lesions | ||
| N_HPV: HPV-infected normal cervix | ||
| Esophagus | 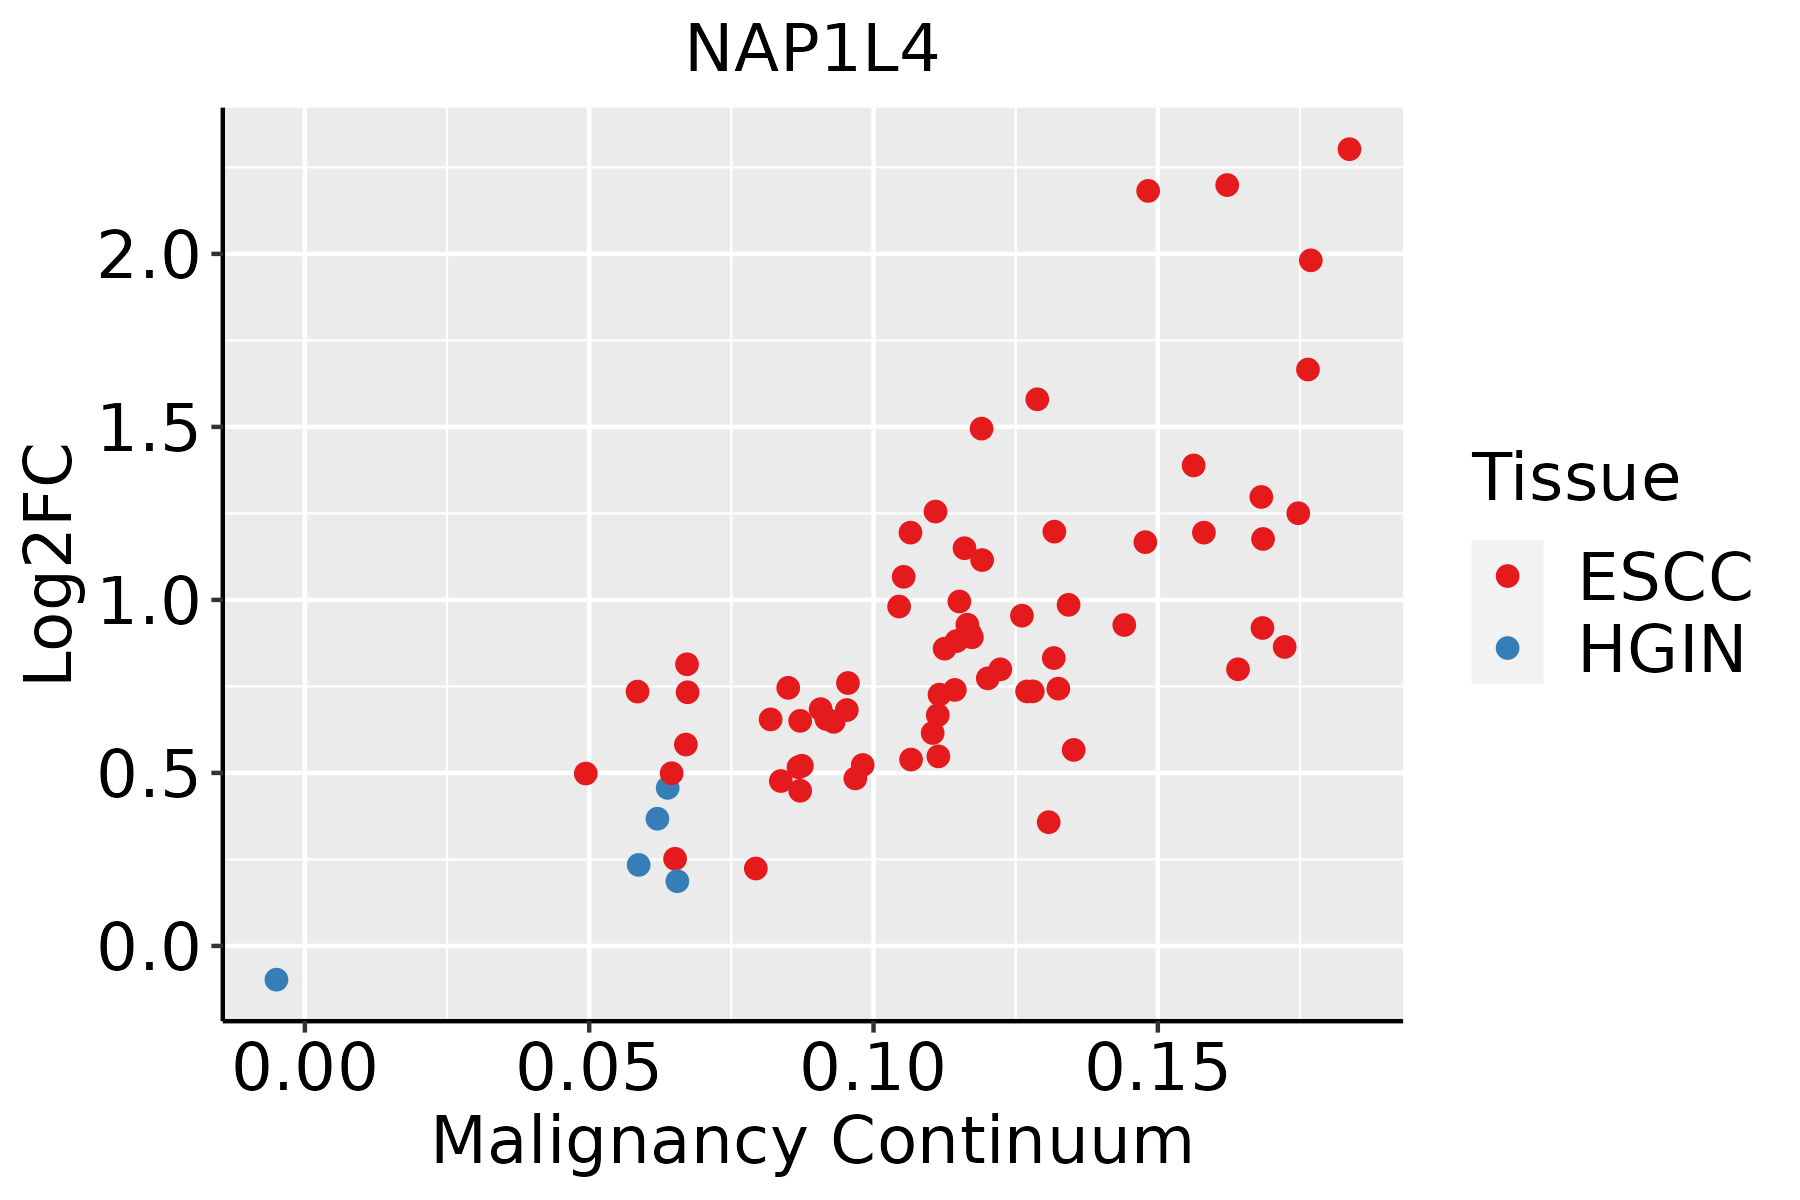 | ESCC: Esophageal squamous cell carcinoma |
| HGIN: High-grade intraepithelial neoplasias | ||
| LGIN: Low-grade intraepithelial neoplasias | ||
| Liver | 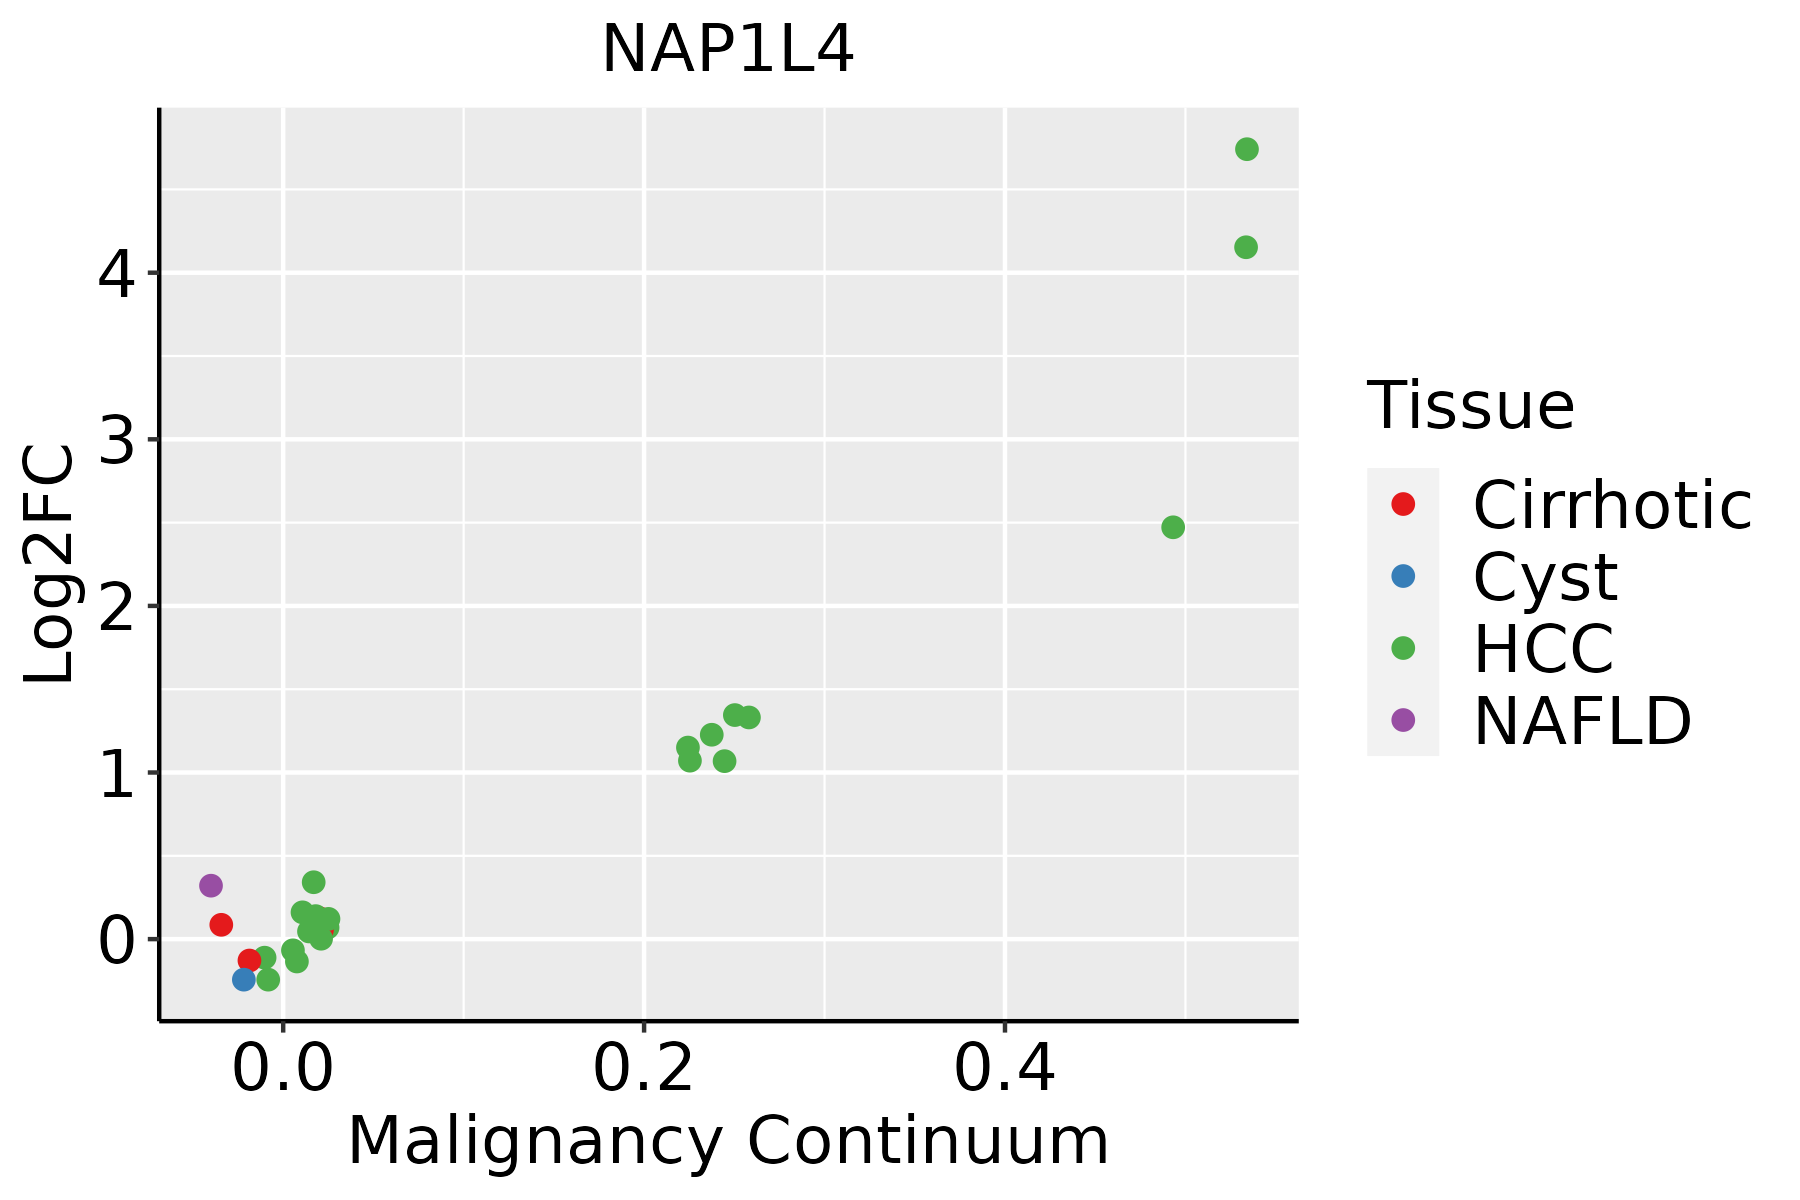 | HCC: Hepatocellular carcinoma |
| NAFLD: Non-alcoholic fatty liver disease | ||
| Oral Cavity |  | EOLP: Erosive Oral lichen planus |
| LP: leukoplakia | ||
| NEOLP: Non-erosive oral lichen planus | ||
| OSCC: Oral squamous cell carcinoma | ||
| Prostate | 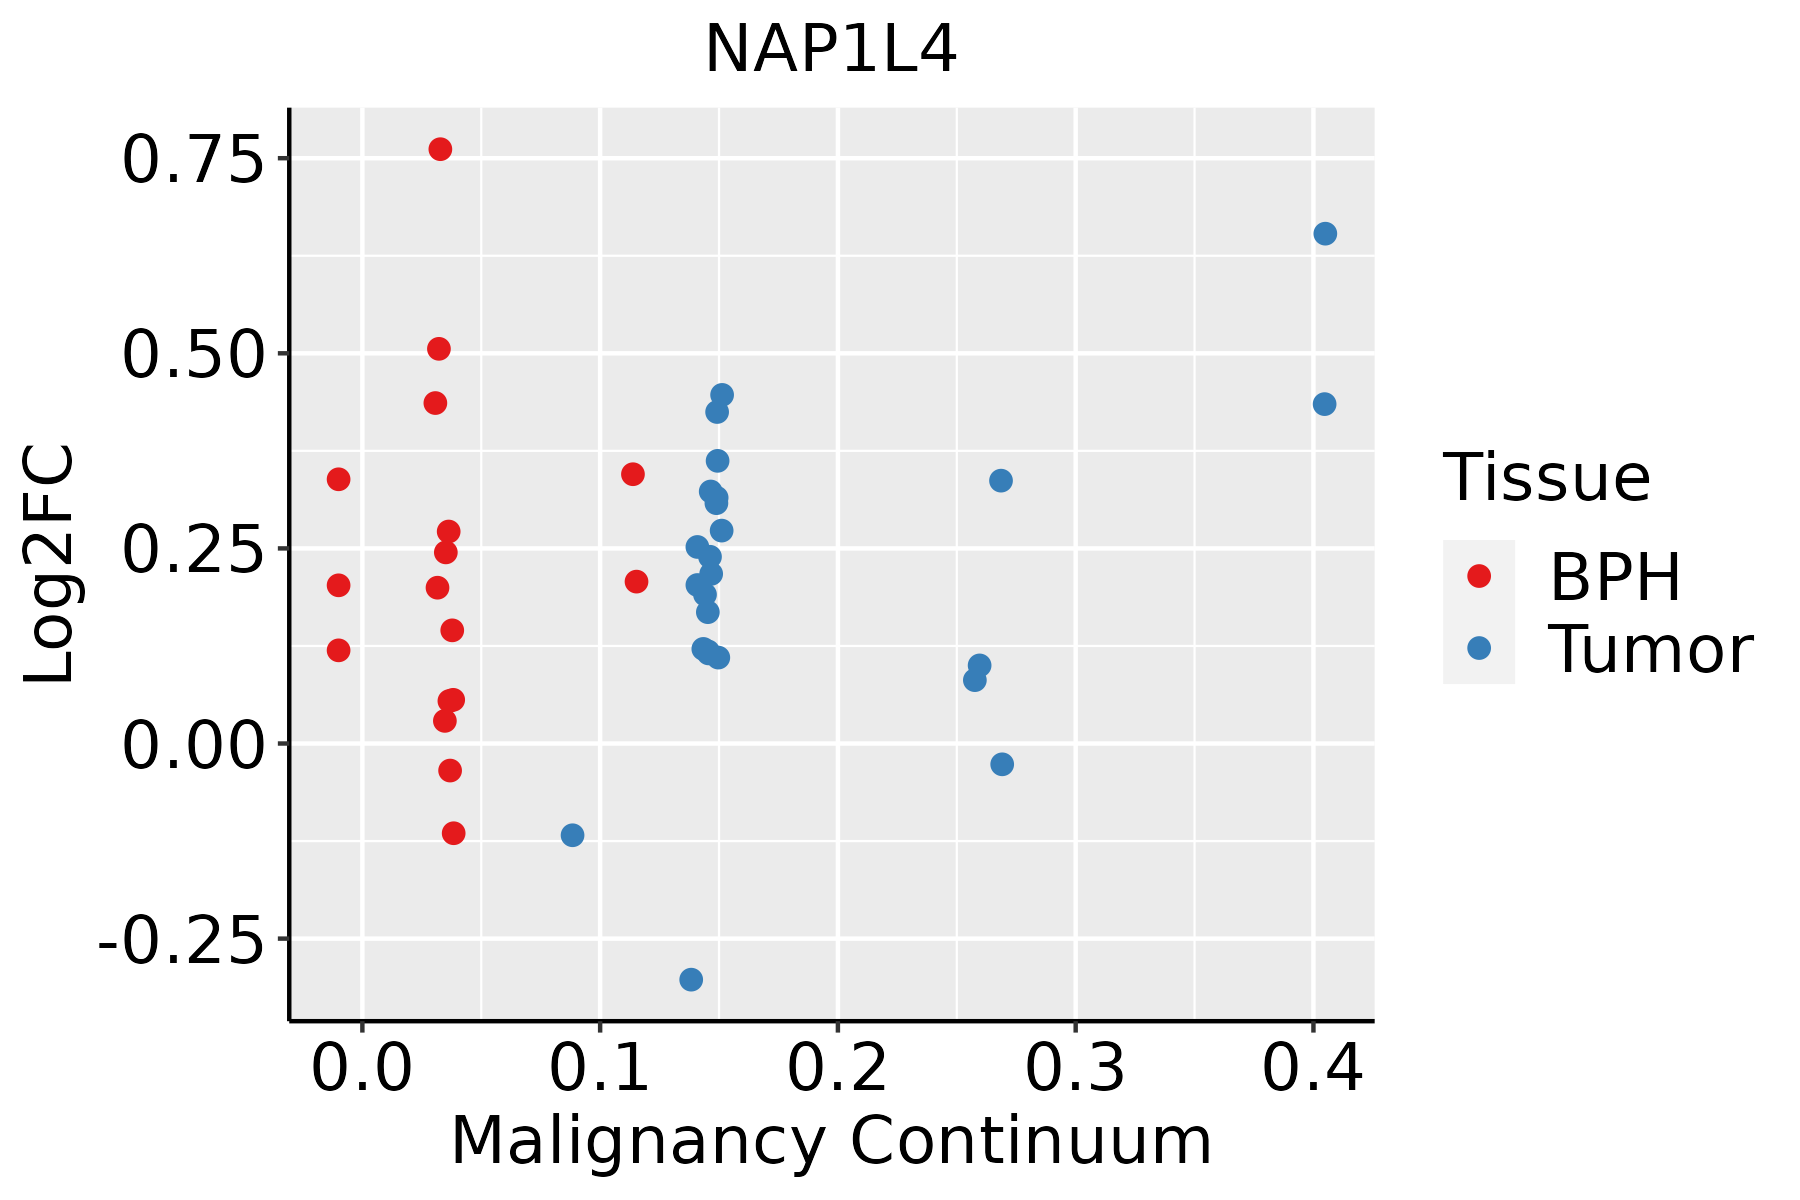 | BPH: Benign Prostatic Hyperplasia |
| Skin | 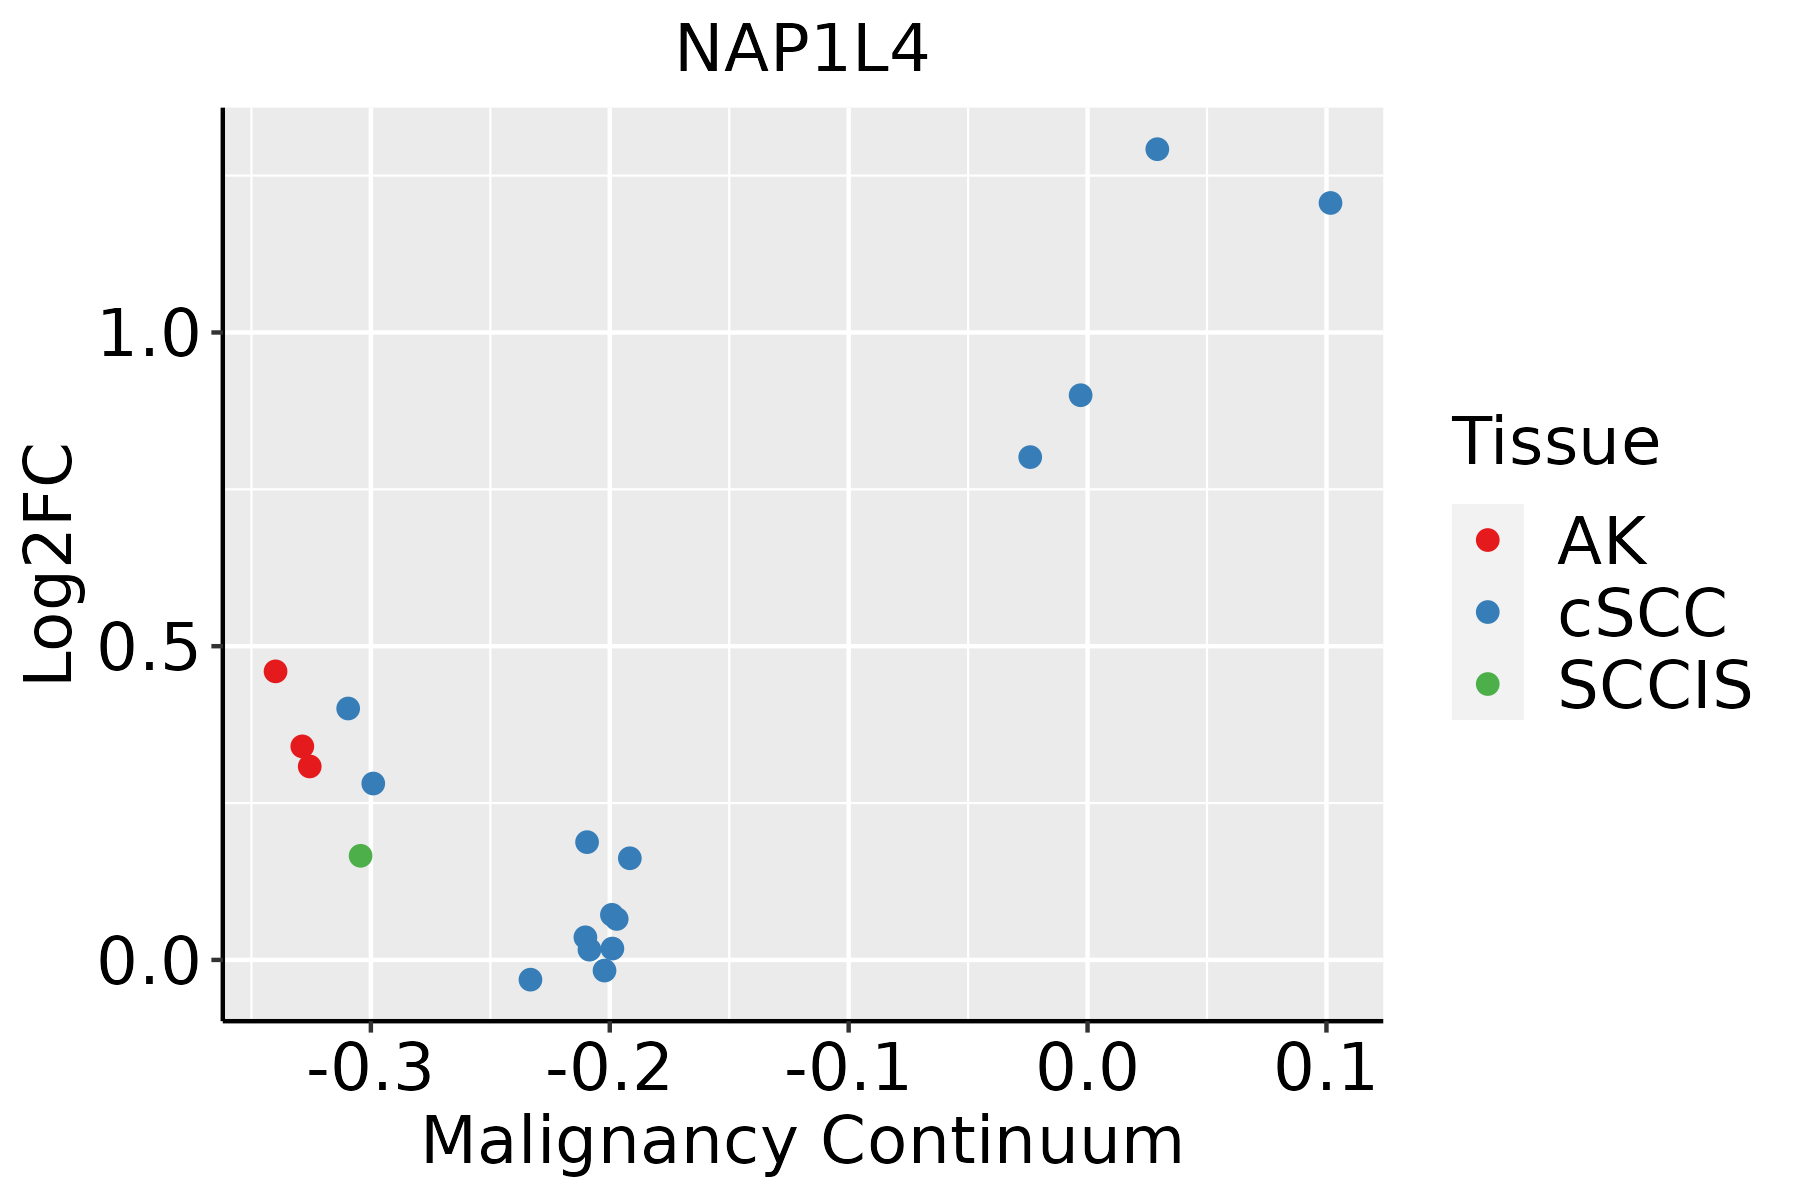 | AK: Actinic keratosis |
| cSCC: Cutaneous squamous cell carcinoma | ||
| SCCIS:squamous cell carcinoma in situ | ||
| Thyroid | 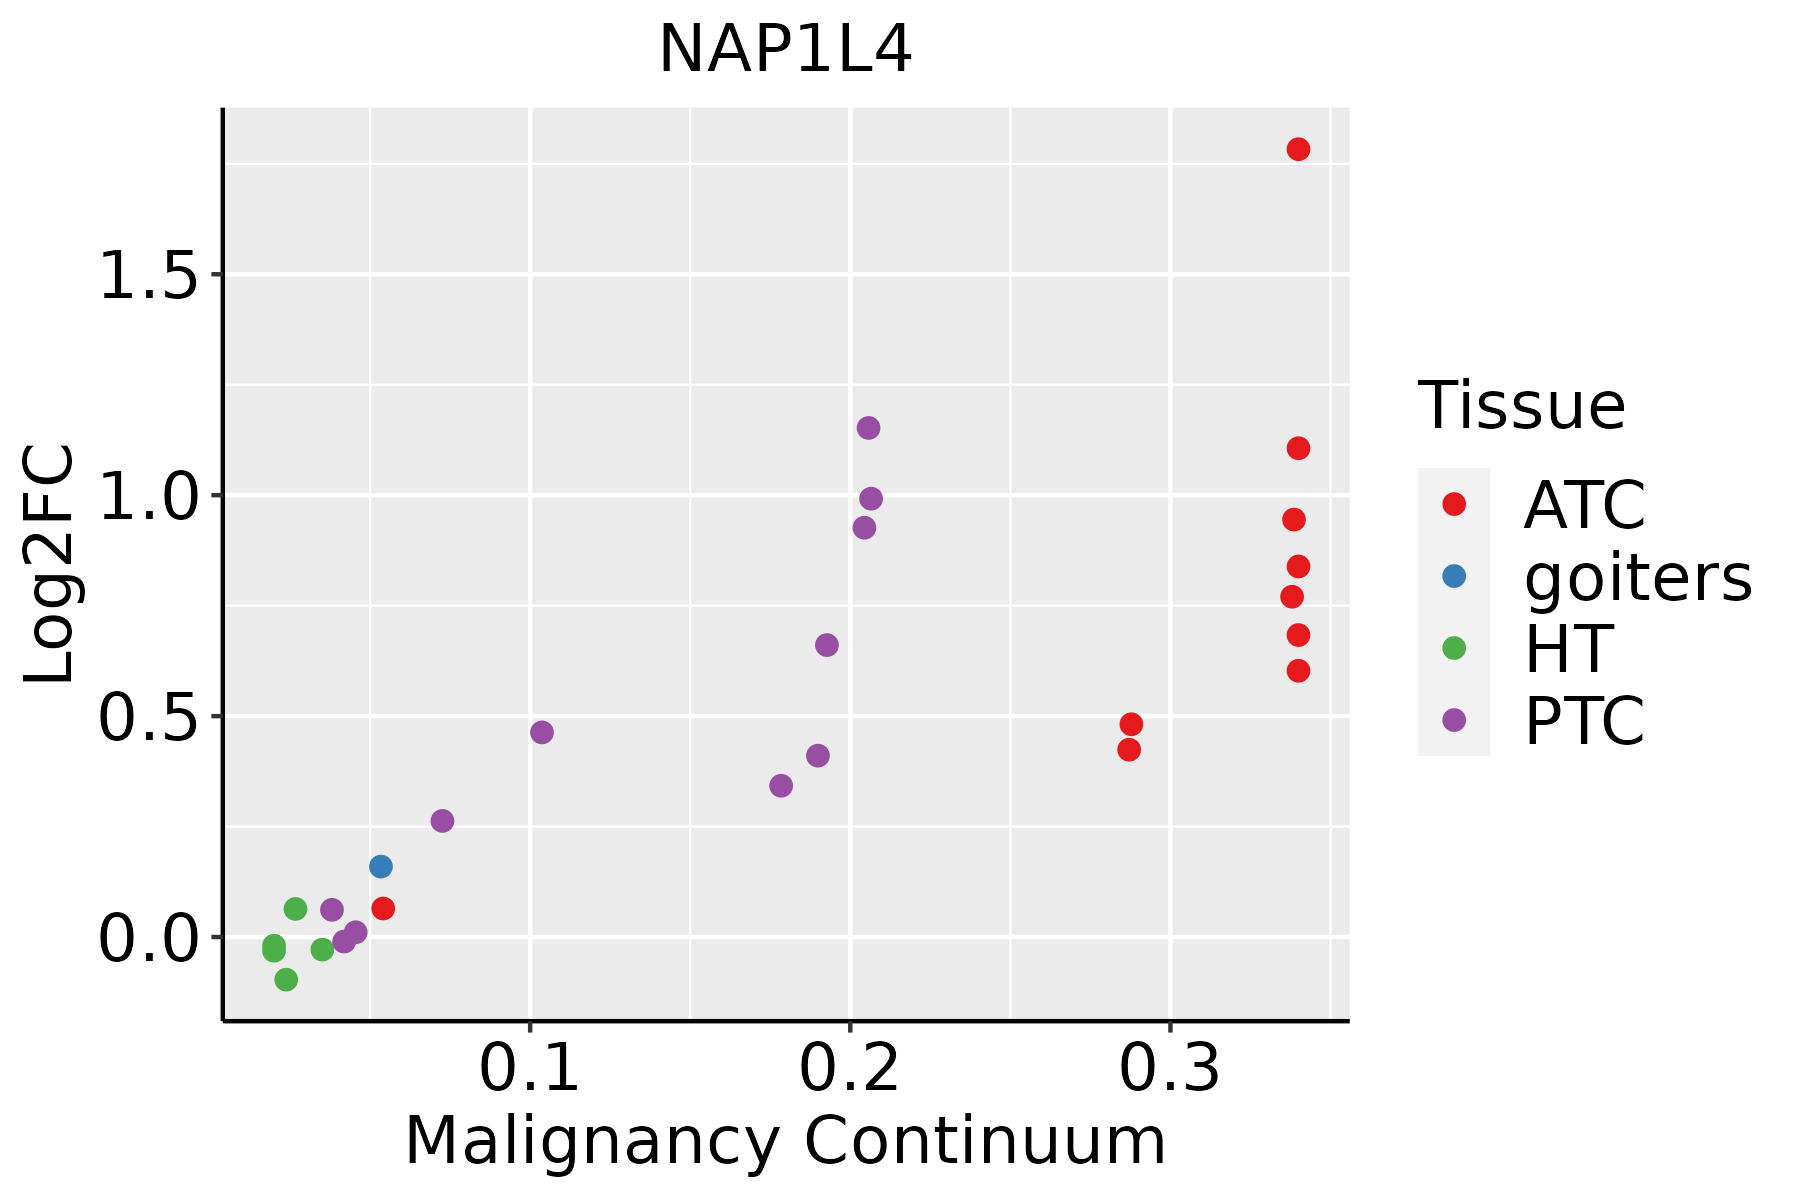 | ATC: Anaplastic thyroid cancer |
| HT: Hashimoto's thyroiditis | ||
| PTC: Papillary thyroid cancer |
| ∗log2FC in expression of this searched gene in stem-like cells from each diseased tissue sample relative to stem-like cells in normal samples in each tissue plotted against the malignancy continuum. Samples are colored based on if they are from different disease stage. |
Top |
Malignant transformation related pathway analysis |
| Find out the enriched GO biological processes and KEGG pathways involved in transition from healthy to precancer to cancer |
| Tissue | Disease Stage | Enriched GO biological Processes |
| Colorectum | AD |  |
| Colorectum | SER |  |
| Colorectum | MSS |  |
| Colorectum | MSI-H |  |
| Colorectum | FAP |  |
| ∗Top 15 enriched GO BP terms are showed in the bar plot of each disease state in each tissue. Each row represents a significant GO biological process which is colored according to the -log10(p.adjust). |
| Page: 1 2 3 4 5 6 7 8 9 |
| GO ID | Tissue | Disease Stage | Description | Gene Ratio | Bg Ratio | pvalue | p.adjust | Count |
| GO:00063257 | Cervix | CC | chromatin organization | 78/2311 | 409/18723 | 5.40e-05 | 8.02e-04 | 78 |
| GO:00063381 | Cervix | CC | chromatin remodeling | 45/2311 | 255/18723 | 8.33e-03 | 4.30e-02 | 45 |
| GO:000632516 | Esophagus | HGIN | chromatin organization | 92/2587 | 409/18723 | 1.05e-06 | 4.16e-05 | 92 |
| GO:000632517 | Esophagus | ESCC | chromatin organization | 240/8552 | 409/18723 | 6.52e-08 | 1.14e-06 | 240 |
| GO:000632511 | Liver | HCC | chromatin organization | 206/7958 | 409/18723 | 7.23e-04 | 4.41e-03 | 206 |
| GO:000632510 | Oral cavity | OSCC | chromatin organization | 190/7305 | 409/18723 | 1.17e-03 | 5.97e-03 | 190 |
| GO:000632515 | Oral cavity | EOLP | chromatin organization | 84/2218 | 409/18723 | 2.68e-07 | 8.16e-06 | 84 |
| GO:00063383 | Oral cavity | EOLP | chromatin remodeling | 46/2218 | 255/18723 | 2.34e-03 | 1.44e-02 | 46 |
| GO:00063259 | Prostate | BPH | chromatin organization | 101/3107 | 409/18723 | 1.52e-05 | 1.94e-04 | 101 |
| GO:00063382 | Prostate | BPH | chromatin remodeling | 62/3107 | 255/18723 | 9.47e-04 | 5.97e-03 | 62 |
| GO:000632514 | Prostate | Tumor | chromatin organization | 104/3246 | 409/18723 | 2.02e-05 | 2.62e-04 | 104 |
| GO:000633811 | Prostate | Tumor | chromatin remodeling | 63/3246 | 255/18723 | 1.73e-03 | 1.02e-02 | 63 |
| GO:000632518 | Skin | AK | chromatin organization | 73/1910 | 409/18723 | 1.40e-06 | 4.26e-05 | 73 |
| GO:00063384 | Skin | AK | chromatin remodeling | 51/1910 | 255/18723 | 1.95e-06 | 5.73e-05 | 51 |
| GO:0071103 | Skin | AK | DNA conformation change | 47/1910 | 290/18723 | 9.43e-04 | 7.61e-03 | 47 |
| GO:0071824 | Skin | AK | protein-DNA complex subunit organization | 38/1910 | 241/18723 | 4.43e-03 | 2.57e-02 | 38 |
| GO:000632519 | Skin | cSCC | chromatin organization | 147/4864 | 409/18723 | 4.41e-06 | 6.52e-05 | 147 |
| GO:000633812 | Skin | cSCC | chromatin remodeling | 94/4864 | 255/18723 | 7.58e-05 | 7.26e-04 | 94 |
| GO:00718241 | Skin | cSCC | protein-DNA complex subunit organization | 87/4864 | 241/18723 | 3.09e-04 | 2.47e-03 | 87 |
| GO:00711031 | Skin | cSCC | DNA conformation change | 96/4864 | 290/18723 | 3.87e-03 | 2.07e-02 | 96 |
| Page: 1 2 |
| Pathway ID | Tissue | Disease Stage | Description | Gene Ratio | Bg Ratio | pvalue | p.adjust | qvalue | Count |
| Page: 1 |
Top |
Cell-cell communication analysis |
| Identification of potential cell-cell interactions between two cell types and their ligand-receptor pairs for different disease states |
| Ligand | Receptor | LRpair | Pathway | Tissue | Disease Stage |
| Page: 1 |
Top |
Single-cell gene regulatory network inference analysis |
| Find out the significant the regulons (TFs) and the target genes of each regulon across cell types for different disease states |
| TF | Cell Type | Tissue | Disease Stage | Target Gene | RSS | Regulon Activity |
| ∗The dot plots of a searched regulon are shown for all cell subpopulations in each disease state of each tissue based on the regulon specific score inferred using pySCENIC and by calculating the average expression. |
| Page: 1 |
Top |
Somatic mutation of malignant transformation related genes |
| Annotation of somatic variants for genes involved in malignant transformation |
| Hugo Symbol | Variant Class | Variant Classification | dbSNP RS | HGVSc | HGVSp | HGVSp Short | SWISSPROT | BIOTYPE | SIFT | PolyPhen | Tumor Sample Barcode | Tissue | Histology | Sex | Age | Stage | Therapy Types | Drugs | Outcome |
| NAP1L4 | SNV | Missense_Mutation | c.541G>C | p.Asp181His | p.D181H | Q99733 | protein_coding | deleterious(0) | probably_damaging(0.999) | TCGA-AC-A23H-01 | Breast | breast invasive carcinoma | Female | >=65 | I/II | Unknown | Unknown | PD | |
| NAP1L4 | SNV | Missense_Mutation | novel | c.184N>T | p.Ala62Ser | p.A62S | Q99733 | protein_coding | tolerated(0.49) | benign(0.028) | TCGA-C8-A8HR-01 | Breast | breast invasive carcinoma | Female | <65 | III/IV | Chemotherapy | 5-fluorouracil | CR |
| NAP1L4 | SNV | Missense_Mutation | novel | c.146N>A | p.Pro49His | p.P49H | Q99733 | protein_coding | deleterious(0.04) | benign(0.308) | TCGA-2W-A8YY-01 | Cervix | cervical & endocervical cancer | Female | <65 | I/II | Chemotherapy | cisplatin | CR |
| NAP1L4 | SNV | Missense_Mutation | novel | c.235C>T | p.His79Tyr | p.H79Y | Q99733 | protein_coding | deleterious(0.04) | possibly_damaging(0.745) | TCGA-DS-A1OB-01 | Cervix | cervical & endocervical cancer | Female | <65 | I/II | Chemotherapy | carboplatin | PD |
| NAP1L4 | SNV | Missense_Mutation | rs201761556 | c.842N>T | p.Thr281Met | p.T281M | Q99733 | protein_coding | deleterious(0.01) | possibly_damaging(0.783) | TCGA-FU-A3HZ-01 | Cervix | cervical & endocervical cancer | Female | <65 | I/II | Chemotherapy | cisplatin | CR |
| NAP1L4 | SNV | Missense_Mutation | novel | c.85G>T | p.Asp29Tyr | p.D29Y | Q99733 | protein_coding | deleterious(0.03) | possibly_damaging(0.629) | TCGA-VS-A94Z-01 | Cervix | cervical & endocervical cancer | Female | <65 | I/II | Chemotherapy | cisplatin | CR |
| NAP1L4 | SNV | Missense_Mutation | novel | c.476T>G | p.Ile159Ser | p.I159S | Q99733 | protein_coding | deleterious(0) | probably_damaging(0.941) | TCGA-AA-A00N-01 | Colorectum | colon adenocarcinoma | Male | >=65 | I/II | Unknown | Unknown | PD |
| NAP1L4 | SNV | Missense_Mutation | c.451G>A | p.Ala151Thr | p.A151T | Q99733 | protein_coding | tolerated(0.47) | benign(0.026) | TCGA-G4-6628-01 | Colorectum | colon adenocarcinoma | Male | >=65 | I/II | Unknown | Unknown | SD | |
| NAP1L4 | SNV | Missense_Mutation | novel | c.415A>T | p.Ser139Cys | p.S139C | Q99733 | protein_coding | deleterious(0.02) | possibly_damaging(0.84) | TCGA-AG-A023-01 | Colorectum | rectum adenocarcinoma | Female | <65 | III/IV | Unknown | Unknown | PD |
| NAP1L4 | SNV | Missense_Mutation | rs754415348 | c.449N>T | p.Thr150Met | p.T150M | Q99733 | protein_coding | tolerated(0.11) | possibly_damaging(0.738) | TCGA-EI-6882-01 | Colorectum | rectum adenocarcinoma | Male | <65 | I/II | Unknown | Unknown | SD |
| Page: 1 2 3 |
Top |
Related drugs of malignant transformation related genes |
| Identification of chemicals and drugs interact with genes involved in malignant transfromation |
| (DGIdb 4.0) |
| Entrez ID | Symbol | Category | Interaction Types | Drug Claim Name | Drug Name | PMIDs |
| Page: 1 |

Copyright 2023-Present -The University of Texas Health Science Center at Houston |