
|
|||||
|
 | |
| |
| |
| |
| |
| |
|
Gene: MRPL52 |
Gene summary for MRPL52 |
| Gene information | Species | Human | Gene symbol | MRPL52 | Gene ID | 122704 |
| Gene name | mitochondrial ribosomal protein L52 | |
| Gene Alias | MRPL52 | |
| Cytomap | 14q11.2 | |
| Gene Type | protein-coding | GO ID | GO:0006412 | UniProtAcc | G5E9P5 |
Top |
Malignant transformation analysis |
| Identification of the aberrant gene expression in precancerous and cancerous lesions by comparing the gene expression of stem-like cells in diseased tissues with normal stem cells |
| Entrez ID | Symbol | Replicates | Species | Organ | Tissue | Adj P-value | Log2FC | Malignancy |
| 122704 | MRPL52 | P74T-E | Human | Esophagus | ESCC | 4.83e-56 | 2.12e+00 | 0.1479 |
| 122704 | MRPL52 | P75T-E | Human | Esophagus | ESCC | 1.39e-114 | 2.92e+00 | 0.1125 |
| 122704 | MRPL52 | P76T-E | Human | Esophagus | ESCC | 7.65e-50 | 1.51e+00 | 0.1207 |
| 122704 | MRPL52 | P79T-E | Human | Esophagus | ESCC | 4.76e-63 | 1.57e+00 | 0.1154 |
| 122704 | MRPL52 | P80T-E | Human | Esophagus | ESCC | 1.24e-59 | 2.22e+00 | 0.155 |
| 122704 | MRPL52 | P82T-E | Human | Esophagus | ESCC | 1.17e-17 | 1.50e+00 | 0.1072 |
| 122704 | MRPL52 | P83T-E | Human | Esophagus | ESCC | 1.05e-65 | 2.68e+00 | 0.1738 |
| 122704 | MRPL52 | P84T-E | Human | Esophagus | ESCC | 8.97e-16 | 1.08e+00 | 0.0933 |
| 122704 | MRPL52 | P89T-E | Human | Esophagus | ESCC | 4.20e-33 | 2.72e+00 | 0.1752 |
| 122704 | MRPL52 | P91T-E | Human | Esophagus | ESCC | 1.07e-25 | 3.77e+00 | 0.1828 |
| 122704 | MRPL52 | P94T-E | Human | Esophagus | ESCC | 6.11e-06 | 1.48e+00 | 0.0879 |
| 122704 | MRPL52 | P104T-E | Human | Esophagus | ESCC | 9.34e-10 | 1.64e+00 | 0.0931 |
| 122704 | MRPL52 | P107T-E | Human | Esophagus | ESCC | 2.82e-93 | 2.66e+00 | 0.171 |
| 122704 | MRPL52 | P126T-E | Human | Esophagus | ESCC | 4.26e-18 | 2.10e+00 | 0.1125 |
| 122704 | MRPL52 | P127T-E | Human | Esophagus | ESCC | 2.13e-23 | 4.35e-01 | 0.0826 |
| 122704 | MRPL52 | P128T-E | Human | Esophagus | ESCC | 6.47e-65 | 3.00e+00 | 0.1241 |
| 122704 | MRPL52 | P130T-E | Human | Esophagus | ESCC | 6.74e-98 | 2.44e+00 | 0.1676 |
| 122704 | MRPL52 | S43 | Human | Liver | Cirrhotic | 3.32e-16 | -5.38e-01 | -0.0187 |
| 122704 | MRPL52 | HCC1_Meng | Human | Liver | HCC | 2.22e-62 | 5.25e-01 | 0.0246 |
| 122704 | MRPL52 | HCC2_Meng | Human | Liver | HCC | 2.36e-46 | 1.79e-01 | 0.0107 |
| Page: 1 2 3 4 5 6 7 8 9 10 11 |
| Tissue | Expression Dynamics | Abbreviation |
| Breast | 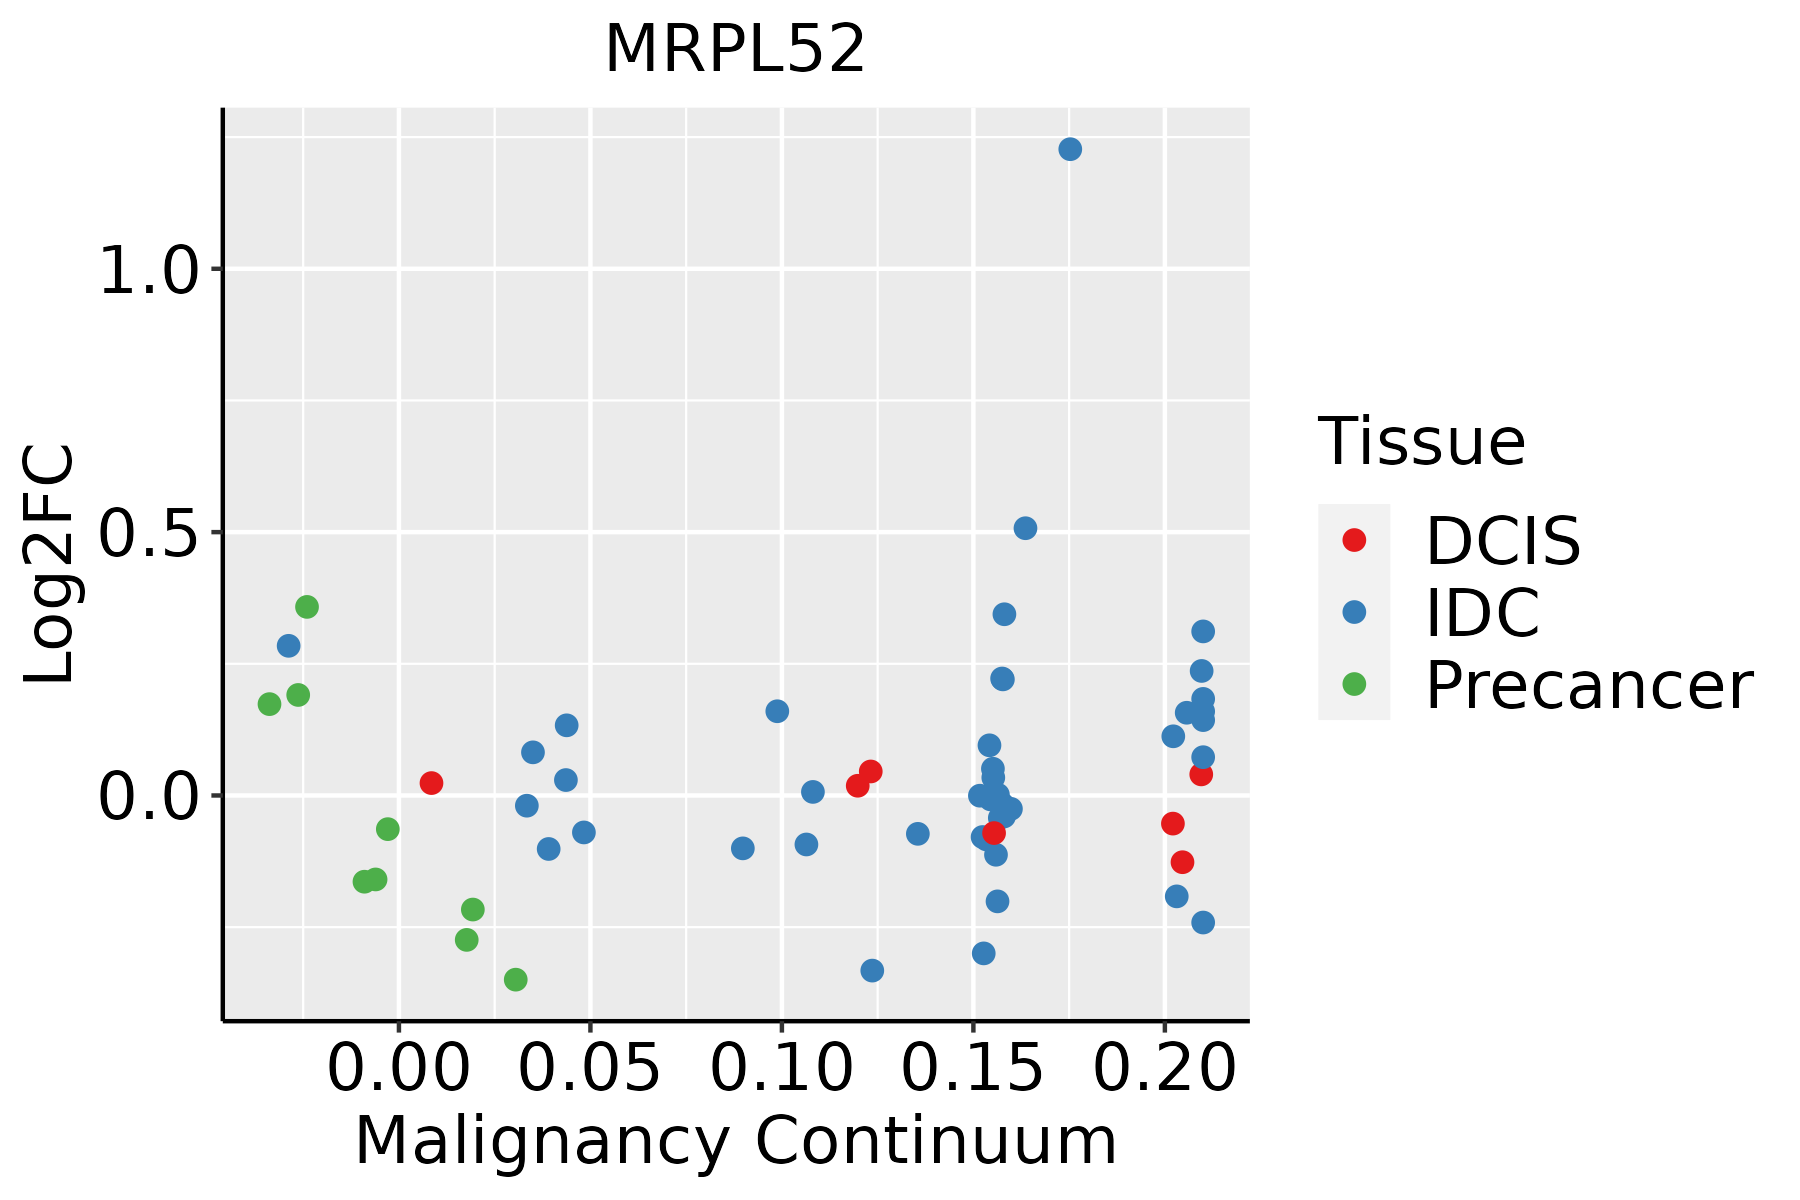 | IDC: Invasive ductal carcinoma |
| DCIS: Ductal carcinoma in situ | ||
| Precancer(BRCA1-mut): Precancerous lesion from BRCA1 mutation carriers | ||
| Cervix | 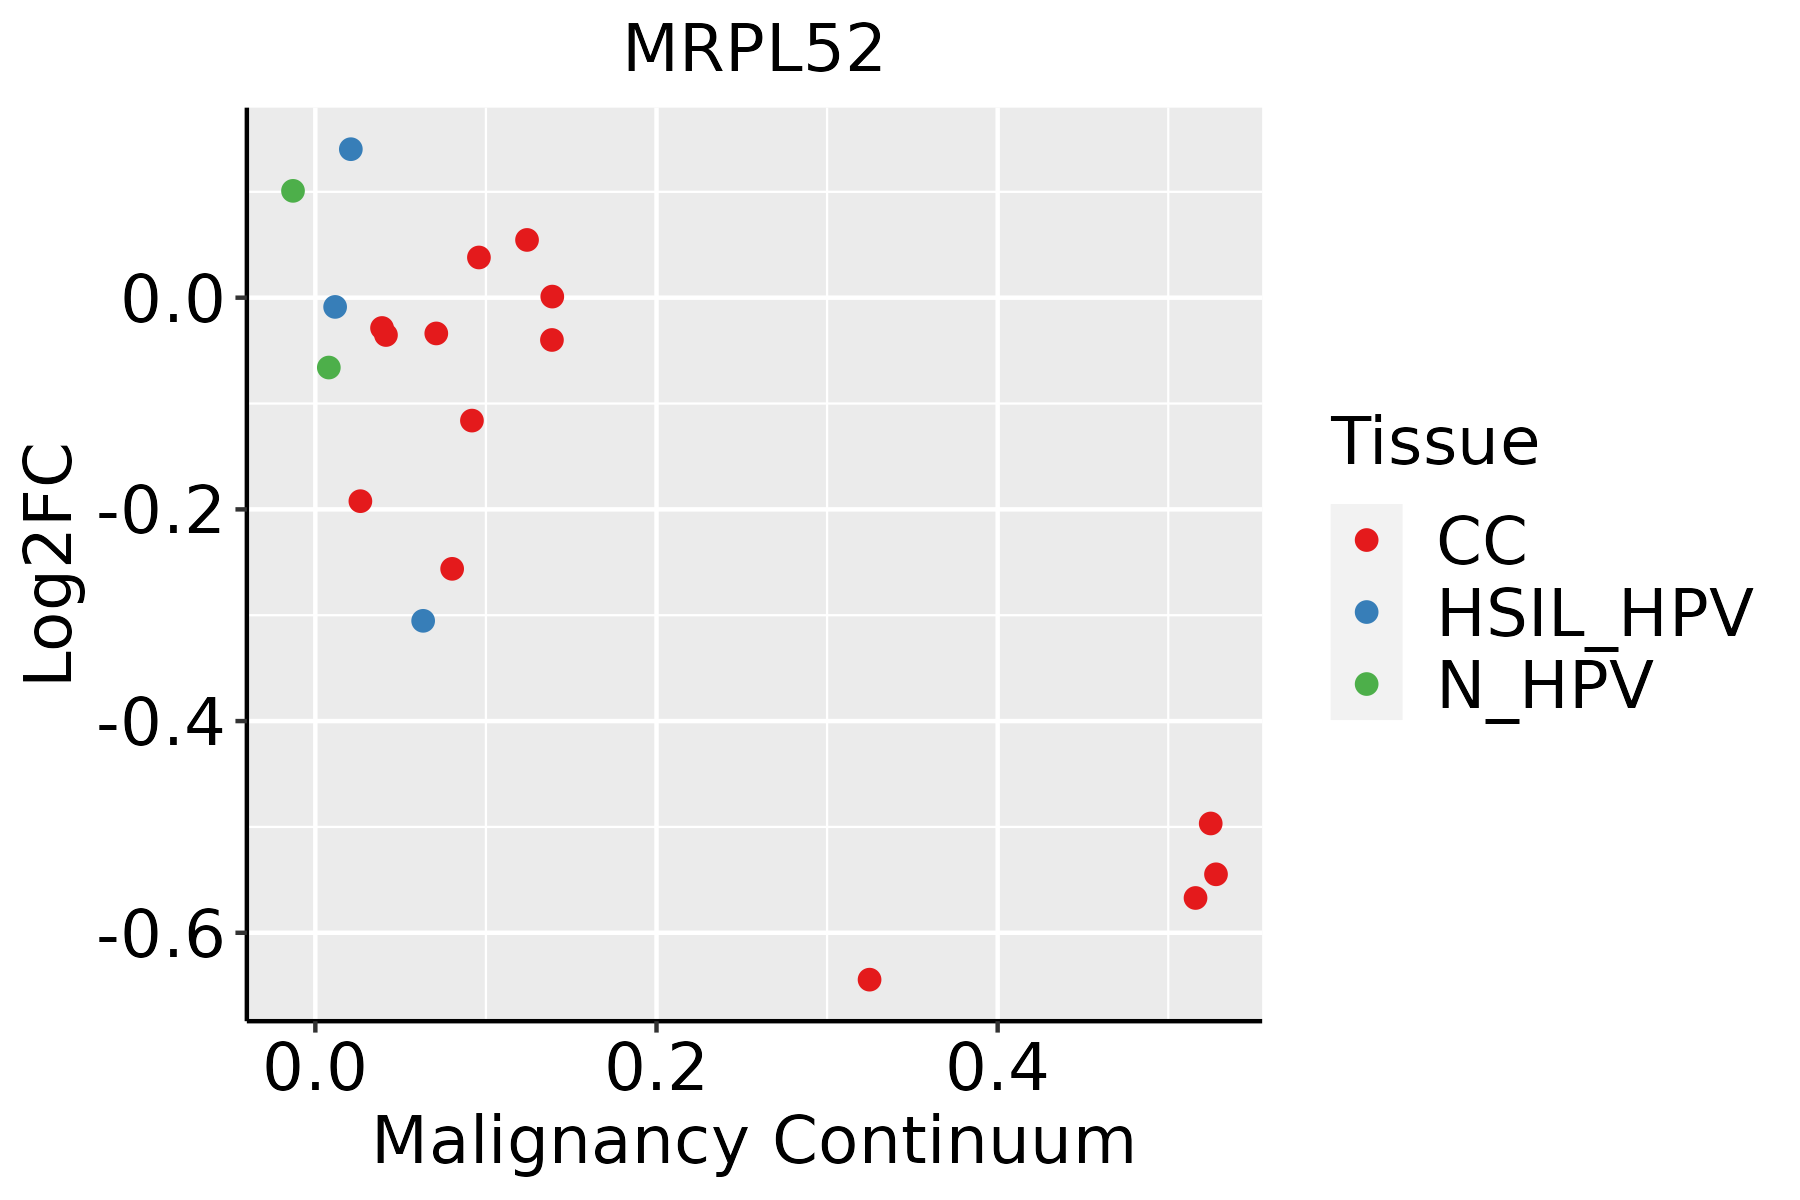 | CC: Cervix cancer |
| HSIL_HPV: HPV-infected high-grade squamous intraepithelial lesions | ||
| N_HPV: HPV-infected normal cervix | ||
| Endometrium | 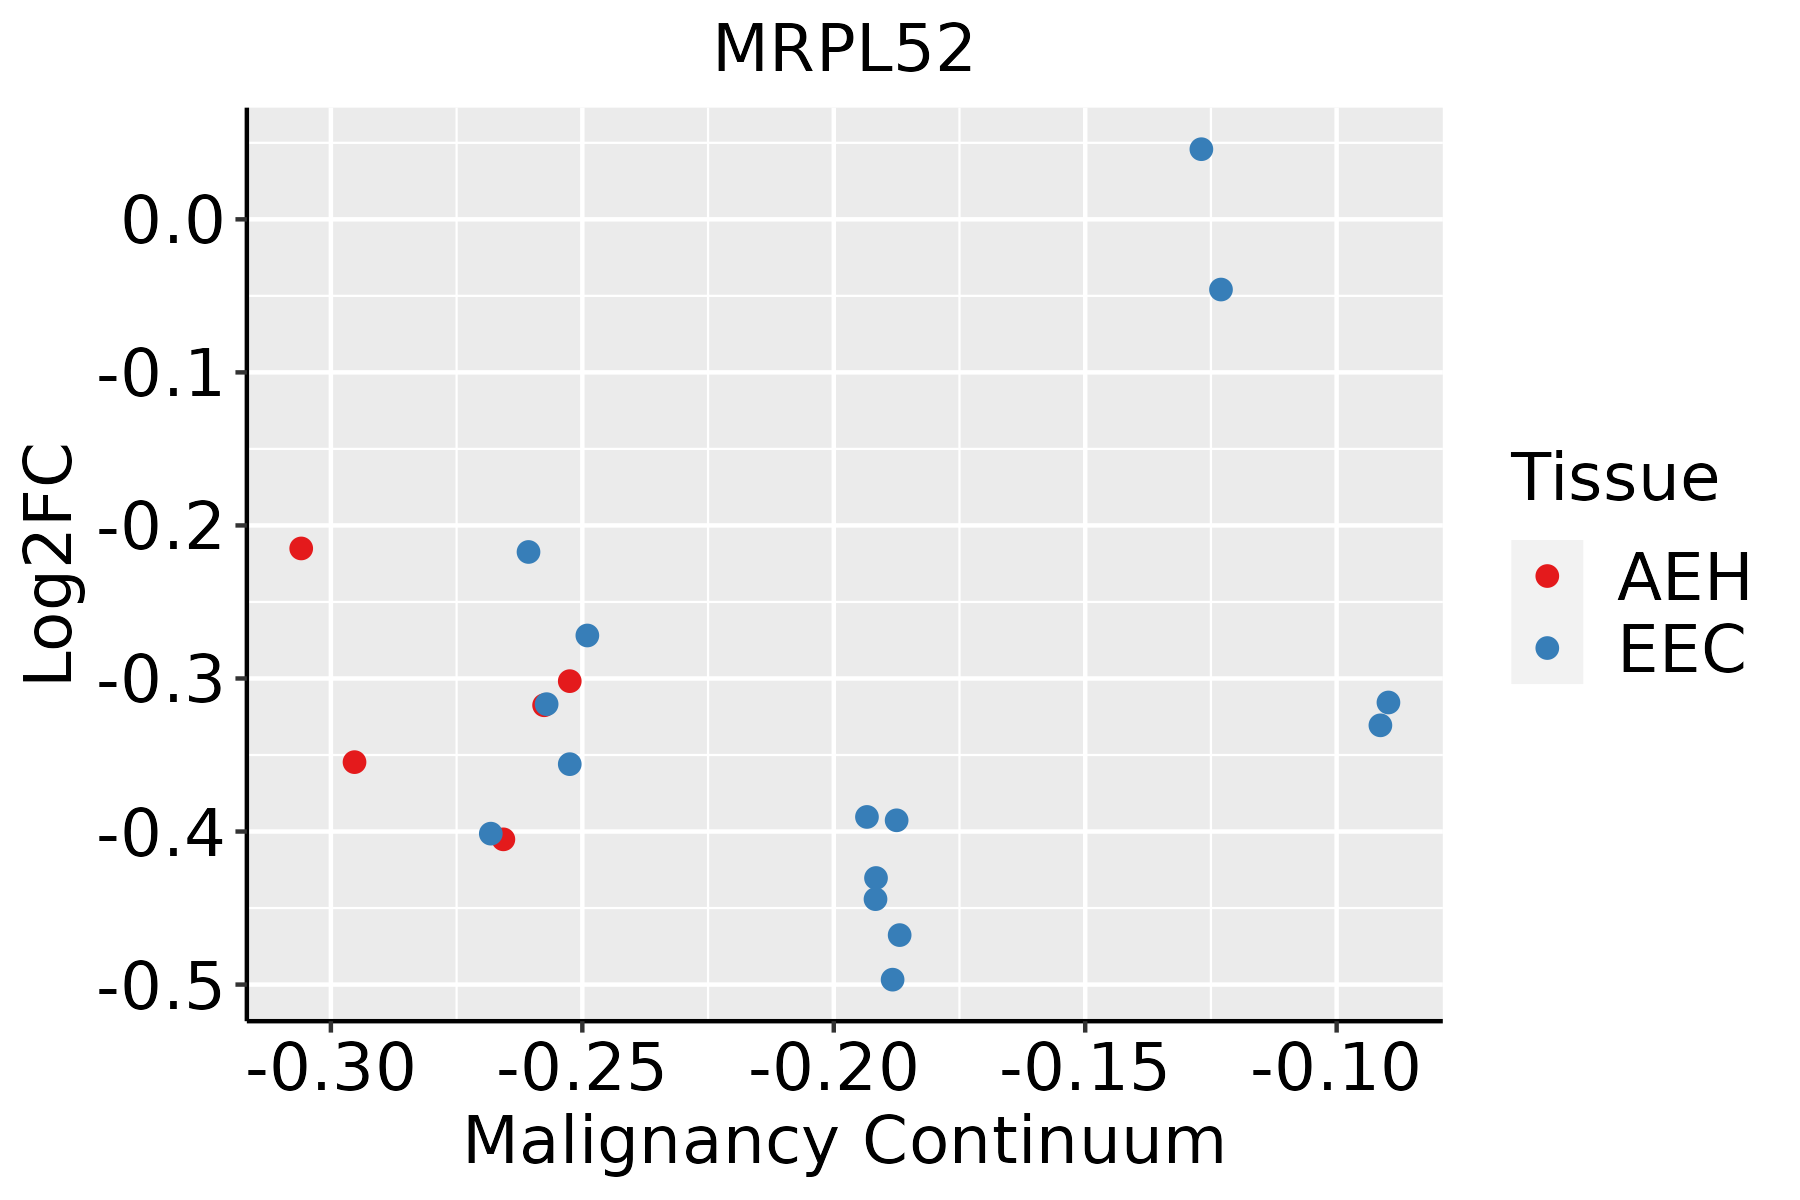 | AEH: Atypical endometrial hyperplasia |
| EEC: Endometrioid Cancer | ||
| Esophagus |  | ESCC: Esophageal squamous cell carcinoma |
| HGIN: High-grade intraepithelial neoplasias | ||
| LGIN: Low-grade intraepithelial neoplasias | ||
| GC | 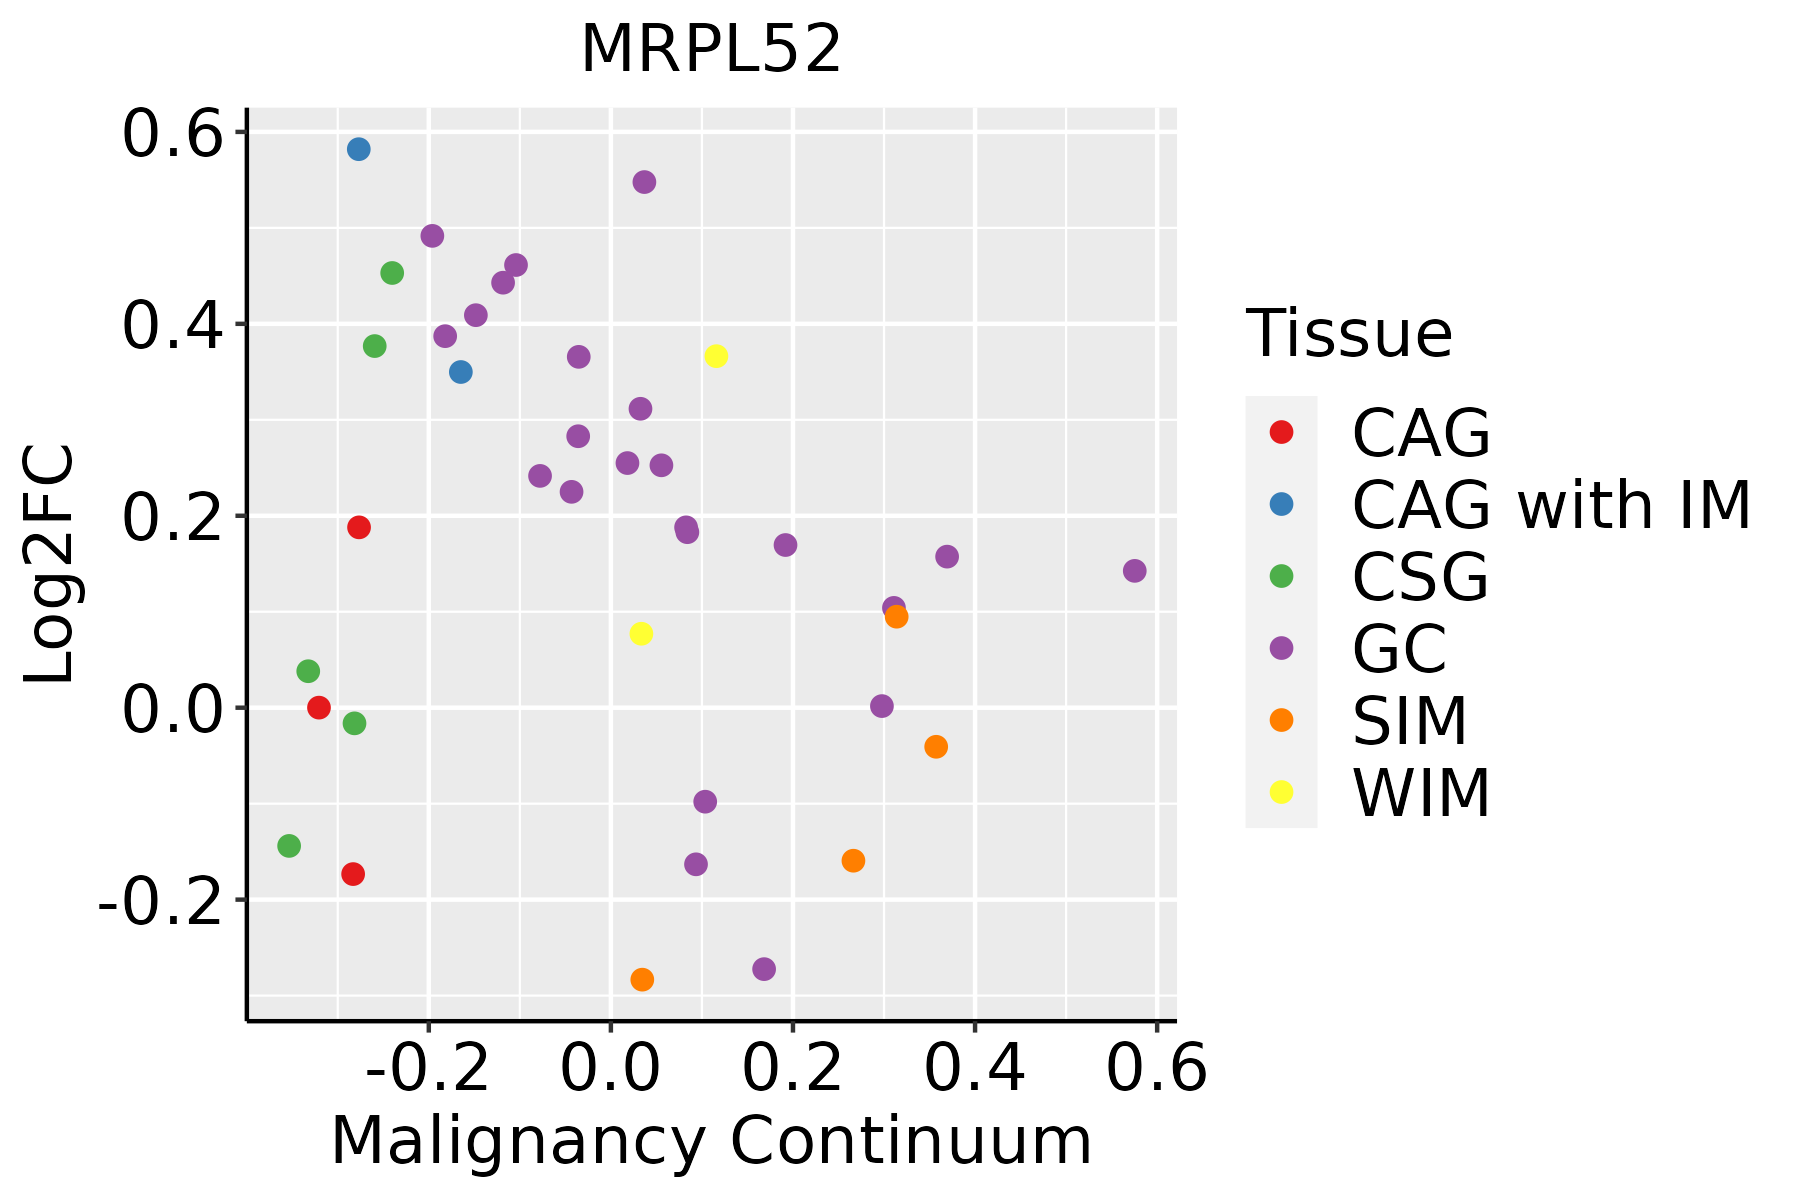 | CAG: Chronic atrophic gastritis |
| CAG with IM: Chronic atrophic gastritis with intestinal metaplasia | ||
| CSG: Chronic superficial gastritis | ||
| GC: Gastric cancer | ||
| SIM: Severe intestinal metaplasia | ||
| WIM: Wild intestinal metaplasia | ||
| Liver | 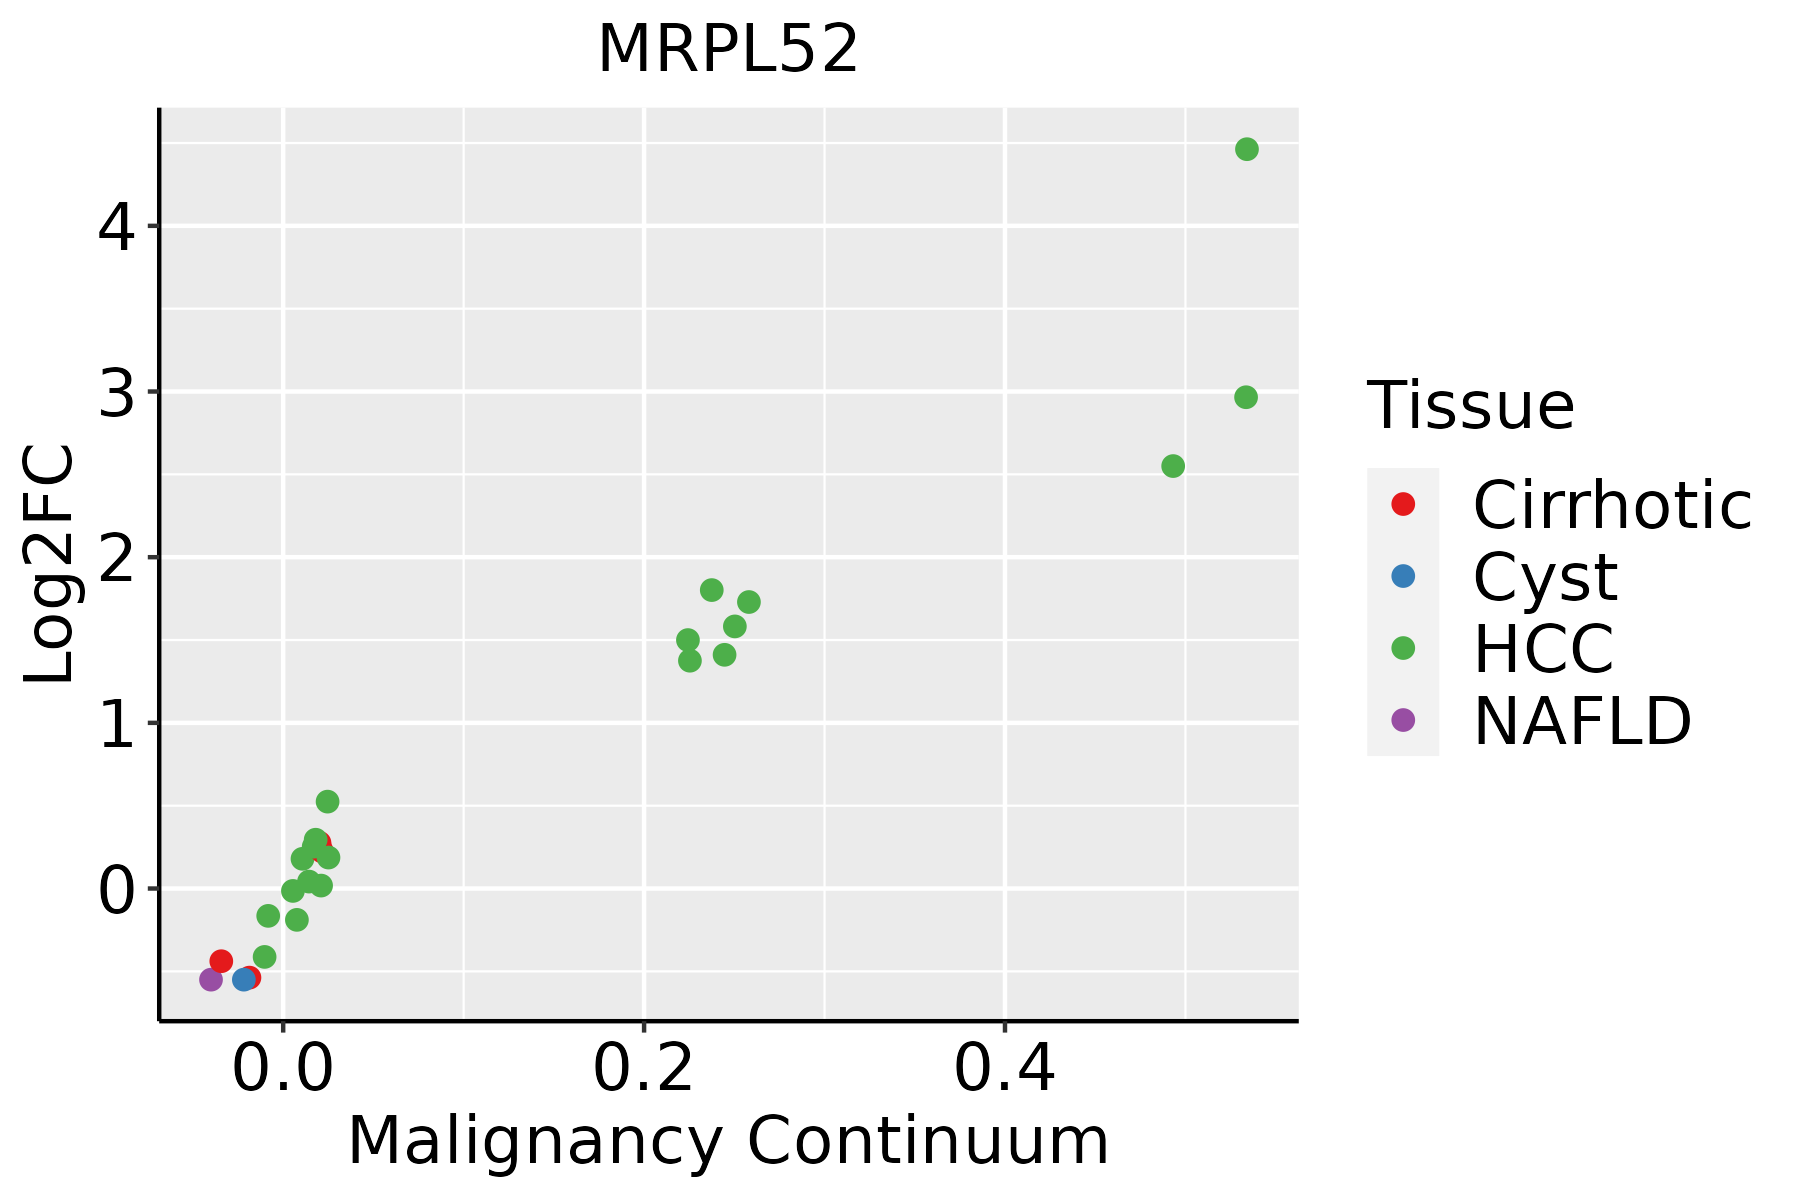 | HCC: Hepatocellular carcinoma |
| NAFLD: Non-alcoholic fatty liver disease | ||
| Oral Cavity | 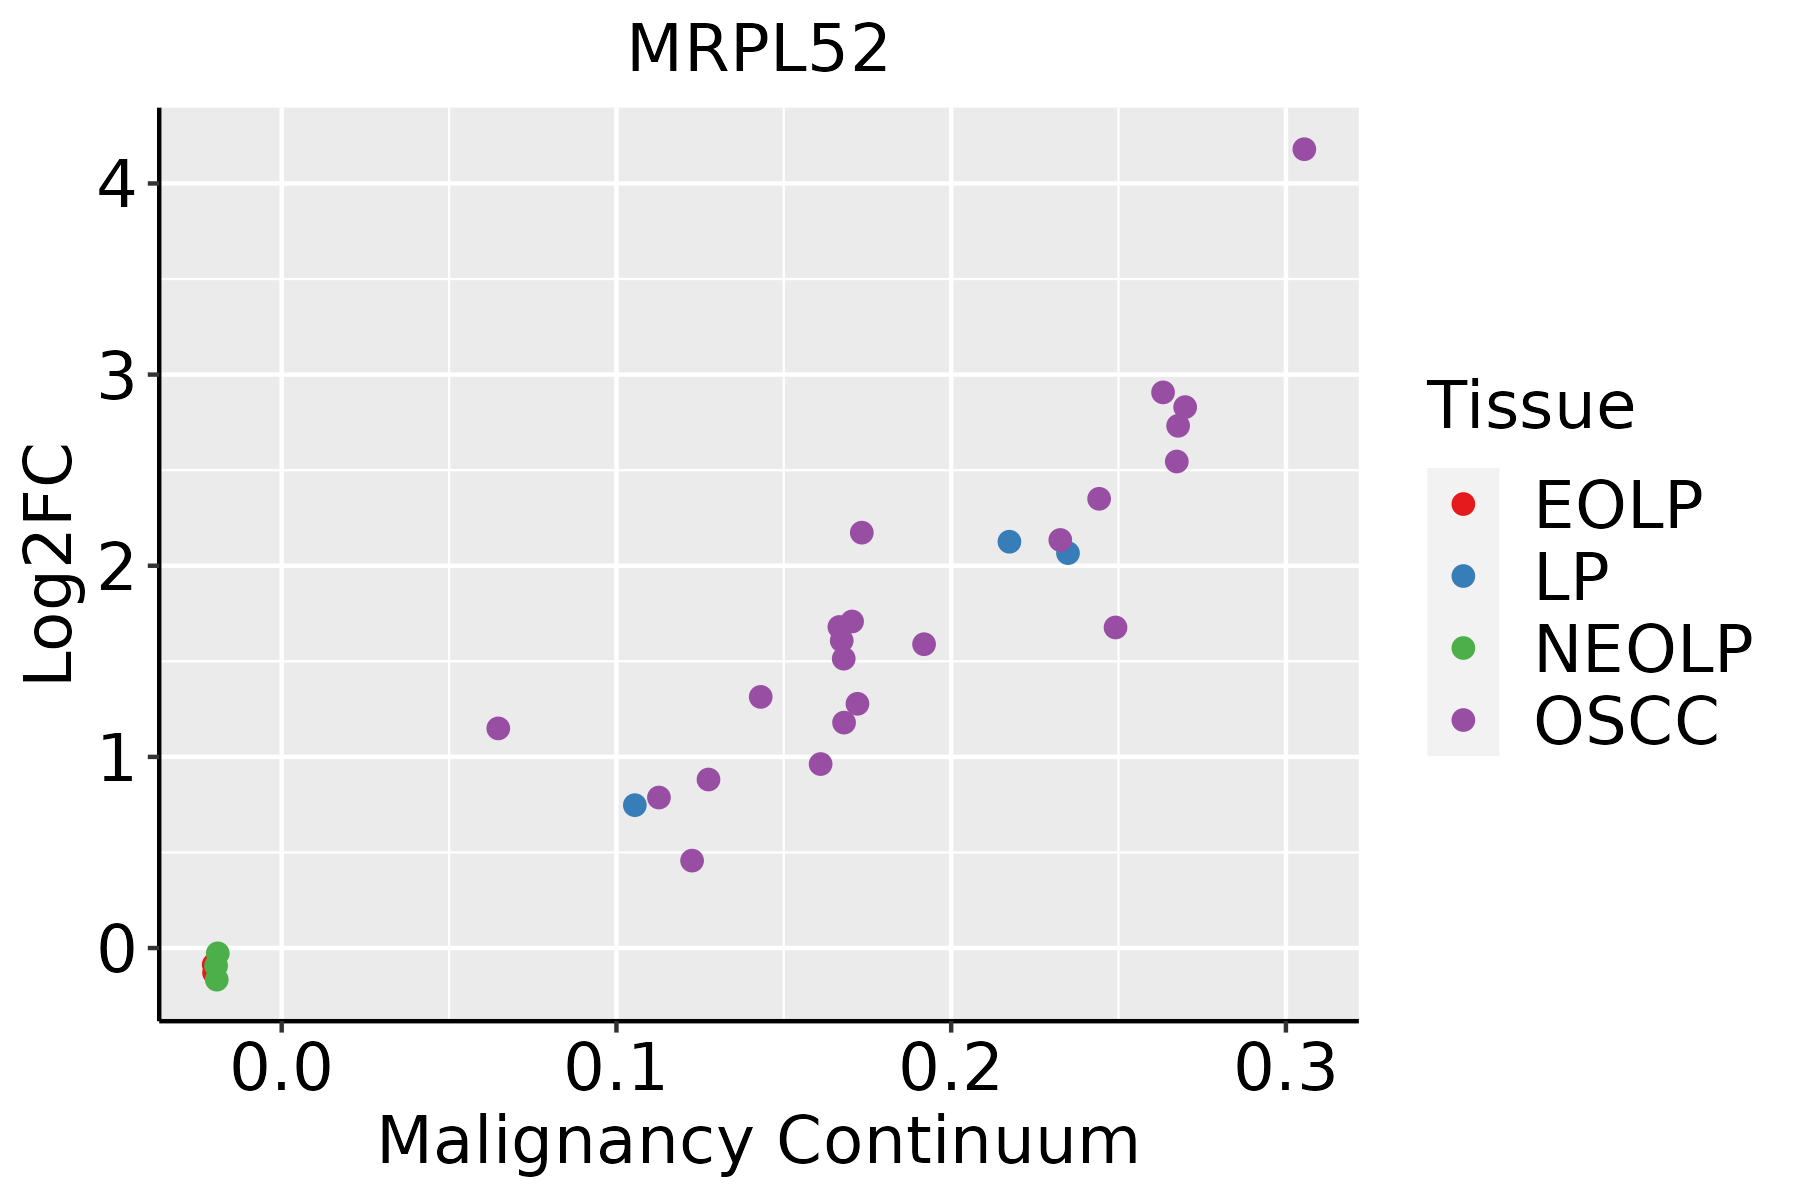 | EOLP: Erosive Oral lichen planus |
| LP: leukoplakia | ||
| NEOLP: Non-erosive oral lichen planus | ||
| OSCC: Oral squamous cell carcinoma | ||
| Prostate | 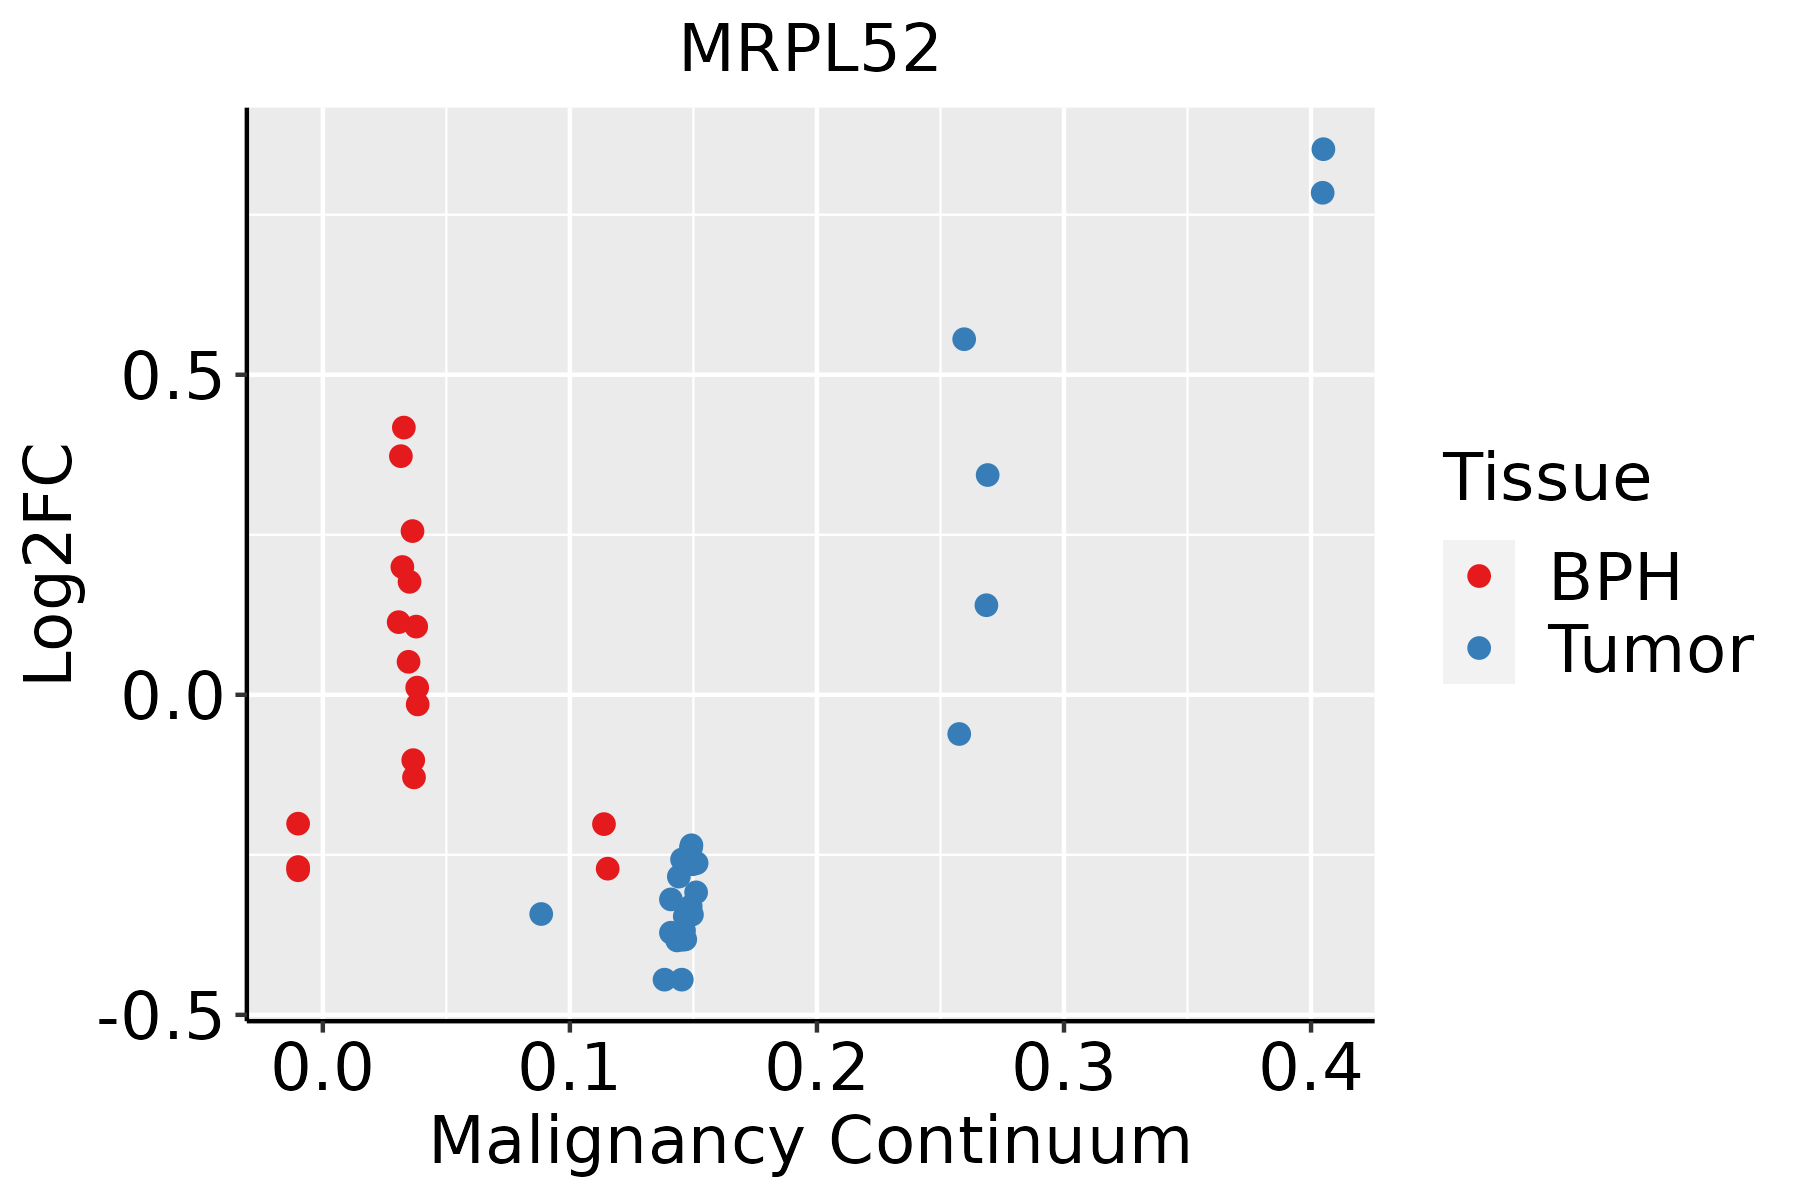 | BPH: Benign Prostatic Hyperplasia |
| Skin | 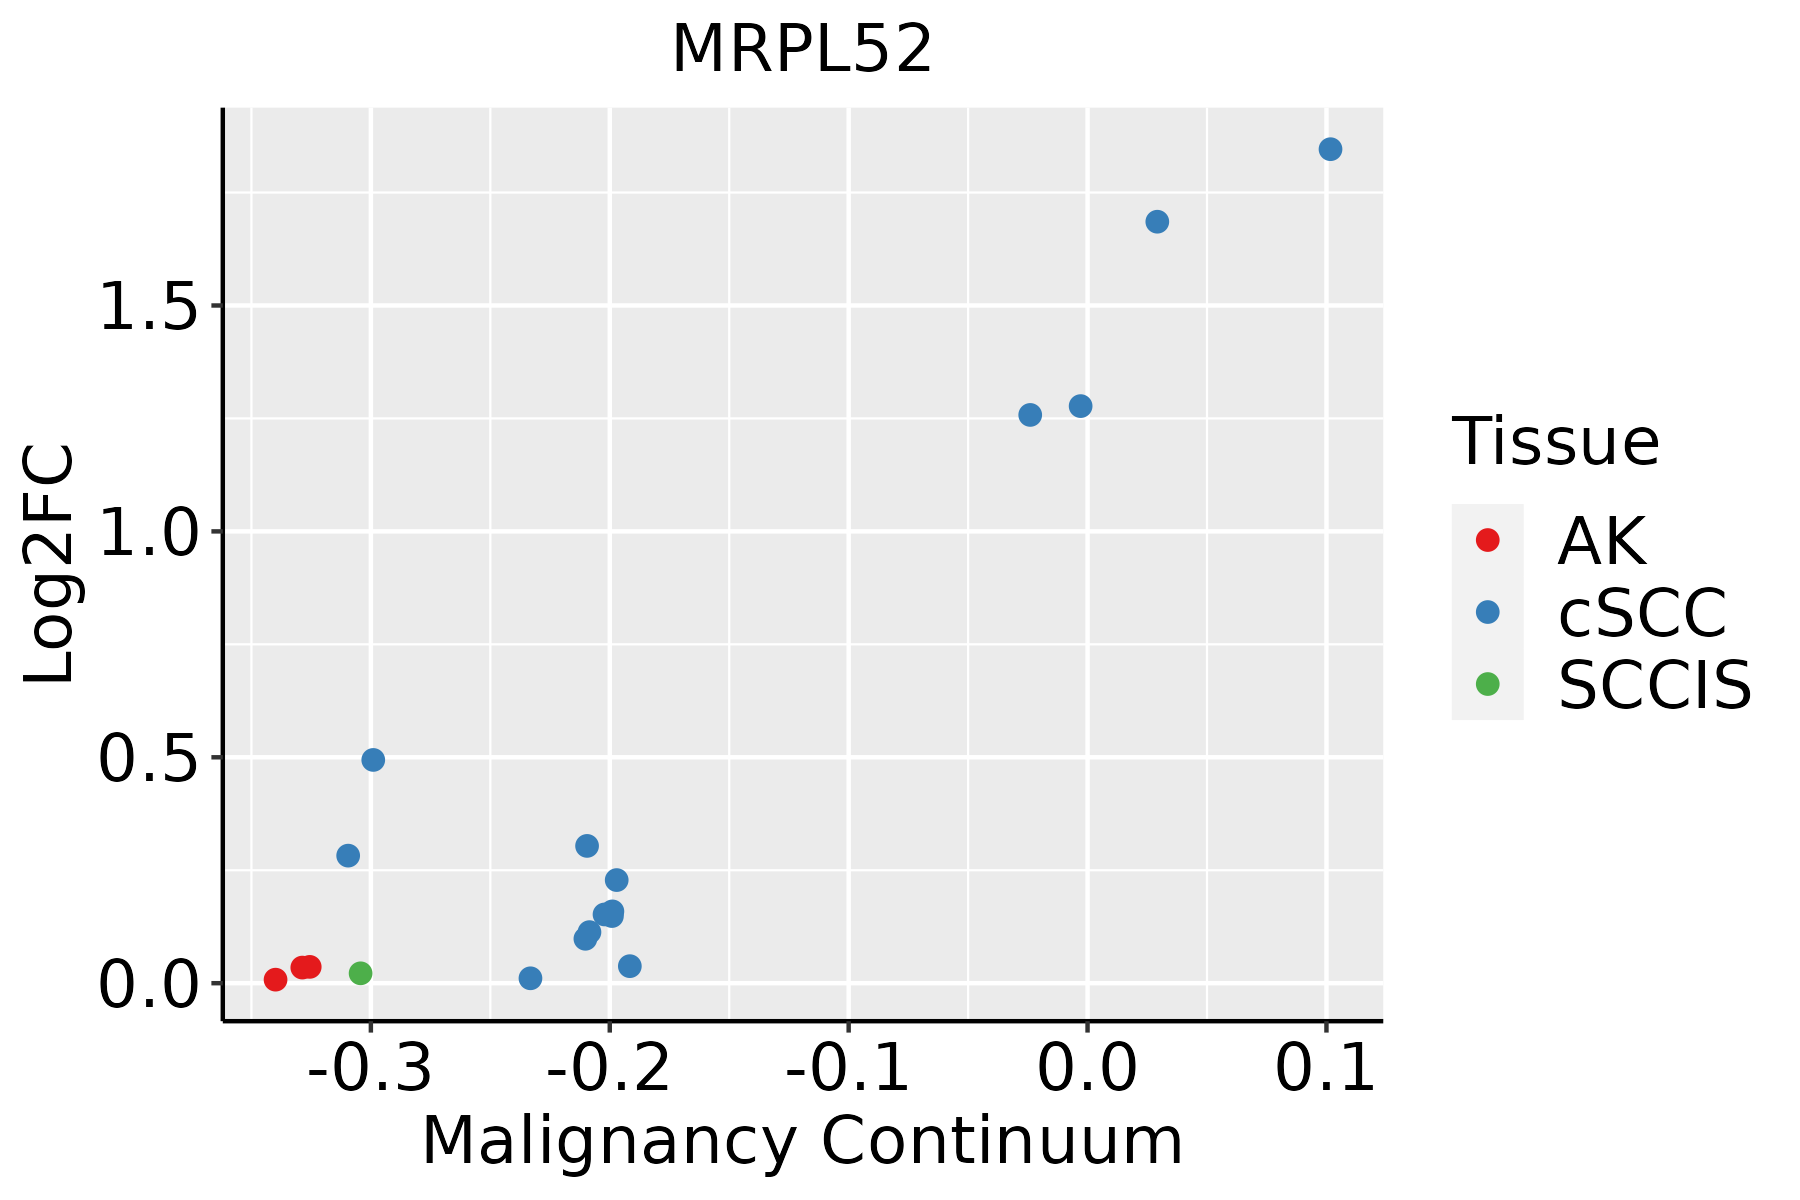 | AK: Actinic keratosis |
| cSCC: Cutaneous squamous cell carcinoma | ||
| SCCIS:squamous cell carcinoma in situ | ||
| Thyroid | 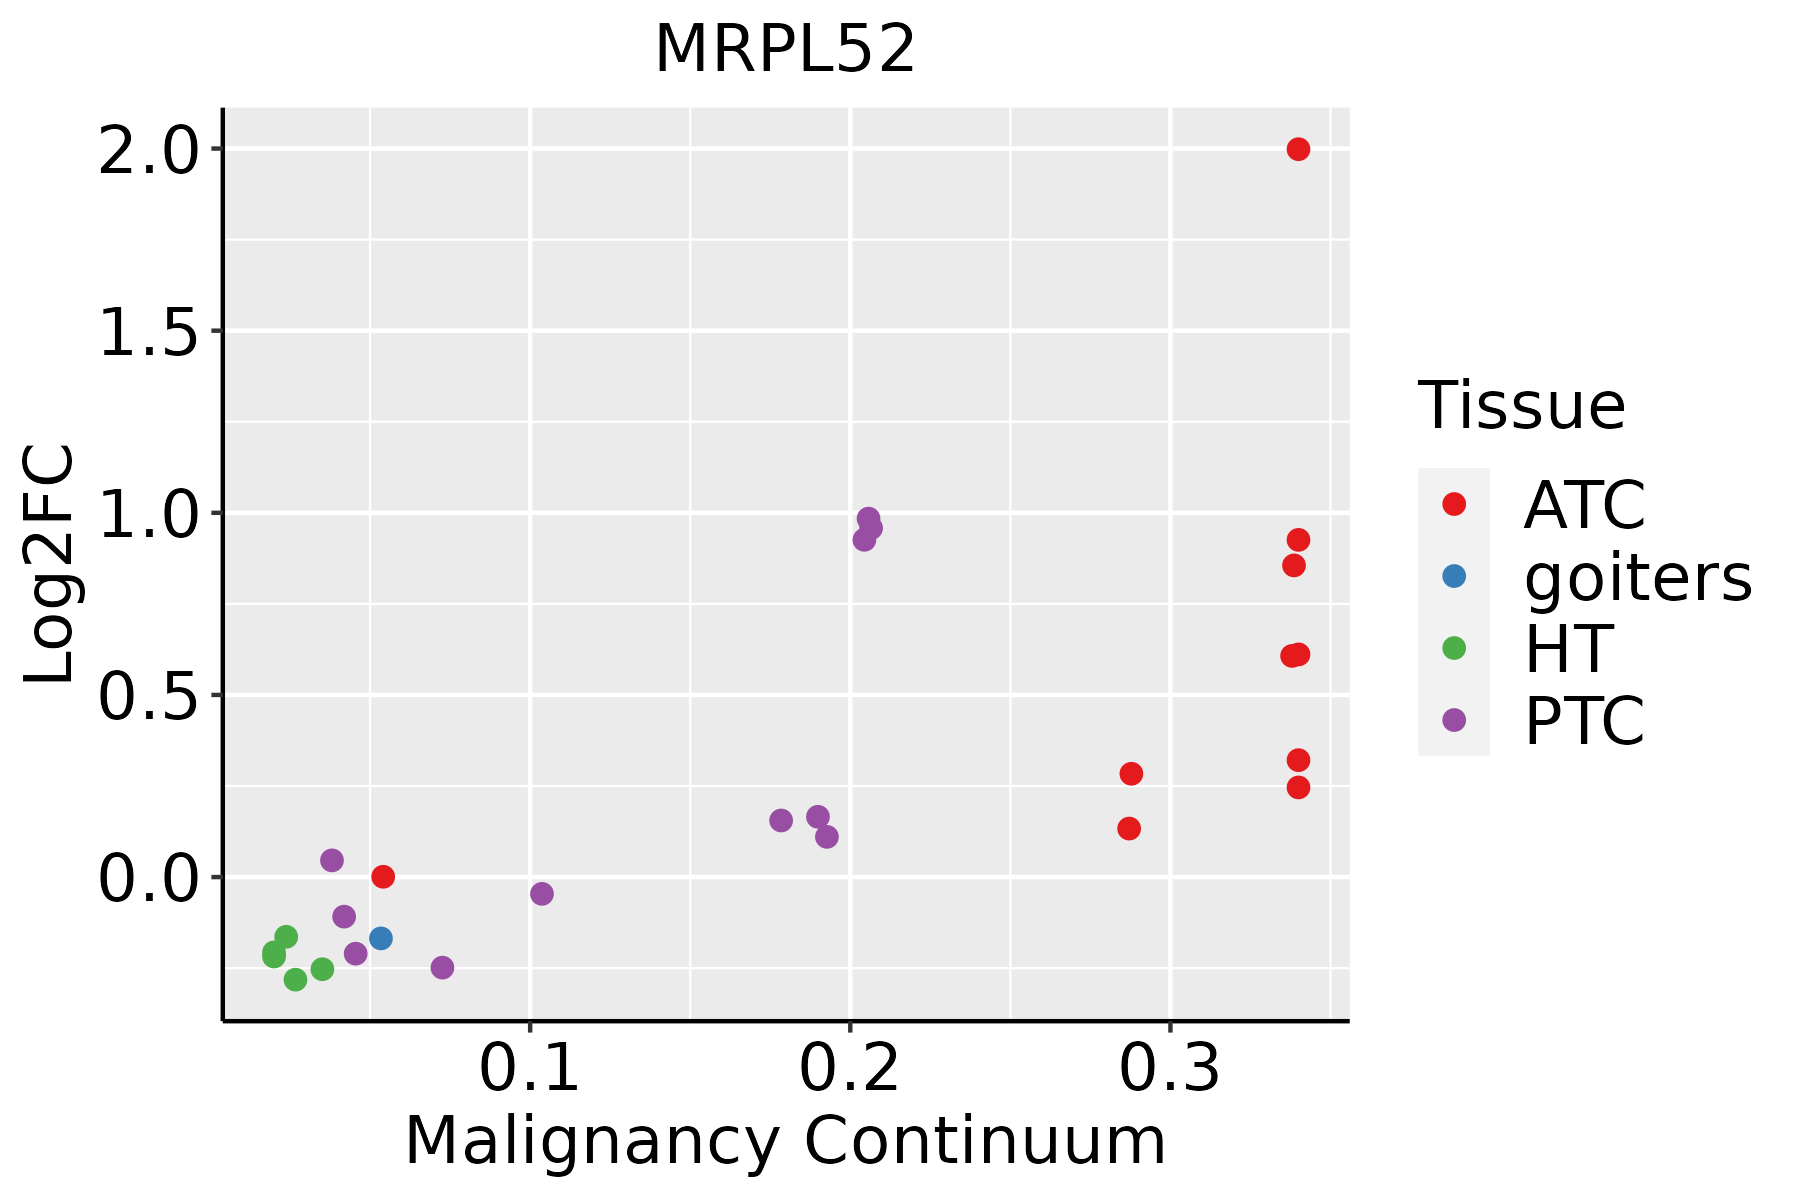 | ATC: Anaplastic thyroid cancer |
| HT: Hashimoto's thyroiditis | ||
| PTC: Papillary thyroid cancer |
| ∗log2FC in expression of this searched gene in stem-like cells from each diseased tissue sample relative to stem-like cells in normal samples in each tissue plotted against the malignancy continuum. Samples are colored based on if they are from different disease stage. |
Top |
Malignant transformation related pathway analysis |
| Find out the enriched GO biological processes and KEGG pathways involved in transition from healthy to precancer to cancer |
| Tissue | Disease Stage | Enriched GO biological Processes |
| Colorectum | AD |  |
| Colorectum | SER |  |
| Colorectum | MSS |  |
| Colorectum | MSI-H |  |
| Colorectum | FAP |  |
| ∗Top 15 enriched GO BP terms are showed in the bar plot of each disease state in each tissue. Each row represents a significant GO biological process which is colored according to the -log10(p.adjust). |
| Page: 1 2 3 4 5 6 7 8 9 |
| GO ID | Tissue | Disease Stage | Description | Gene Ratio | Bg Ratio | pvalue | p.adjust | Count |
| GO:00325432 | Breast | IDC | mitochondrial translation | 13/1434 | 76/18723 | 4.81e-03 | 3.67e-02 | 13 |
| GO:003254311 | Breast | DCIS | mitochondrial translation | 13/1390 | 76/18723 | 3.70e-03 | 2.99e-02 | 13 |
| GO:00325435 | Esophagus | HGIN | mitochondrial translation | 23/2587 | 76/18723 | 1.61e-04 | 3.16e-03 | 23 |
| GO:01400534 | Esophagus | HGIN | mitochondrial gene expression | 27/2587 | 108/18723 | 1.34e-03 | 1.57e-02 | 27 |
| GO:014005313 | Esophagus | ESCC | mitochondrial gene expression | 93/8552 | 108/18723 | 1.96e-18 | 2.03e-16 | 93 |
| GO:003254314 | Esophagus | ESCC | mitochondrial translation | 68/8552 | 76/18723 | 1.02e-15 | 6.86e-14 | 68 |
| GO:0032543 | Liver | Cirrhotic | mitochondrial translation | 40/4634 | 76/18723 | 1.61e-07 | 4.29e-06 | 40 |
| GO:0140053 | Liver | Cirrhotic | mitochondrial gene expression | 49/4634 | 108/18723 | 2.35e-06 | 4.31e-05 | 49 |
| GO:01400531 | Liver | HCC | mitochondrial gene expression | 82/7958 | 108/18723 | 1.49e-12 | 7.20e-11 | 82 |
| GO:00325431 | Liver | HCC | mitochondrial translation | 62/7958 | 76/18723 | 2.95e-12 | 1.34e-10 | 62 |
| GO:01400533 | Oral cavity | OSCC | mitochondrial gene expression | 78/7305 | 108/18723 | 2.37e-12 | 9.86e-11 | 78 |
| GO:00325434 | Oral cavity | OSCC | mitochondrial translation | 59/7305 | 76/18723 | 7.21e-12 | 2.70e-10 | 59 |
| GO:003254313 | Oral cavity | LP | mitochondrial translation | 43/4623 | 76/18723 | 2.85e-09 | 1.26e-07 | 43 |
| GO:014005312 | Oral cavity | LP | mitochondrial gene expression | 53/4623 | 108/18723 | 3.54e-08 | 1.27e-06 | 53 |
| GO:00325433 | Prostate | BPH | mitochondrial translation | 23/3107 | 76/18723 | 2.21e-03 | 1.22e-02 | 23 |
| GO:01400532 | Prostate | BPH | mitochondrial gene expression | 29/3107 | 108/18723 | 4.68e-03 | 2.25e-02 | 29 |
| GO:003254312 | Prostate | Tumor | mitochondrial translation | 24/3246 | 76/18723 | 1.73e-03 | 1.03e-02 | 24 |
| GO:014005311 | Prostate | Tumor | mitochondrial gene expression | 31/3246 | 108/18723 | 2.31e-03 | 1.30e-02 | 31 |
| GO:00325436 | Skin | cSCC | mitochondrial translation | 47/4864 | 76/18723 | 4.70e-11 | 2.22e-09 | 47 |
| GO:01400535 | Skin | cSCC | mitochondrial gene expression | 56/4864 | 108/18723 | 8.06e-09 | 2.56e-07 | 56 |
| Page: 1 2 |
| Pathway ID | Tissue | Disease Stage | Description | Gene Ratio | Bg Ratio | pvalue | p.adjust | qvalue | Count |
| Page: 1 |
Top |
Cell-cell communication analysis |
| Identification of potential cell-cell interactions between two cell types and their ligand-receptor pairs for different disease states |
| Ligand | Receptor | LRpair | Pathway | Tissue | Disease Stage |
| Page: 1 |
Top |
Single-cell gene regulatory network inference analysis |
| Find out the significant the regulons (TFs) and the target genes of each regulon across cell types for different disease states |
| TF | Cell Type | Tissue | Disease Stage | Target Gene | RSS | Regulon Activity |
| ∗The dot plots of a searched regulon are shown for all cell subpopulations in each disease state of each tissue based on the regulon specific score inferred using pySCENIC and by calculating the average expression. |
| Page: 1 |
Top |
Somatic mutation of malignant transformation related genes |
| Annotation of somatic variants for genes involved in malignant transformation |
| Hugo Symbol | Variant Class | Variant Classification | dbSNP RS | HGVSc | HGVSp | HGVSp Short | SWISSPROT | BIOTYPE | SIFT | PolyPhen | Tumor Sample Barcode | Tissue | Histology | Sex | Age | Stage | Therapy Types | Drugs | Outcome |
| MRPL52 | SNV | Missense_Mutation | c.70G>A | p.Gly24Ser | p.G24S | Q86TS9 | protein_coding | tolerated(0.07) | possibly_damaging(0.747) | TCGA-BH-A0B4-01 | Breast | breast invasive carcinoma | Male | >=65 | III/IV | Hormone Therapy | tamoxiphen | SD | |
| MRPL52 | SNV | Missense_Mutation | novel | c.12A>T | p.Leu4Phe | p.L4F | Q86TS9 | protein_coding | deleterious_low_confidence(0.03) | benign(0.009) | TCGA-GM-A2DB-01 | Breast | breast invasive carcinoma | Female | <65 | I/II | Chemotherapy | taxol | CR |
| MRPL52 | SNV | Missense_Mutation | c.170N>T | p.Ala57Val | p.A57V | Q86TS9 | protein_coding | deleterious(0) | possibly_damaging(0.814) | TCGA-A6-2686-01 | Colorectum | colon adenocarcinoma | Female | >=65 | I/II | Unknown | Unknown | SD | |
| MRPL52 | SNV | Missense_Mutation | novel | c.244N>A | p.Gln82Lys | p.Q82K | Q86TS9 | protein_coding | tolerated(0.38) | benign(0.067) | TCGA-AA-A01K-01 | Colorectum | colon adenocarcinoma | Female | >=65 | III/IV | Chemotherapy | folinic | CR |
| MRPL52 | SNV | Missense_Mutation | novel | c.230T>G | p.Val77Gly | p.V77G | Q86TS9 | protein_coding | deleterious(0) | possibly_damaging(0.716) | TCGA-A5-A0G2-01 | Endometrium | uterine corpus endometrioid carcinoma | Female | <65 | III/IV | Unknown | Unknown | SD |
| MRPL52 | SNV | Missense_Mutation | c.246N>T | p.Gln82His | p.Q82H | Q86TS9 | protein_coding | deleterious(0.02) | possibly_damaging(0.861) | TCGA-AP-A059-01 | Endometrium | uterine corpus endometrioid carcinoma | Female | >=65 | I/II | Unknown | Unknown | SD | |
| MRPL52 | SNV | Missense_Mutation | novel | c.341N>T | p.Ala114Val | p.A114V | Q86TS9 | protein_coding | tolerated(0.22) | benign(0.001) | TCGA-EY-A1GQ-01 | Endometrium | uterine corpus endometrioid carcinoma | Female | >=65 | I/II | Chemotherapy | taxol | SD |
| MRPL52 | SNV | Missense_Mutation | rs747716134 | c.100N>A | p.Ala34Thr | p.A34T | Q86TS9 | protein_coding | deleterious(0.02) | possibly_damaging(0.642) | TCGA-FI-A2D0-01 | Endometrium | uterine corpus endometrioid carcinoma | Female | <65 | I/II | Unknown | Unknown | SD |
| MRPL52 | SNV | Missense_Mutation | novel | c.227G>A | p.Arg76Gln | p.R76Q | Q86TS9 | protein_coding | tolerated(0.05) | probably_damaging(0.977) | TCGA-CQ-7071-01 | Oral cavity | head & neck squamous cell carcinoma | Female | >=65 | III/IV | Unknown | Unknown | SD |
| Page: 1 |
Top |
Related drugs of malignant transformation related genes |
| Identification of chemicals and drugs interact with genes involved in malignant transfromation |
| (DGIdb 4.0) |
| Entrez ID | Symbol | Category | Interaction Types | Drug Claim Name | Drug Name | PMIDs |
| Page: 1 |

Copyright 2023-Present -The University of Texas Health Science Center at Houston |