Schematic overview of the cellular and molecular mechanisms involved in the cancer progression, including the proposed cellular and molecular mechanisms in cancer cells trajectory. AT1: alveolar type 1 cells; AT2: alveolar type 2 cells; AAH: atypical adenomatous hyperplasia; AIS: adenocarcinoma in situ; MIA: minimally invasive adenocarcinoma; IA: invasive adenocarcinoma; EMT: epithelial-mesenchymal transition

Home

Download

Statistics

Help

Contact

Center for Computational Systems Medicine
leaf

Gene summary

leaf

Malignant transformation analysis

leaf

Malignant transformation related pathway analysis

leaf

Cell-cell communication analysis

leaf

Single-cell gene regulatory network inference analysis

leaf

Somatic mutation of malignant transformation related genes

leaf

Related drugs of malignant transformation related genes

Gene: MLPH

Gene summary for MLPH

check button Gene summary.

Gene informationSpeciesHuman
Gene symbol

MLPH

Gene ID

79083

Gene namemelanophilin
Gene AliasSLAC2-A
Cytomap2q37.3
Gene Typeprotein-coding
GO ID

GO:0006810

UniProtAcc

A0A024R4D3


Top

Malignant transformation analysis

check button Identification of the aberrant gene expression in precancerous and cancerous lesions by comparing the gene expression of stem-like cells in diseased tissues with normal stem cells
check button Malignant transformation involving gene list.
Entrez IDSymbolReplicatesSpeciesOrganTissueAdj P-valueLog2FCMalignancy
79083MLPHRNA-P25T1-P25T1-2HumanLungAIS4.51e-074.36e-01-0.1941
79083MLPHRNA-P25T1-P25T1-3HumanLungAIS5.39e-064.45e-01-0.2107
79083MLPHRNA-P25T1-P25T1-4HumanLungAIS1.39e-167.06e-01-0.2119
79083MLPHRNA-P6T2-P6T2-1HumanLungIAC7.31e-181.68e-01-0.0166
79083MLPHRNA-P6T2-P6T2-2HumanLungIAC1.42e-212.31e-01-0.0132
79083MLPHRNA-P6T2-P6T2-3HumanLungIAC2.50e-303.00e-01-0.013
79083MLPHRNA-P6T2-P6T2-4HumanLungIAC3.10e-152.43e-01-0.0121
79083MLPHRNA-P7T1-P7T1-1HumanLungAIS3.41e-061.21e-01-0.0961
79083MLPHRNA-P7T1-P7T1-2HumanLungAIS1.91e-082.99e-01-0.0876
79083MLPHRNA-P7T1-P7T1-3HumanLungAIS3.30e-092.54e-01-0.0822
79083MLPHRNA-P7T1-P7T1-4HumanLungAIS1.43e-041.38e-01-0.0809
79083MLPHGSM5252132_BPH389PrGFHumanProstateBPH1.10e-022.21e-01-0.2247
79083MLPHGSM5252135_BPH511PrPUr_Fcol_3GEXHumanProstateBPH3.62e-125.32e-01-0.1833
79083MLPHDong_P1HumanProstateTumor1.15e-088.25e-020.035
79083MLPHDong_P3HumanProstateTumor1.56e-071.45e-010.0278
79083MLPHDong_P4HumanProstateTumor1.54e-072.73e-010.0292
79083MLPHDong_P5HumanProstateTumor5.13e-052.16e-020.053
79083MLPHGSM5353221_PA_PB2A_Pool_1_3_S25_L001HumanProstateTumor3.86e-094.66e-010.1633
79083MLPHGSM5353222_PA_PB2B_Pool_1_3_S52_L002HumanProstateTumor1.54e-053.49e-010.1608
79083MLPHGSM5353223_PA_PB2B_Pool_2_S26_L001HumanProstateTumor9.17e-054.27e-010.1604
Page: 1 2 3 4 5 6 7 

check button Transcriptomic changes along malignancy continuum.
TissueExpression DynamicsAbbreviation
BreastThe image shows the transcriptomic changes along malignancy continuum.log2FC in expression of this searched gene in stem-like cells from each diseased tissue sample relative to stem-like cells in normal samples in each tissue plotted against the malignancy continuum. Samples are colored based on if they are from different disease stage.
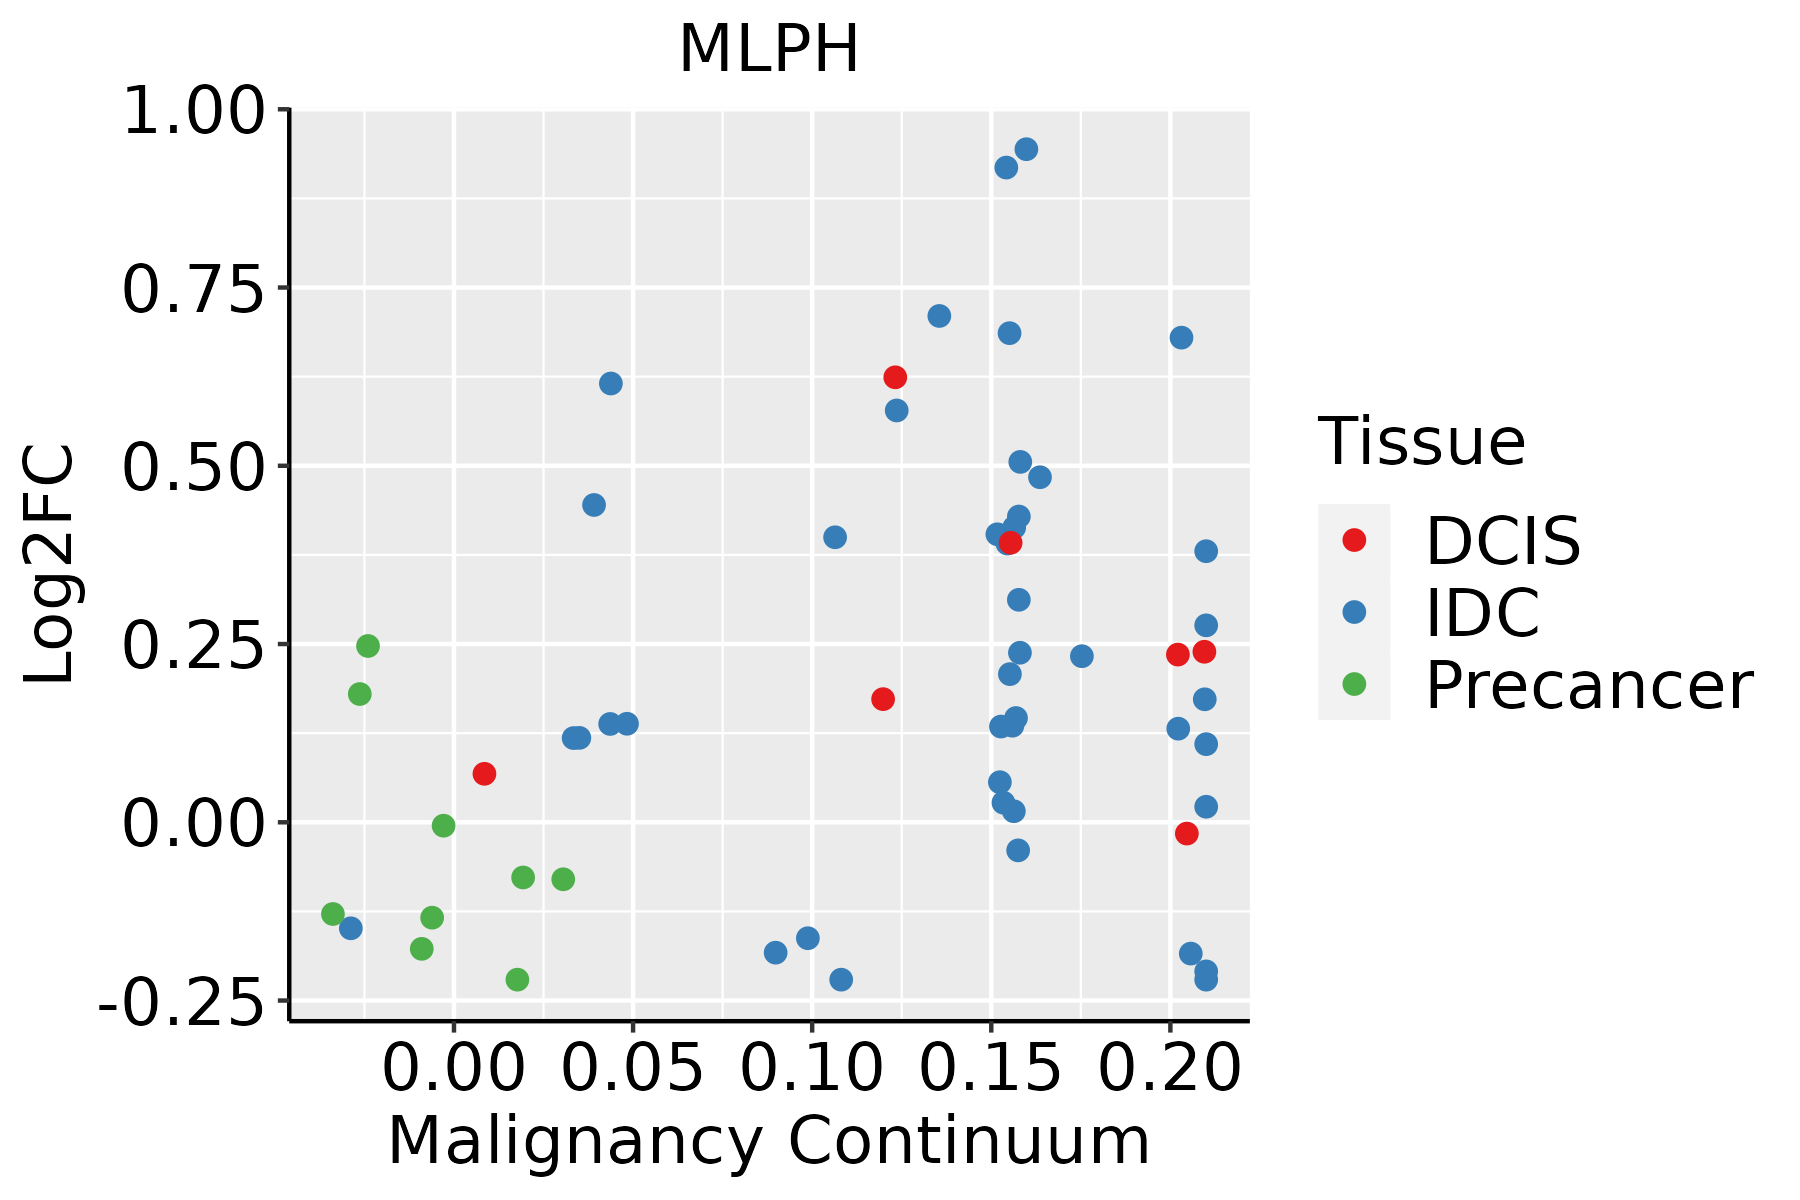
IDC: Invasive ductal carcinoma
DCIS: Ductal carcinoma in situ
Precancer(BRCA1-mut): Precancerous lesion from BRCA1 mutation carriers
Colorectum (GSE201348)The image shows the transcriptomic changes along malignancy continuum.log2FC in expression of this searched gene in stem-like cells from each diseased tissue sample relative to stem-like cells in normal samples in each tissue plotted against the malignancy continuum. Samples are colored based on if they are from different disease stage.FAP: Familial adenomatous polyposis
CRC: Colorectal cancer
Colorectum (HTA11)The image shows the transcriptomic changes along malignancy continuum.log2FC in expression of this searched gene in stem-like cells from each diseased tissue sample relative to stem-like cells in normal samples in each tissue plotted against the malignancy continuum. Samples are colored based on if they are from different disease stage.AD: Adenomas
SER: Sessile serrated lesions
MSI-H: Microsatellite-high colorectal cancer
MSS: Microsatellite stable colorectal cancer
EsophagusThe image shows the transcriptomic changes along malignancy continuum.log2FC in expression of this searched gene in stem-like cells from each diseased tissue sample relative to stem-like cells in normal samples in each tissue plotted against the malignancy continuum. Samples are colored based on if they are from different disease stage.
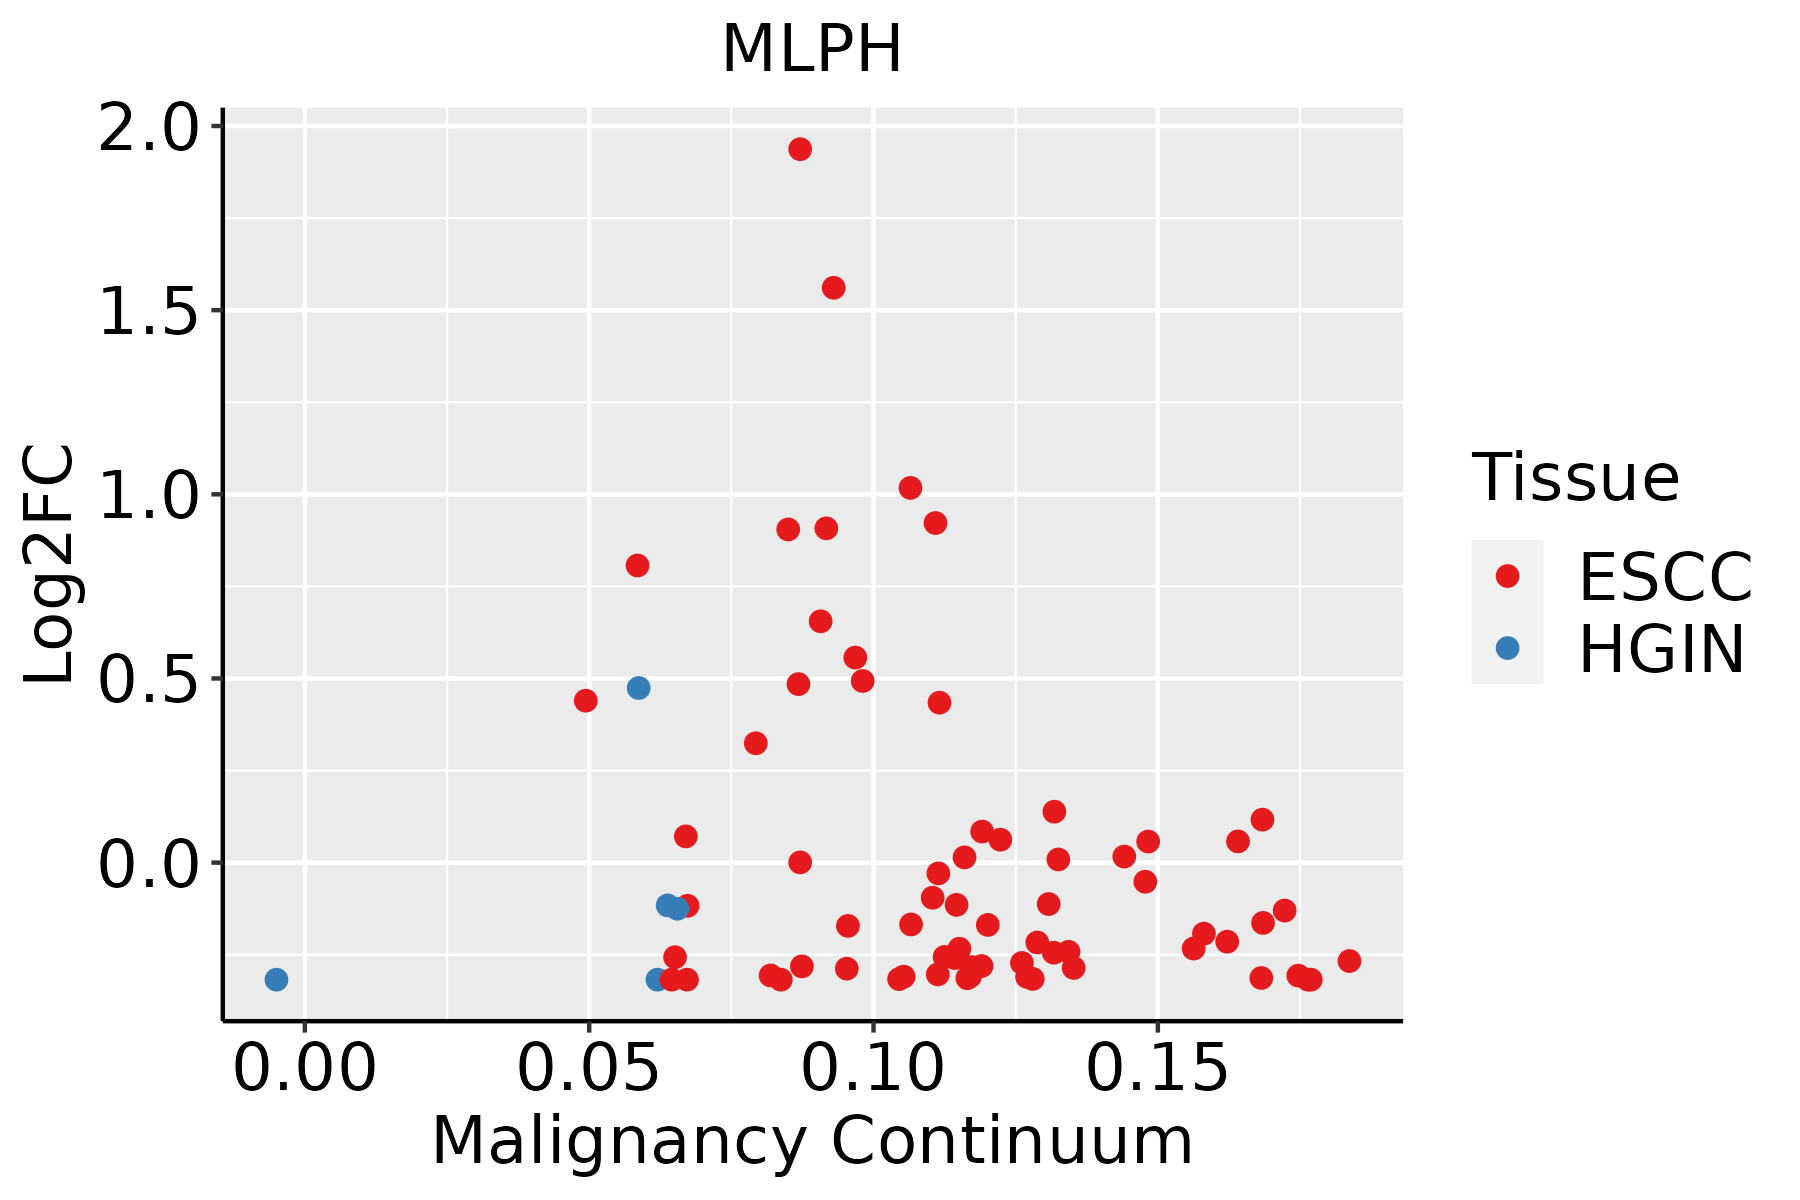
ESCC: Esophageal squamous cell carcinoma
HGIN: High-grade intraepithelial neoplasias
LGIN: Low-grade intraepithelial neoplasias
LiverThe image shows the transcriptomic changes along malignancy continuum.log2FC in expression of this searched gene in stem-like cells from each diseased tissue sample relative to stem-like cells in normal samples in each tissue plotted against the malignancy continuum. Samples are colored based on if they are from different disease stage.HCC: Hepatocellular carcinoma
NAFLD: Non-alcoholic fatty liver disease
LungThe image shows the transcriptomic changes along malignancy continuum.log2FC in expression of this searched gene in stem-like cells from each diseased tissue sample relative to stem-like cells in normal samples in each tissue plotted against the malignancy continuum. Samples are colored based on if they are from different disease stage.AAH: Atypical adenomatous hyperplasia
AIS: Adenocarcinoma in situ
IAC: Invasive lung adenocarcinoma
MIA: Minimally invasive adenocarcinoma
ProstateThe image shows the transcriptomic changes along malignancy continuum.log2FC in expression of this searched gene in stem-like cells from each diseased tissue sample relative to stem-like cells in normal samples in each tissue plotted against the malignancy continuum. Samples are colored based on if they are from different disease stage.BPH: Benign Prostatic Hyperplasia
ThyroidThe image shows the transcriptomic changes along malignancy continuum.log2FC in expression of this searched gene in stem-like cells from each diseased tissue sample relative to stem-like cells in normal samples in each tissue plotted against the malignancy continuum. Samples are colored based on if they are from different disease stage.ATC: Anaplastic thyroid cancer
HT: Hashimoto's thyroiditis
PTC: Papillary thyroid cancer
∗log2FC in expression of this searched gene in stem-like cells from each diseased tissue sample relative to stem-like cells in normal samples in each tissue plotted against the malignancy continuum. Samples are colored based on if they are from different disease stage.

Top

Malignant transformation related pathway analysis

check buttonFind out the enriched GO biological processes and KEGG pathways involved in transition from healthy to precancer to cancer
check button Figure of enriched GO biological processes.
TissueDisease StageEnriched GO biological Processes
ColorectumADGO analysis - Figure of enriched GO biological processes: Top 15 enriched GO BP terms are showed in the bar plot of each disease state in each tissue. Each row represents a significant GO biological process which is colored according to the -log10(p.adjust).
ColorectumSERGO analysis - Figure of enriched GO biological processes: Top 15 enriched GO BP terms are showed in the bar plot of each disease state in each tissue. Each row represents a significant GO biological process which is colored according to the -log10(p.adjust).
ColorectumMSSGO analysis - Figure of enriched GO biological processes: Top 15 enriched GO BP terms are showed in the bar plot of each disease state in each tissue. Each row represents a significant GO biological process which is colored according to the -log10(p.adjust).
ColorectumMSI-HGO analysis - Figure of enriched GO biological processes: Top 15 enriched GO BP terms are showed in the bar plot of each disease state in each tissue. Each row represents a significant GO biological process which is colored according to the -log10(p.adjust).
ColorectumFAPGO analysis - Figure of enriched GO biological processes: Top 15 enriched GO BP terms are showed in the bar plot of each disease state in each tissue. Each row represents a significant GO biological process which is colored according to the -log10(p.adjust).
∗Top 15 enriched GO BP terms are showed in the bar plot of each disease state in each tissue. Each row represents a significant GO biological process which is colored according to the -log10(p.adjust).
Page: 1 2 3 4 5 6 7 8 9 

check button Enriched GO biological processes.
GO IDTissueDisease StageDescriptionGene RatioBg Ratiopvaluep.adjustCount
GO:0051656ColorectumADestablishment of organelle localization131/3918390/187233.00e-092.06e-07131
GO:0051650ColorectumADestablishment of vesicle localization57/3918161/187231.47e-053.15e-0457
GO:0051648ColorectumADvesicle localization59/3918177/187237.83e-051.25e-0359
GO:00516561ColorectumSERestablishment of organelle localization100/2897390/187231.11e-076.79e-06100
GO:00516501ColorectumSERestablishment of vesicle localization42/2897161/187233.38e-045.35e-0342
GO:00516481ColorectumSERvesicle localization43/2897177/187231.41e-031.53e-0243
GO:00516563ColorectumFAPestablishment of organelle localization97/2622390/187235.91e-099.48e-0797
GO:00516503ColorectumFAPestablishment of vesicle localization48/2622161/187231.56e-079.64e-0648
GO:00516483ColorectumFAPvesicle localization50/2622177/187235.41e-072.72e-0550
GO:00516564ColorectumCRCestablishment of organelle localization76/2078390/187236.53e-074.50e-0576
GO:00516504ColorectumCRCestablishment of vesicle localization39/2078161/187231.82e-069.07e-0539
GO:00516484ColorectumCRCvesicle localization41/2078177/187233.39e-061.50e-0441
GO:005165616EsophagusHGINestablishment of organelle localization90/2587390/187234.27e-071.94e-0590
GO:005165010EsophagusHGINestablishment of vesicle localization35/2587161/187233.89e-033.54e-0235
GO:005164810EsophagusHGINvesicle localization37/2587177/187236.03e-034.87e-0237
GO:005165617EsophagusESCCestablishment of organelle localization273/8552390/187239.13e-231.81e-20273
GO:005165016EsophagusESCCestablishment of vesicle localization114/8552161/187238.20e-112.53e-09114
GO:005164815EsophagusESCCvesicle localization119/8552177/187235.16e-091.08e-07119
GO:00330593EsophagusESCCcellular pigmentation40/855253/187239.67e-069.21e-0540
GO:00434731EsophagusESCCpigmentation59/855298/187232.64e-031.12e-0259
Page: 1 2 3 

check button Enriched KEGG pathways.
Pathway IDTissueDisease StageDescriptionGene RatioBg Ratiopvaluep.adjustqvalueCount
Page: 1 

Top

Cell-cell communication analysis

check buttonIdentification of potential cell-cell interactions between two cell types and their ligand-receptor pairs for different disease states
LigandReceptorLRpairPathwayTissueDisease Stage
Page: 1 

Top

Single-cell gene regulatory network inference analysis

check buttonFind out the significant the regulons (TFs) and the target genes of each regulon across cell types for different disease states
TFCell TypeTissueDisease StageTarget GeneRSSRegulon Activity
∗The dot plots of a searched regulon are shown for all cell subpopulations in each disease state of each tissue based on the regulon specific score inferred using pySCENIC and by calculating the average expression.
Page: 1 

Top

Somatic mutation of malignant transformation related genes

check buttonAnnotation of somatic variants for genes involved in malignant transformation
Hugo SymbolVariant ClassVariant ClassificationdbSNP RSHGVScHGVSpHGVSp ShortSWISSPROTBIOTYPESIFTPolyPhenTumor Sample BarcodeTissueHistologySexAgeStageTherapy TypesDrugsOutcome
MLPHSNVMissense_Mutationrs371642307c.592N>Cp.Glu198Glnp.E198QQ9BV36protein_codingdeleterious(0.02)probably_damaging(0.981)TCGA-A2-A25A-01Breastbreast invasive carcinomaFemale<65I/IIUnspecificCytoxanSD
MLPHSNVMissense_Mutationc.943N>Ap.Asp315Asnp.D315NQ9BV36protein_codingdeleterious(0)probably_damaging(0.972)TCGA-AO-A0J3-01Breastbreast invasive carcinomaFemale>=65I/IIChemotherapycyclophosphamideSD
MLPHSNVMissense_Mutationc.404C>Tp.Ala135Valp.A135VQ9BV36protein_codingdeleterious(0)probably_damaging(0.973)TCGA-BH-A18G-01Breastbreast invasive carcinomaFemale>=65I/IIUnknownUnknownSD
MLPHSNVMissense_Mutationnovelc.894N>Gp.Ile298Metp.I298MQ9BV36protein_codingtolerated(0.22)benign(0.143)TCGA-C8-A8HQ-01Breastbreast invasive carcinomaFemale<65I/IIUnknownUnknownSD
MLPHSNVMissense_Mutationc.943G>Ap.Asp315Asnp.D315NQ9BV36protein_codingdeleterious(0)probably_damaging(0.972)TCGA-GM-A2D9-01Breastbreast invasive carcinomaFemale>=65I/IIHormone TherapyarimidexSD
MLPHSNVMissense_Mutationc.278N>Ap.Gly93Aspp.G93DQ9BV36protein_codingdeleterious(0.02)benign(0.372)TCGA-GM-A2DH-01Breastbreast invasive carcinomaFemale<65I/IIChemotherapytaxolCR
MLPHSNVMissense_Mutationnovelc.1045N>Ap.Ser349Thrp.S349TQ9BV36protein_codingtolerated(0.11)benign(0.272)TCGA-LL-A8F5-01Breastbreast invasive carcinomaFemale<65I/IIChemotherapycyclophosphamideSD
MLPHinsertionFrame_Shift_Insnovelc.784_785insAAGTGp.Pro262GlnfsTer64p.P262Qfs*64Q9BV36protein_codingTCGA-AQ-A04J-01Breastbreast invasive carcinomaFemale<65I/IIChemotherapycytoxanSD
MLPHinsertionFrame_Shift_Insnovelc.785_786insCTGGAAAGCCTCAGGGCTTGp.Thr263TrpfsTer68p.T263Wfs*68Q9BV36protein_codingTCGA-AQ-A04J-01Breastbreast invasive carcinomaFemale<65I/IIChemotherapycytoxanSD
MLPHSNVMissense_Mutationrs767964025c.147N>Cp.Lys49Asnp.K49NQ9BV36protein_codingdeleterious(0)probably_damaging(0.944)TCGA-EK-A2RJ-01Cervixcervical & endocervical cancerFemale<65I/IIUnknownUnknownSD
Page: 1 2 3 4 5 6 

Top

Related drugs of malignant transformation related genes

check buttonIdentification of chemicals and drugs interact with genes involved in malignant transfromation
(DGIdb 4.0)
Entrez IDSymbolCategoryInteraction TypesDrug Claim NameDrug NamePMIDs
Page: 1