
|
|||||
|
 | |
| |
| |
| |
| |
| |
|
Gene: MLF2 |
Gene summary for MLF2 |
| Gene information | Species | Human | Gene symbol | MLF2 | Gene ID | 8079 |
| Gene name | myeloid leukemia factor 2 | |
| Gene Alias | NTN4 | |
| Cytomap | 12p13.31 | |
| Gene Type | protein-coding | GO ID | GO:0006139 | UniProtAcc | A8K1F4 |
Top |
Malignant transformation analysis |
| Identification of the aberrant gene expression in precancerous and cancerous lesions by comparing the gene expression of stem-like cells in diseased tissues with normal stem cells |
| Entrez ID | Symbol | Replicates | Species | Organ | Tissue | Adj P-value | Log2FC | Malignancy |
| 8079 | MLF2 | P62T-E | Human | Esophagus | ESCC | 6.43e-123 | 2.53e+00 | 0.1302 |
| 8079 | MLF2 | P65T-E | Human | Esophagus | ESCC | 2.82e-58 | 1.32e+00 | 0.0978 |
| 8079 | MLF2 | P74T-E | Human | Esophagus | ESCC | 1.32e-69 | 2.64e+00 | 0.1479 |
| 8079 | MLF2 | P75T-E | Human | Esophagus | ESCC | 8.46e-50 | 1.50e+00 | 0.1125 |
| 8079 | MLF2 | P76T-E | Human | Esophagus | ESCC | 7.63e-98 | 2.22e+00 | 0.1207 |
| 8079 | MLF2 | P79T-E | Human | Esophagus | ESCC | 8.11e-97 | 2.18e+00 | 0.1154 |
| 8079 | MLF2 | P80T-E | Human | Esophagus | ESCC | 3.37e-68 | 2.91e+00 | 0.155 |
| 8079 | MLF2 | P82T-E | Human | Esophagus | ESCC | 9.99e-33 | 2.19e+00 | 0.1072 |
| 8079 | MLF2 | P83T-E | Human | Esophagus | ESCC | 1.46e-74 | 3.62e+00 | 0.1738 |
| 8079 | MLF2 | P84T-E | Human | Esophagus | ESCC | 6.40e-26 | 2.01e+00 | 0.0933 |
| 8079 | MLF2 | P89T-E | Human | Esophagus | ESCC | 4.82e-33 | 3.30e+00 | 0.1752 |
| 8079 | MLF2 | P91T-E | Human | Esophagus | ESCC | 2.30e-24 | 3.22e+00 | 0.1828 |
| 8079 | MLF2 | P94T-E | Human | Esophagus | ESCC | 1.25e-04 | 1.43e+00 | 0.0879 |
| 8079 | MLF2 | P104T-E | Human | Esophagus | ESCC | 4.72e-03 | 1.14e+00 | 0.0931 |
| 8079 | MLF2 | P107T-E | Human | Esophagus | ESCC | 7.57e-91 | 2.81e+00 | 0.171 |
| 8079 | MLF2 | P126T-E | Human | Esophagus | ESCC | 1.80e-20 | 2.28e+00 | 0.1125 |
| 8079 | MLF2 | P127T-E | Human | Esophagus | ESCC | 2.52e-67 | 1.33e+00 | 0.0826 |
| 8079 | MLF2 | P128T-E | Human | Esophagus | ESCC | 8.02e-63 | 2.21e+00 | 0.1241 |
| 8079 | MLF2 | P130T-E | Human | Esophagus | ESCC | 8.61e-101 | 2.91e+00 | 0.1676 |
| 8079 | MLF2 | S43 | Human | Liver | Cirrhotic | 9.41e-09 | -3.22e-01 | -0.0187 |
| Page: 1 2 3 4 5 6 7 8 9 10 |
| Tissue | Expression Dynamics | Abbreviation |
| Colorectum (GSE201348) |  | FAP: Familial adenomatous polyposis |
| CRC: Colorectal cancer | ||
| Colorectum (HTA11) |  | AD: Adenomas |
| SER: Sessile serrated lesions | ||
| MSI-H: Microsatellite-high colorectal cancer | ||
| MSS: Microsatellite stable colorectal cancer | ||
| Endometrium | 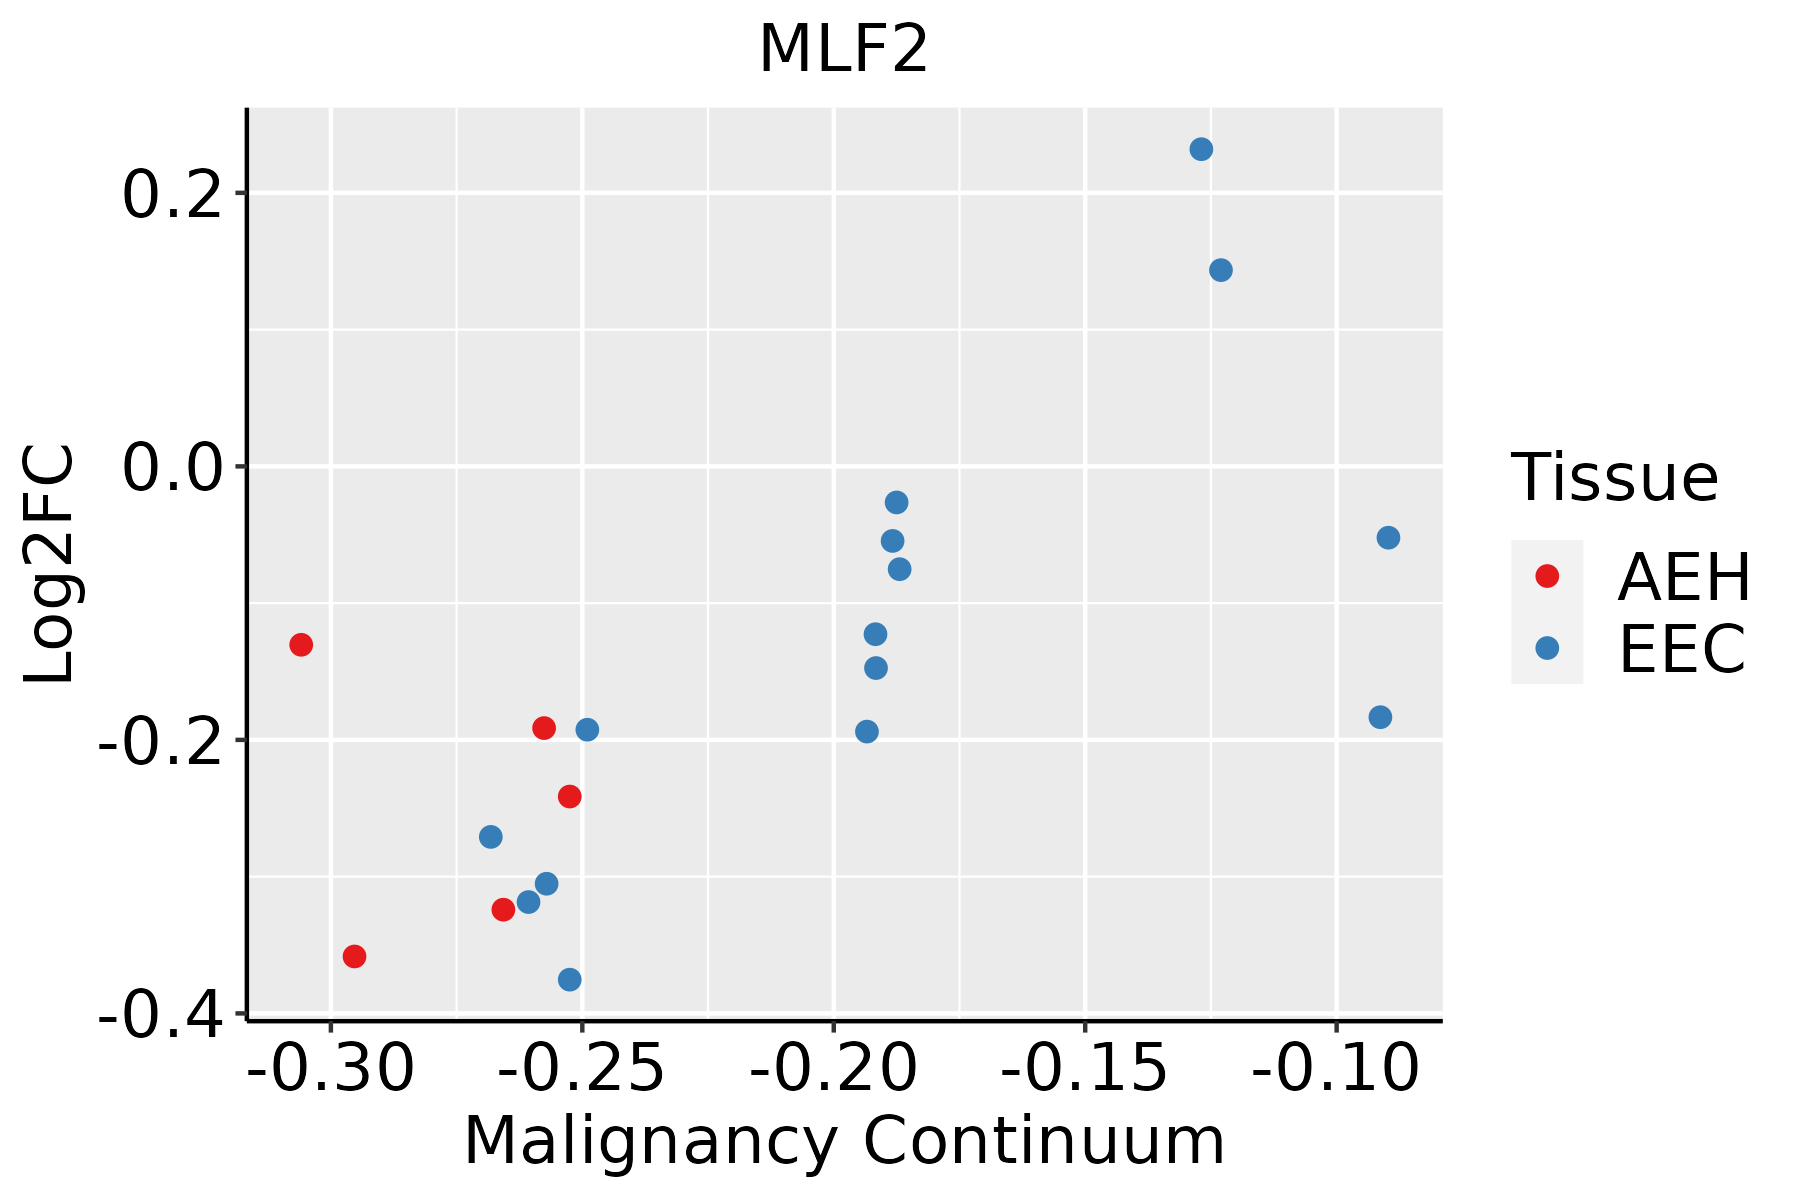 | AEH: Atypical endometrial hyperplasia |
| EEC: Endometrioid Cancer | ||
| Esophagus | 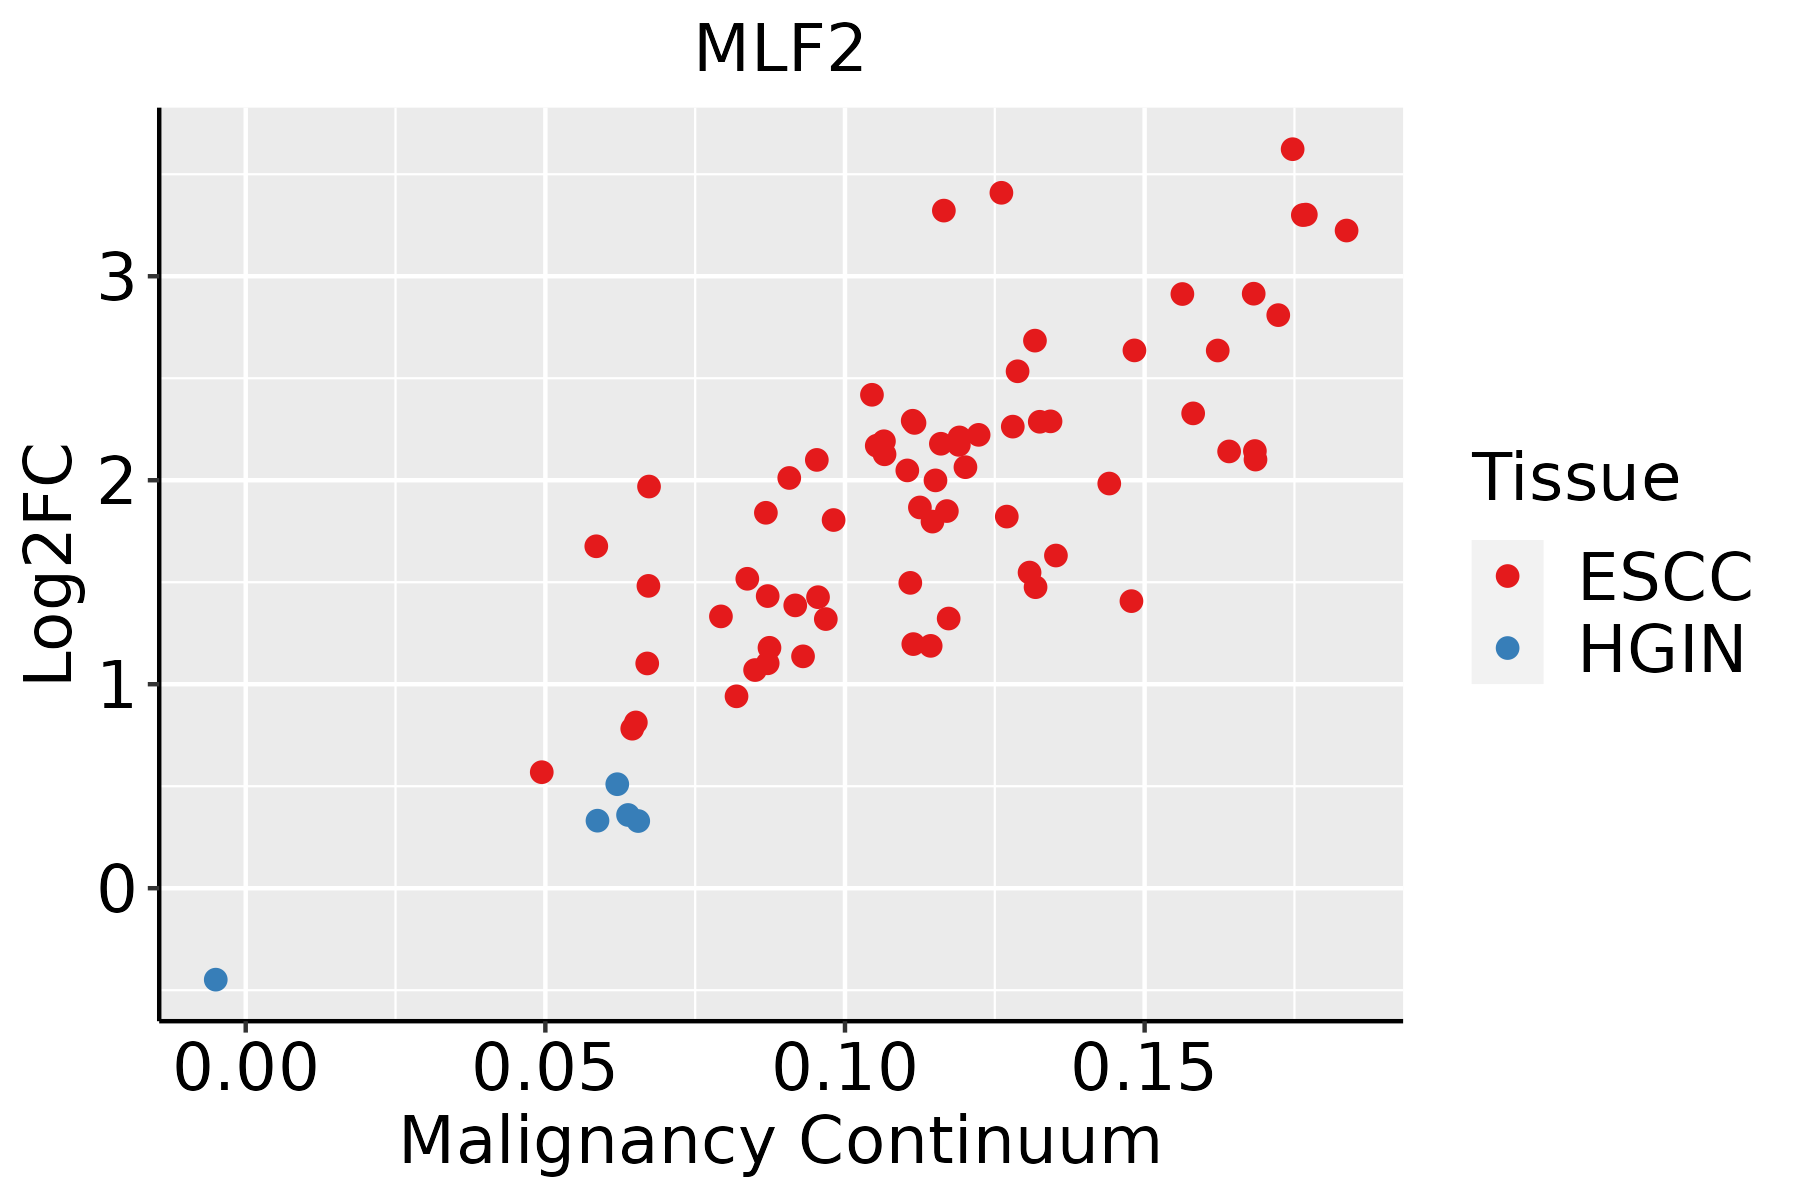 | ESCC: Esophageal squamous cell carcinoma |
| HGIN: High-grade intraepithelial neoplasias | ||
| LGIN: Low-grade intraepithelial neoplasias | ||
| Liver | 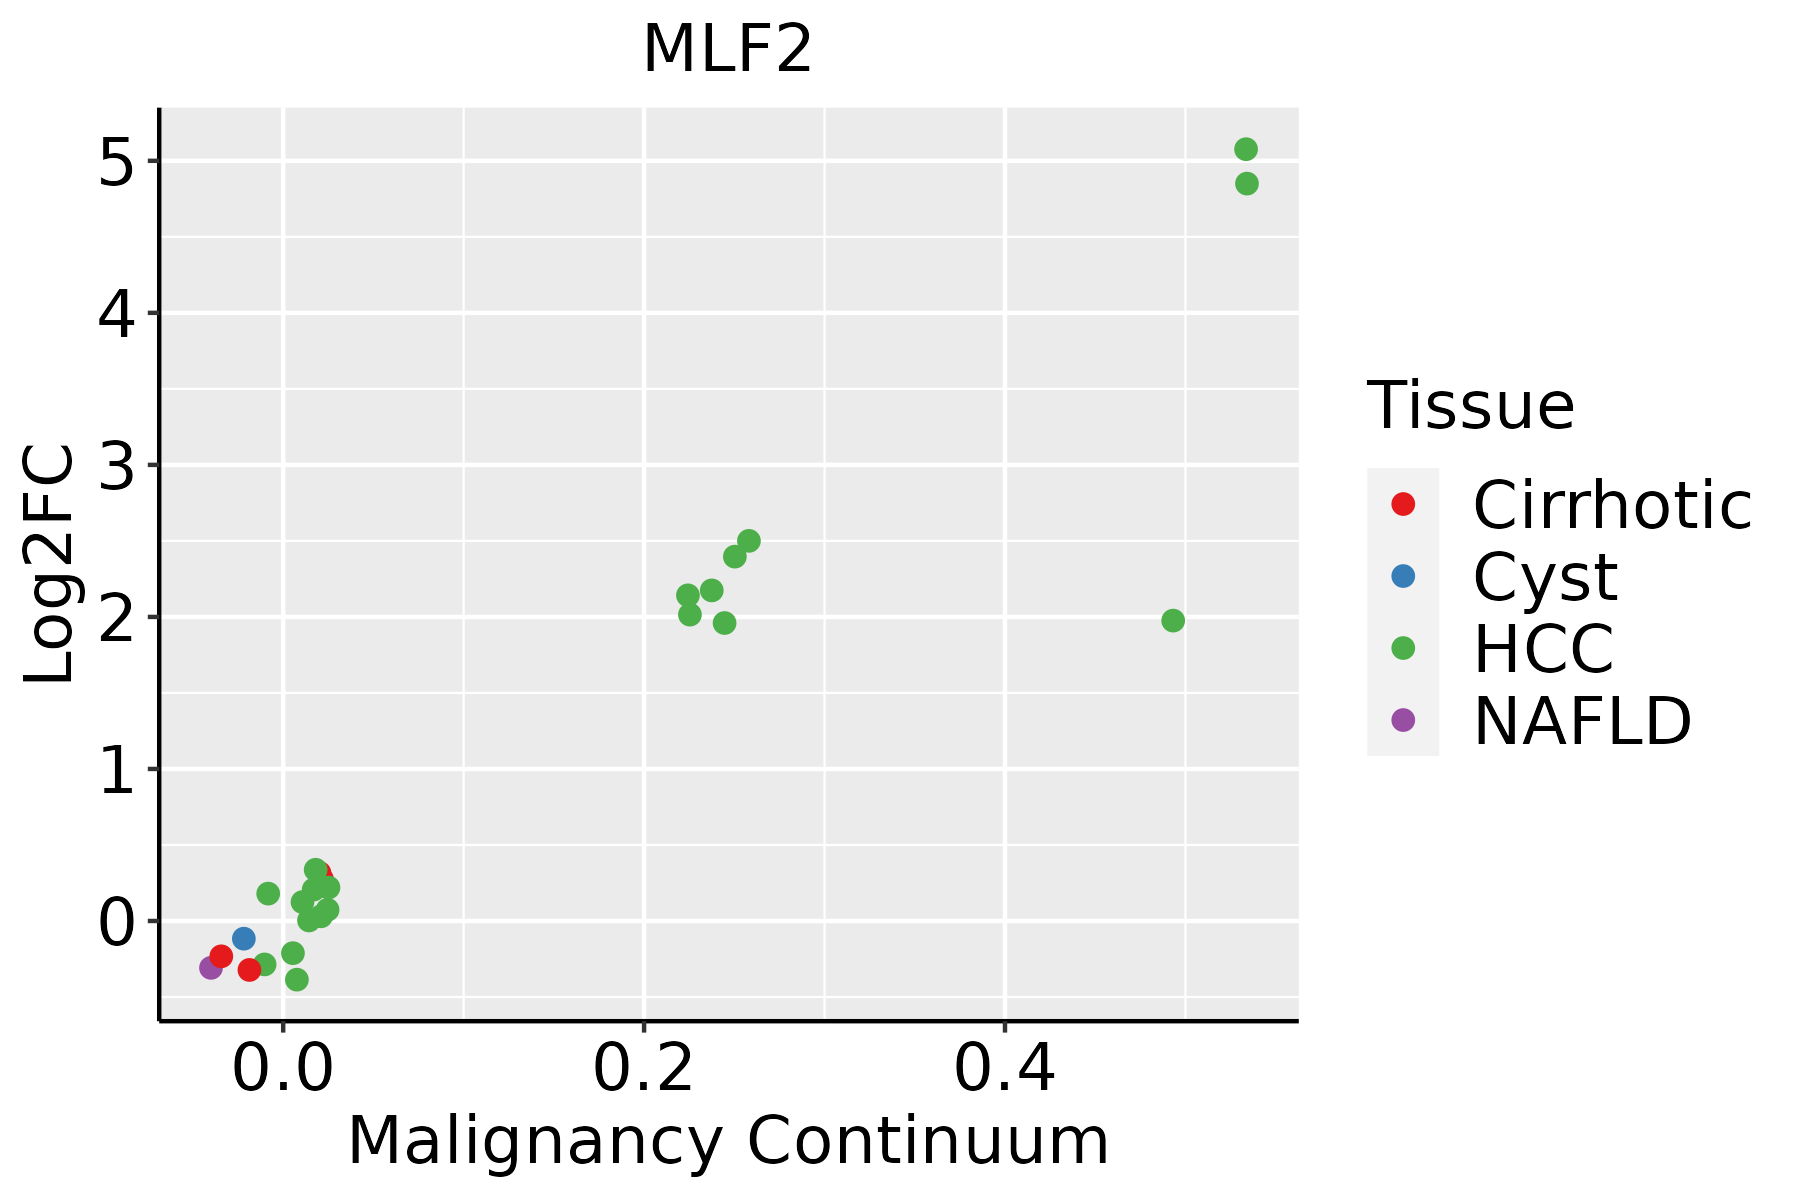 | HCC: Hepatocellular carcinoma |
| NAFLD: Non-alcoholic fatty liver disease | ||
| Oral Cavity | 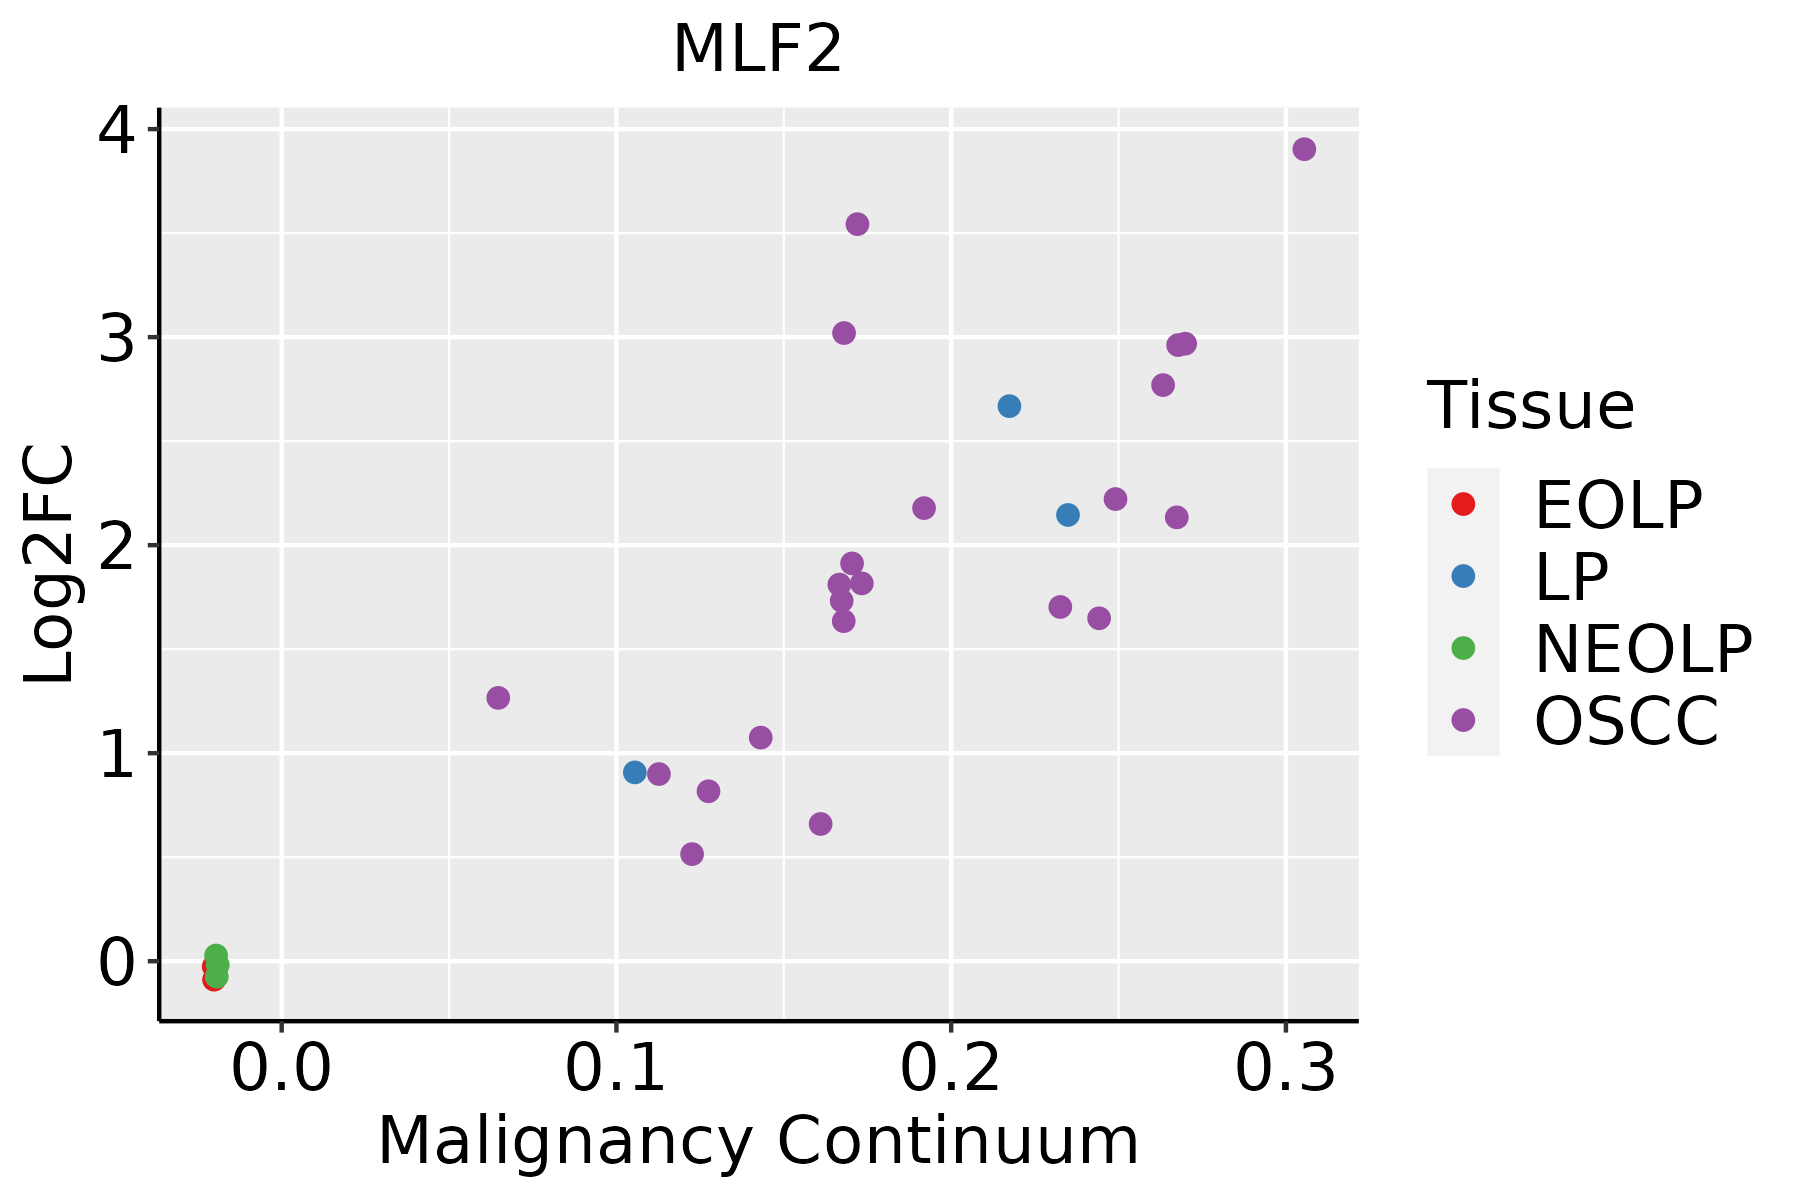 | EOLP: Erosive Oral lichen planus |
| LP: leukoplakia | ||
| NEOLP: Non-erosive oral lichen planus | ||
| OSCC: Oral squamous cell carcinoma | ||
| Prostate | 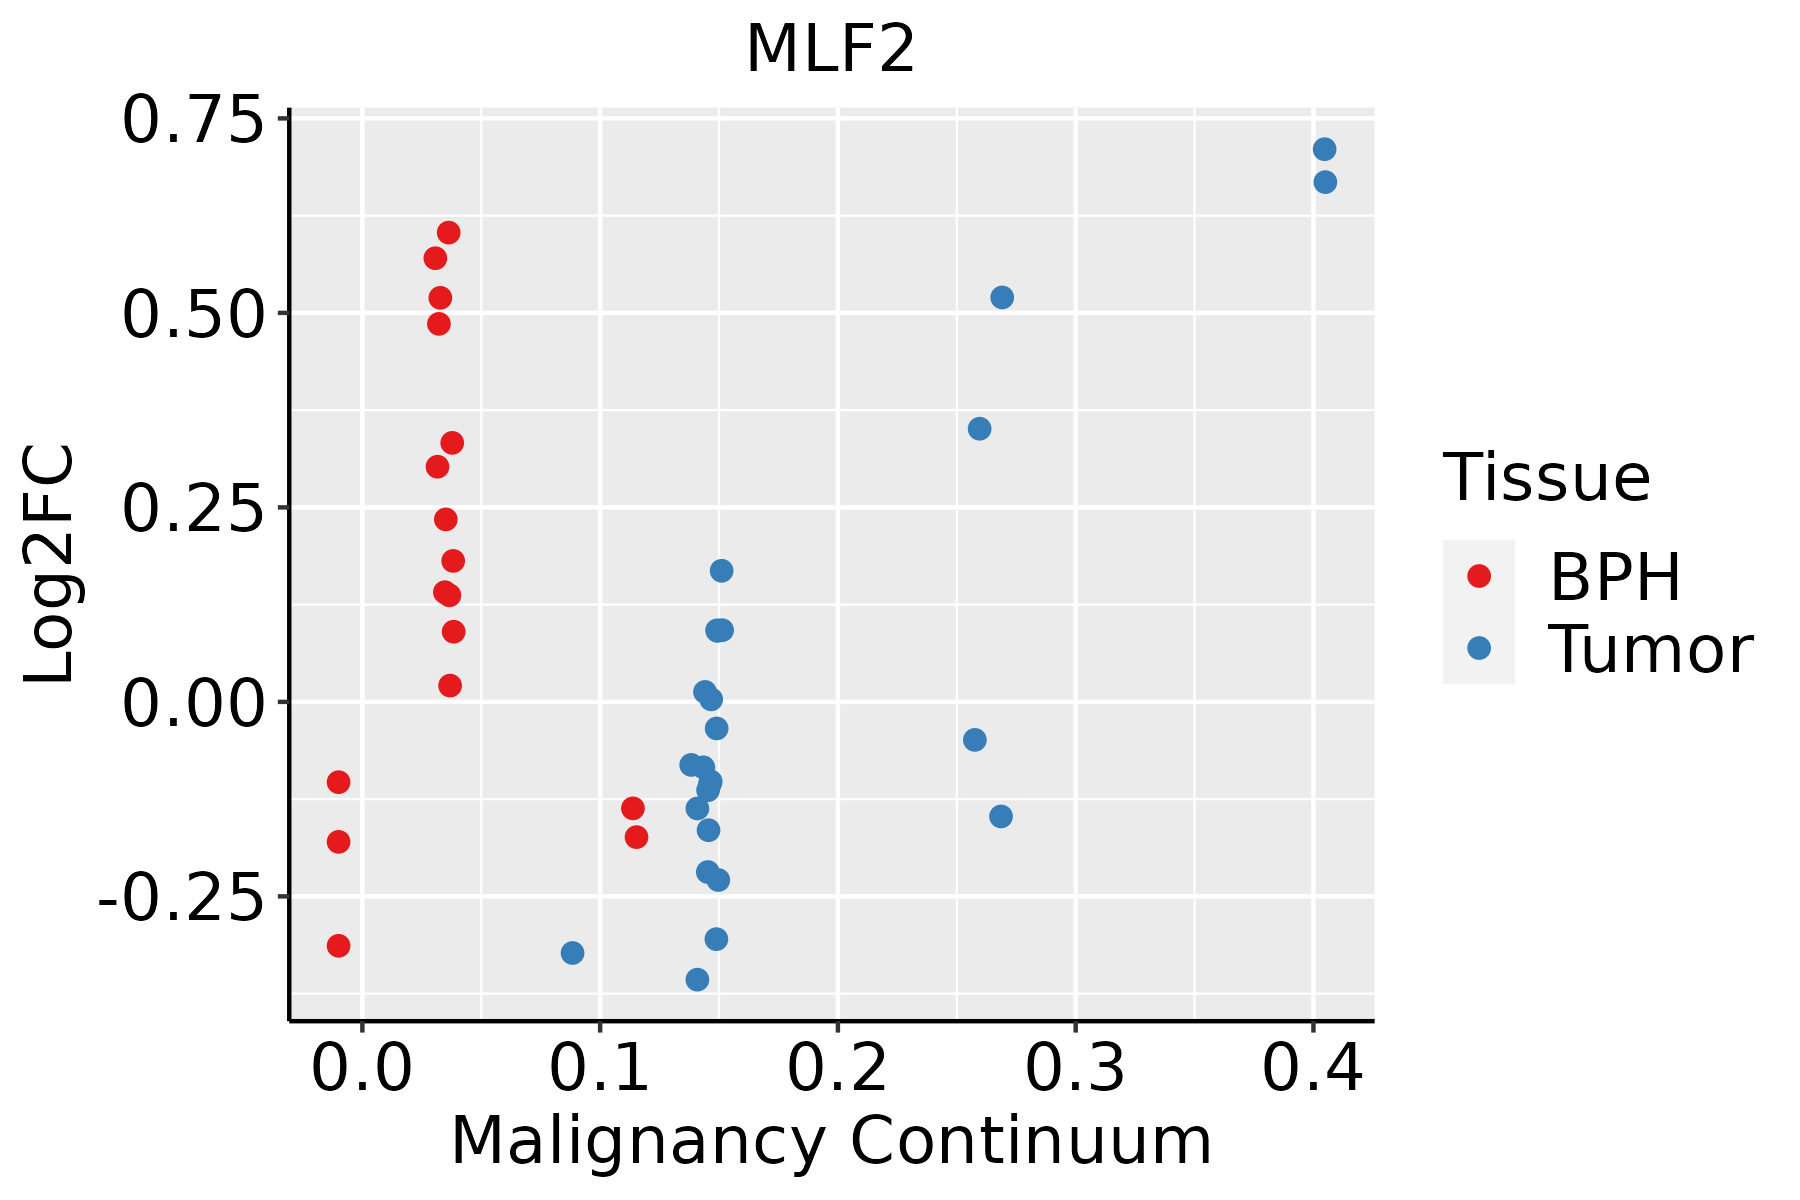 | BPH: Benign Prostatic Hyperplasia |
| Skin | 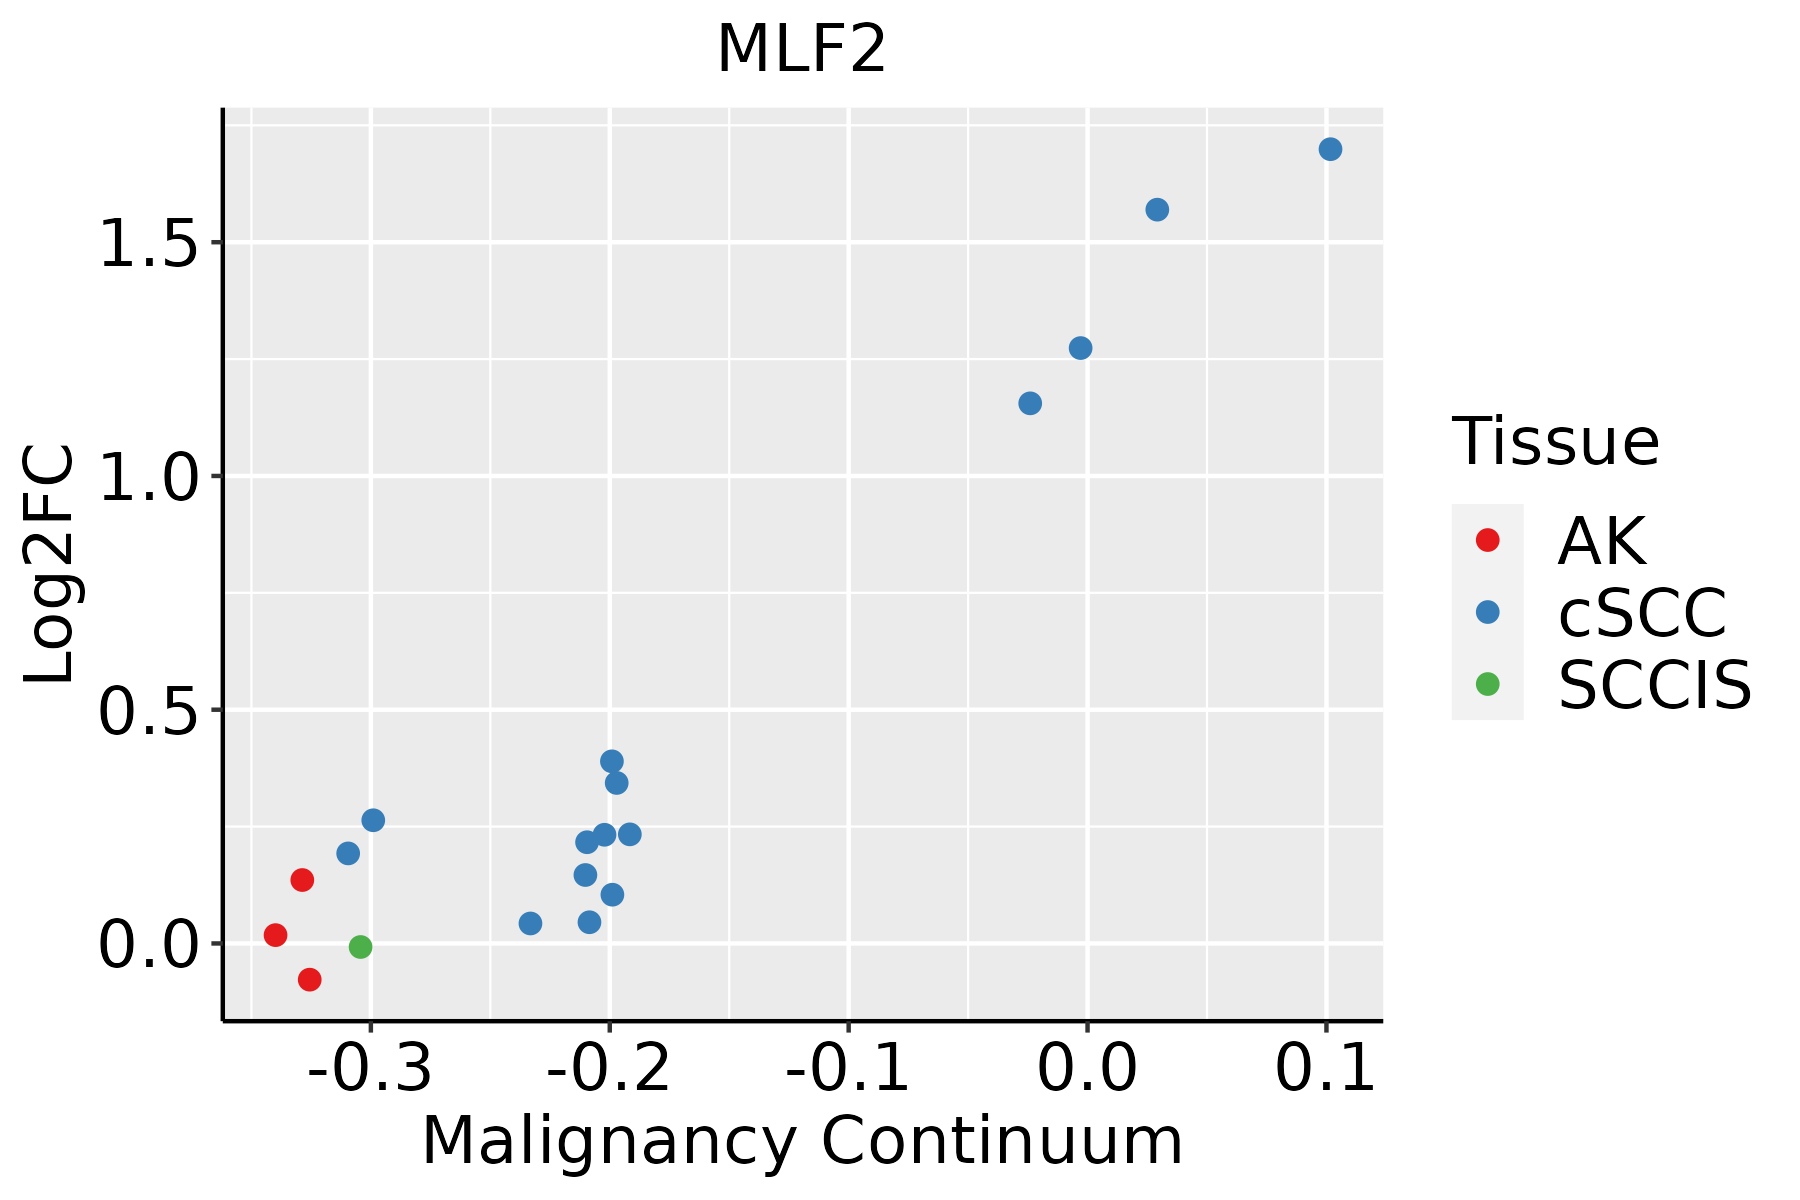 | AK: Actinic keratosis |
| cSCC: Cutaneous squamous cell carcinoma | ||
| SCCIS:squamous cell carcinoma in situ | ||
| Thyroid |  | ATC: Anaplastic thyroid cancer |
| HT: Hashimoto's thyroiditis | ||
| PTC: Papillary thyroid cancer |
| ∗log2FC in expression of this searched gene in stem-like cells from each diseased tissue sample relative to stem-like cells in normal samples in each tissue plotted against the malignancy continuum. Samples are colored based on if they are from different disease stage. |
Top |
Malignant transformation related pathway analysis |
| Find out the enriched GO biological processes and KEGG pathways involved in transition from healthy to precancer to cancer |
| Tissue | Disease Stage | Enriched GO biological Processes |
| Colorectum | AD |  |
| Colorectum | SER |  |
| Colorectum | MSS |  |
| Colorectum | MSI-H |  |
| Colorectum | FAP |  |
| ∗Top 15 enriched GO BP terms are showed in the bar plot of each disease state in each tissue. Each row represents a significant GO biological process which is colored according to the -log10(p.adjust). |
| Page: 1 2 3 4 5 6 7 8 9 |
| GO ID | Tissue | Disease Stage | Description | Gene Ratio | Bg Ratio | pvalue | p.adjust | Count |
| Page: 1 |
| Pathway ID | Tissue | Disease Stage | Description | Gene Ratio | Bg Ratio | pvalue | p.adjust | qvalue | Count |
| Page: 1 |
Top |
Cell-cell communication analysis |
| Identification of potential cell-cell interactions between two cell types and their ligand-receptor pairs for different disease states |
| Ligand | Receptor | LRpair | Pathway | Tissue | Disease Stage |
| Page: 1 |
Top |
Single-cell gene regulatory network inference analysis |
| Find out the significant the regulons (TFs) and the target genes of each regulon across cell types for different disease states |
| TF | Cell Type | Tissue | Disease Stage | Target Gene | RSS | Regulon Activity |
| ∗The dot plots of a searched regulon are shown for all cell subpopulations in each disease state of each tissue based on the regulon specific score inferred using pySCENIC and by calculating the average expression. |
| Page: 1 |
Top |
Somatic mutation of malignant transformation related genes |
| Annotation of somatic variants for genes involved in malignant transformation |
| Hugo Symbol | Variant Class | Variant Classification | dbSNP RS | HGVSc | HGVSp | HGVSp Short | SWISSPROT | BIOTYPE | SIFT | PolyPhen | Tumor Sample Barcode | Tissue | Histology | Sex | Age | Stage | Therapy Types | Drugs | Outcome |
| MLF2 | deletion | Frame_Shift_Del | novel | c.685delN | p.Arg229AlafsTer56 | p.R229Afs*56 | Q15773 | protein_coding | TCGA-D8-A27V-01 | Breast | breast invasive carcinoma | Female | <65 | I/II | Hormone Therapy | tamoxiphen | SD | ||
| MLF2 | SNV | Missense_Mutation | novel | c.682N>T | p.Pro228Ser | p.P228S | Q15773 | protein_coding | tolerated(0.3) | benign(0.018) | TCGA-EK-A2RJ-01 | Cervix | cervical & endocervical cancer | Female | <65 | I/II | Unknown | Unknown | SD |
| MLF2 | SNV | Missense_Mutation | novel | c.134N>G | p.Asp45Gly | p.D45G | Q15773 | protein_coding | deleterious(0.03) | benign(0.099) | TCGA-AZ-4315-01 | Colorectum | colon adenocarcinoma | Male | <65 | I/II | Unknown | Unknown | SD |
| MLF2 | SNV | Missense_Mutation | c.520G>C | p.Asp174His | p.D174H | Q15773 | protein_coding | deleterious(0) | probably_damaging(0.983) | TCGA-CK-5912-01 | Colorectum | colon adenocarcinoma | Male | >=65 | I/II | Unknown | Unknown | SD | |
| MLF2 | SNV | Missense_Mutation | c.249N>A | p.Met83Ile | p.M83I | Q15773 | protein_coding | tolerated(0.07) | probably_damaging(0.95) | TCGA-CM-6172-01 | Colorectum | colon adenocarcinoma | Female | >=65 | III/IV | Ancillary | leucovorin | SD | |
| MLF2 | SNV | Missense_Mutation | c.512G>A | p.Arg171His | p.R171H | Q15773 | protein_coding | deleterious(0.05) | benign(0.042) | TCGA-CM-6674-01 | Colorectum | colon adenocarcinoma | Male | <65 | I/II | Unknown | Unknown | SD | |
| MLF2 | SNV | Missense_Mutation | rs745833590 | c.412N>T | p.Arg138Trp | p.R138W | Q15773 | protein_coding | deleterious(0) | probably_damaging(0.995) | TCGA-F4-6570-01 | Colorectum | colon adenocarcinoma | Female | >=65 | I/II | Unknown | Unknown | SD |
| MLF2 | insertion | Frame_Shift_Ins | novel | c.475dupG | p.Asp159GlyfsTer28 | p.D159Gfs*28 | Q15773 | protein_coding | TCGA-G4-6309-01 | Colorectum | colon adenocarcinoma | Female | <65 | III/IV | Chemotherapy | xeloda | PD | ||
| MLF2 | SNV | Missense_Mutation | novel | c.254A>C | p.Asp85Ala | p.D85A | Q15773 | protein_coding | tolerated(0.12) | benign(0.258) | TCGA-A5-A0G2-01 | Endometrium | uterine corpus endometrioid carcinoma | Female | <65 | III/IV | Unknown | Unknown | SD |
| MLF2 | SNV | Missense_Mutation | rs749240926 | c.566N>T | p.Ala189Val | p.A189V | Q15773 | protein_coding | deleterious(0.04) | possibly_damaging(0.87) | TCGA-AJ-A3EK-01 | Endometrium | uterine corpus endometrioid carcinoma | Female | <65 | I/II | Chemotherapy | carboplatin | CR |
| Page: 1 2 3 4 |
Top |
Related drugs of malignant transformation related genes |
| Identification of chemicals and drugs interact with genes involved in malignant transfromation |
| (DGIdb 4.0) |
| Entrez ID | Symbol | Category | Interaction Types | Drug Claim Name | Drug Name | PMIDs |
| Page: 1 |

Copyright 2023-Present -The University of Texas Health Science Center at Houston |