
|
|||||
|
 | |
| |
| |
| |
| |
| |
|
Gene: MIR205HG |
Gene summary for MIR205HG |
| Gene information | Species | Human | Gene symbol | MIR205HG | Gene ID | 642587 |
| Gene name | MIR205 host gene | |
| Gene Alias | LINC00510 | |
| Cytomap | 1q32.2 | |
| Gene Type | ncRNA | GO ID | NA | UniProtAcc | NA |
Top |
Malignant transformation analysis |
| Identification of the aberrant gene expression in precancerous and cancerous lesions by comparing the gene expression of stem-like cells in diseased tissues with normal stem cells |
| Entrez ID | Symbol | Replicates | Species | Organ | Tissue | Adj P-value | Log2FC | Malignancy |
| 642587 | MIR205HG | GSM5252136_BPH556PrGA1_Fcol | Human | Prostate | BPH | 1.99e-14 | 1.99e+00 | -0.23 |
| 642587 | MIR205HG | GSM5252137_BPH556PrGA2_Fcol | Human | Prostate | BPH | 3.85e-17 | 2.45e+00 | -0.23 |
| 642587 | MIR205HG | 047563_1562-all-cells | Human | Prostate | BPH | 6.29e-45 | -8.27e-01 | 0.0791 |
| 642587 | MIR205HG | 048752_1579-all-cells | Human | Prostate | BPH | 9.26e-07 | -2.63e-01 | 0.1008 |
| 642587 | MIR205HG | 052095_1628-all-cells | Human | Prostate | BPH | 2.42e-02 | -1.35e-01 | 0.1032 |
| 642587 | MIR205HG | Dong_P1 | Human | Prostate | Tumor | 7.56e-131 | -1.64e+00 | 0.035 |
| 642587 | MIR205HG | Dong_P3 | Human | Prostate | Tumor | 2.34e-74 | -1.64e+00 | 0.0278 |
| 642587 | MIR205HG | Dong_P4 | Human | Prostate | Tumor | 8.64e-32 | -1.64e+00 | 0.0292 |
| 642587 | MIR205HG | Dong_P5 | Human | Prostate | Tumor | 7.56e-131 | -1.64e+00 | 0.053 |
| 642587 | MIR205HG | Dong_P6 | Human | Prostate | Tumor | 4.26e-51 | -1.64e+00 | 0.0371 |
| 642587 | MIR205HG | P7 | Human | Prostate | Tumor | 3.38e-34 | -1.64e+00 | -0.1025 |
| 642587 | MIR205HG | P9 | Human | Prostate | Tumor | 6.02e-57 | -1.64e+00 | -0.0285 |
| 642587 | MIR205HG | P10 | Human | Prostate | Tumor | 1.40e-61 | -1.64e+00 | -0.0902 |
| 642587 | MIR205HG | GSM5353216_PA_PB1A_Pool_1_3_S50_L002 | Human | Prostate | Tumor | 1.71e-08 | -1.21e+00 | 0.159 |
| 642587 | MIR205HG | GSM5353217_PA_PB1A_Pool_2_S107_L004 | Human | Prostate | Tumor | 4.68e-02 | -9.13e-01 | 0.156 |
| 642587 | MIR205HG | GSM5353218_PA_PB1B_Pool_1_2_S74_L003 | Human | Prostate | Tumor | 4.16e-07 | -1.24e+00 | 0.1479 |
| 642587 | MIR205HG | GSM5353220_PA_PB1B_Pool_3_S51_L002 | Human | Prostate | Tumor | 6.65e-08 | -1.11e+00 | 0.1531 |
| 642587 | MIR205HG | GSM5353221_PA_PB2A_Pool_1_3_S25_L001 | Human | Prostate | Tumor | 3.07e-02 | -4.29e-01 | 0.1633 |
| 642587 | MIR205HG | GSM5353222_PA_PB2B_Pool_1_3_S52_L002 | Human | Prostate | Tumor | 3.20e-05 | -4.62e-01 | 0.1608 |
| 642587 | MIR205HG | GSM5353224_PA_PR5186_Pool_1_2_3_S27_L001 | Human | Prostate | Tumor | 1.16e-02 | -4.65e-01 | 0.1621 |
| Page: 1 2 3 4 5 6 7 8 |
| Tissue | Expression Dynamics | Abbreviation |
| Cervix | 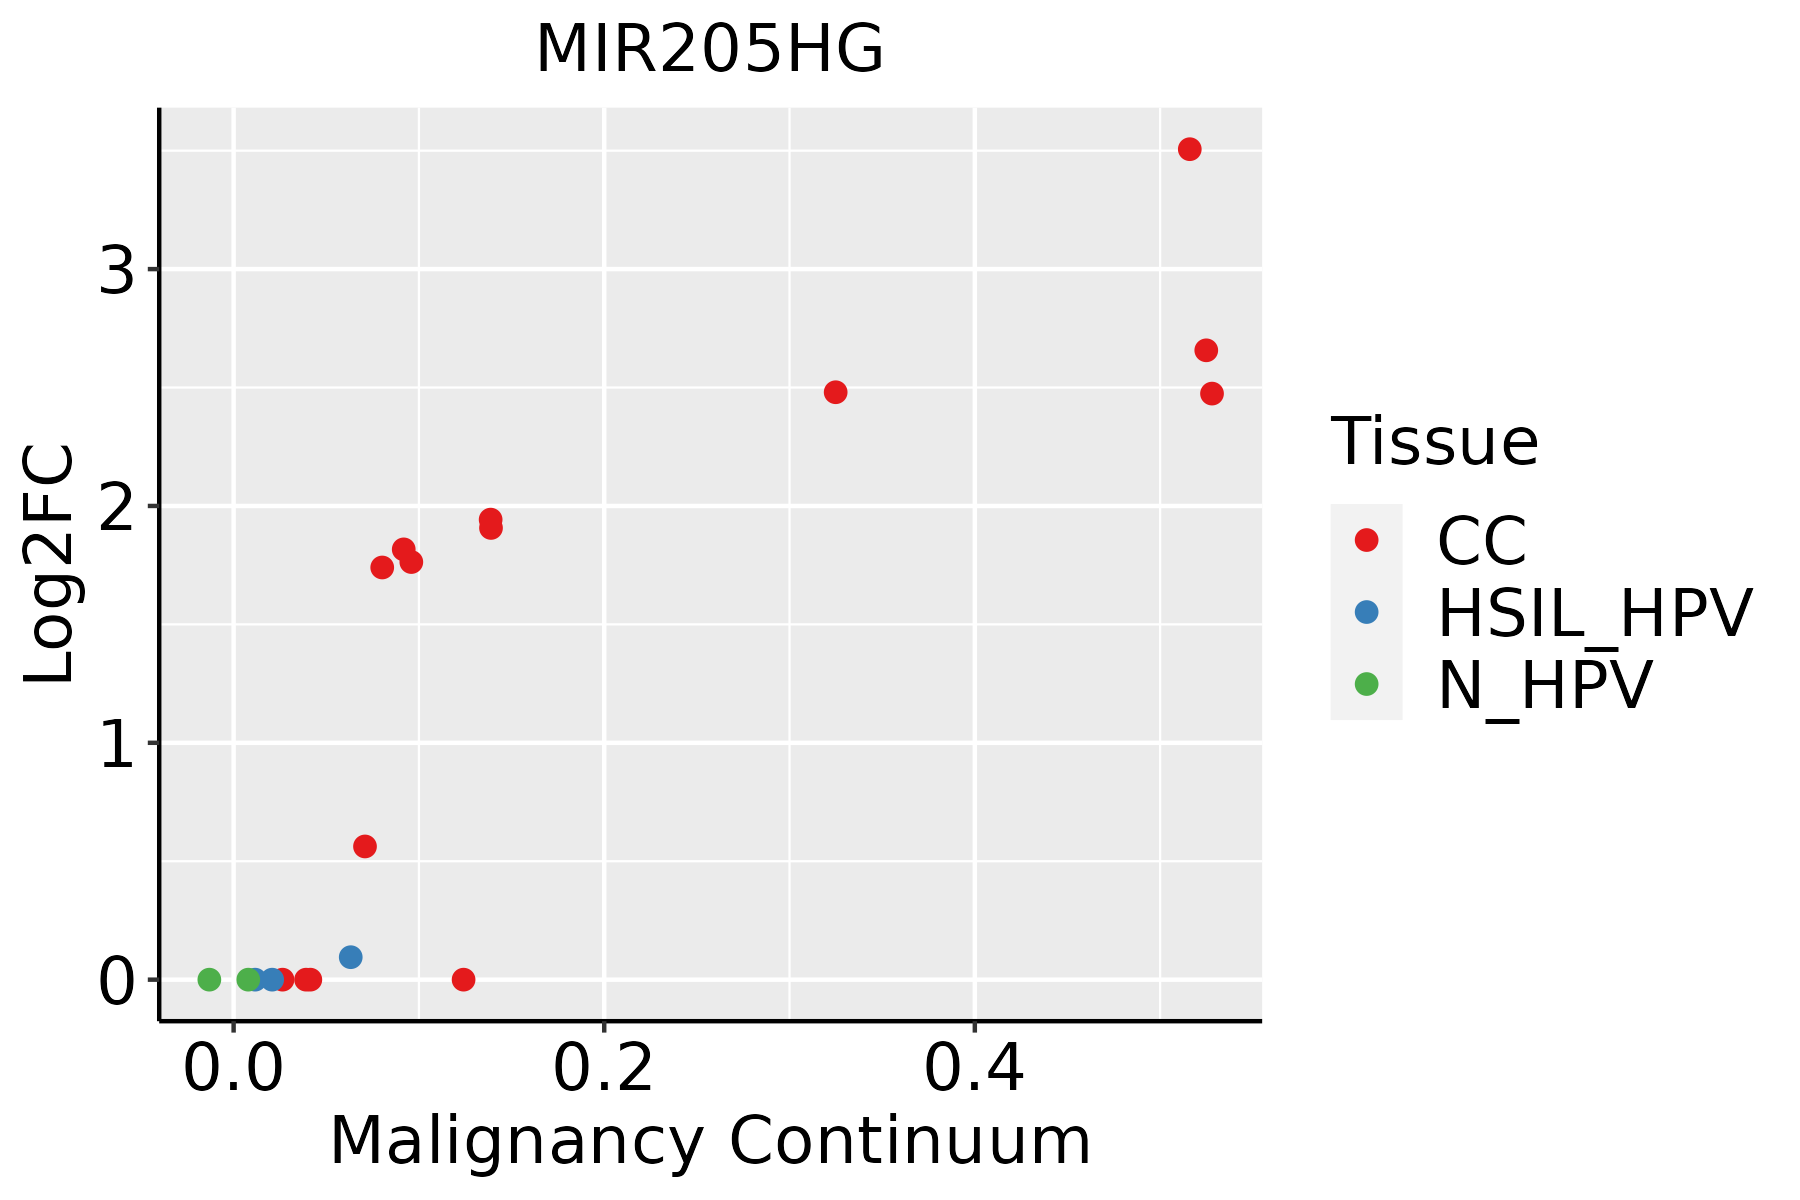 | CC: Cervix cancer |
| HSIL_HPV: HPV-infected high-grade squamous intraepithelial lesions | ||
| N_HPV: HPV-infected normal cervix | ||
| Esophagus | 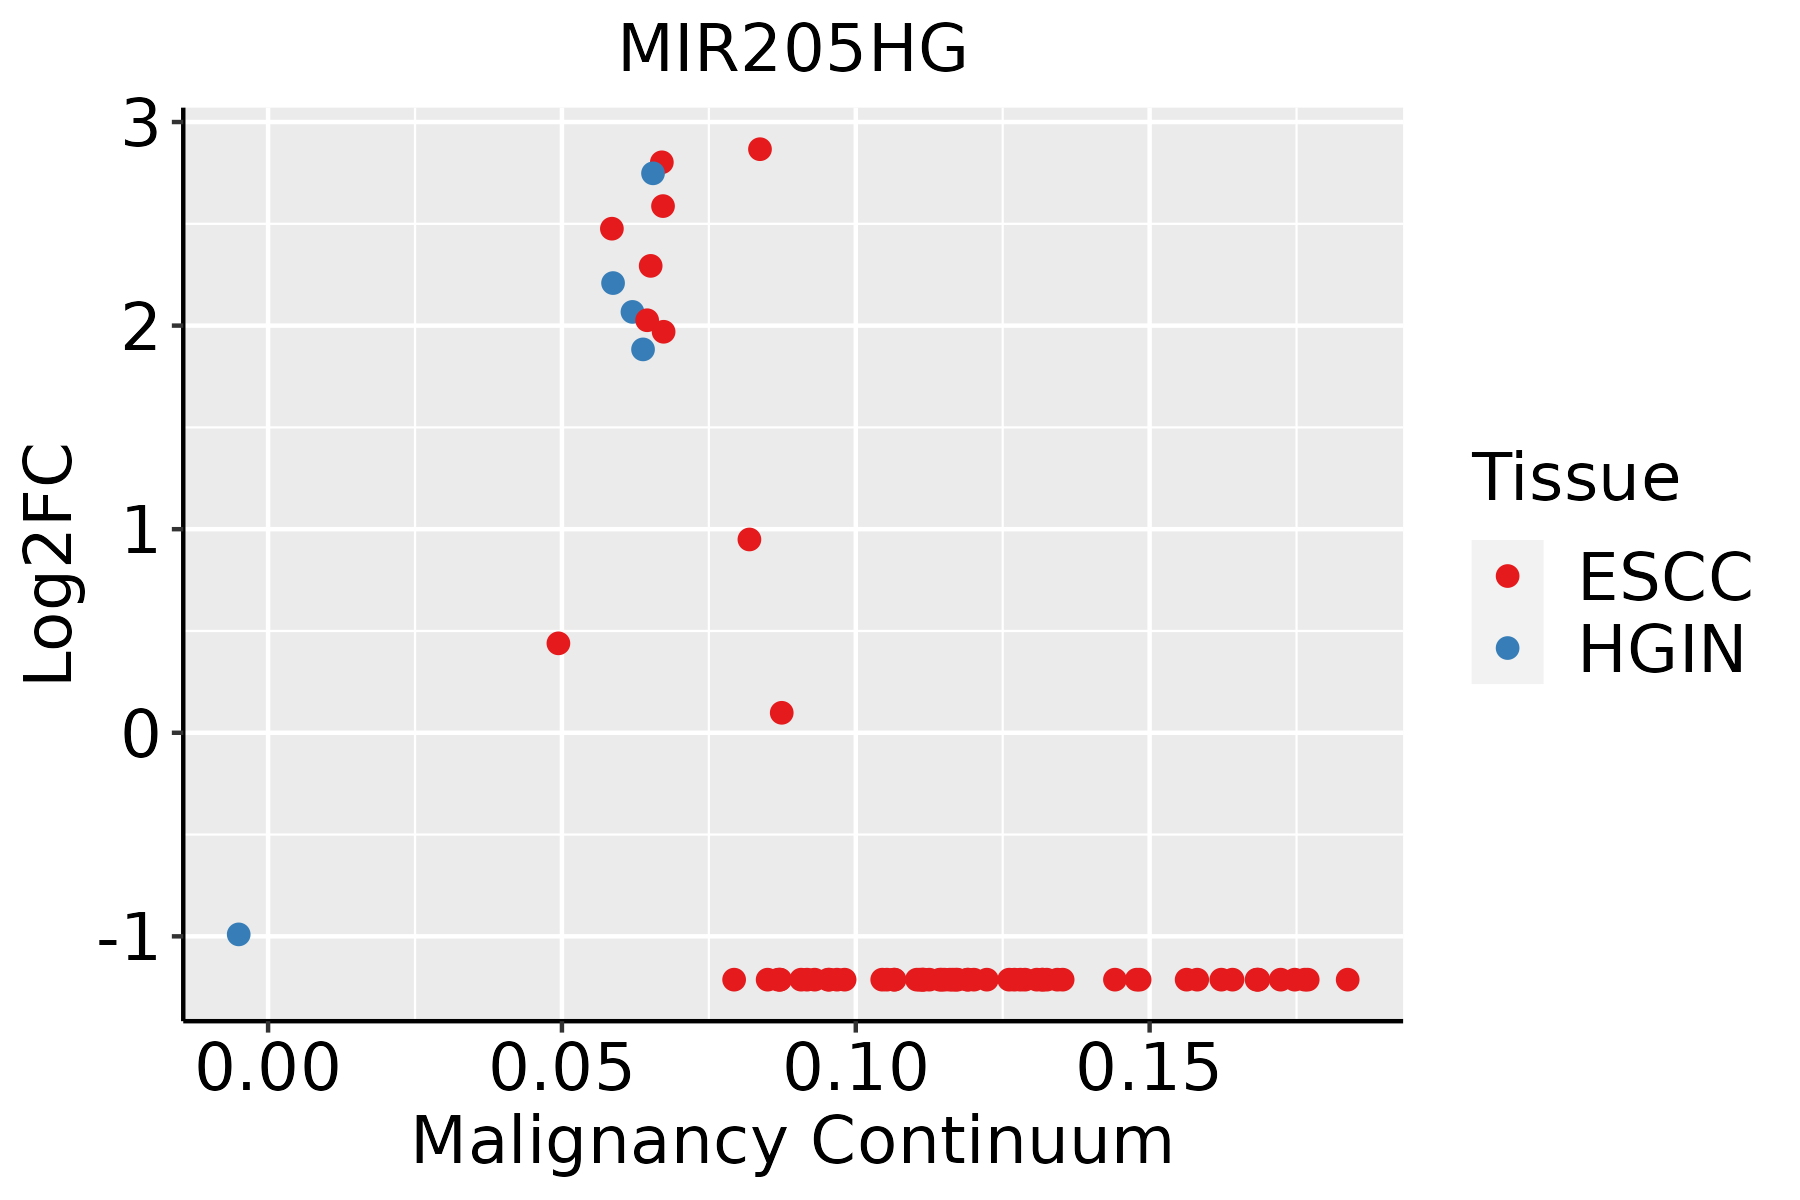 | ESCC: Esophageal squamous cell carcinoma |
| HGIN: High-grade intraepithelial neoplasias | ||
| LGIN: Low-grade intraepithelial neoplasias | ||
| Lung | 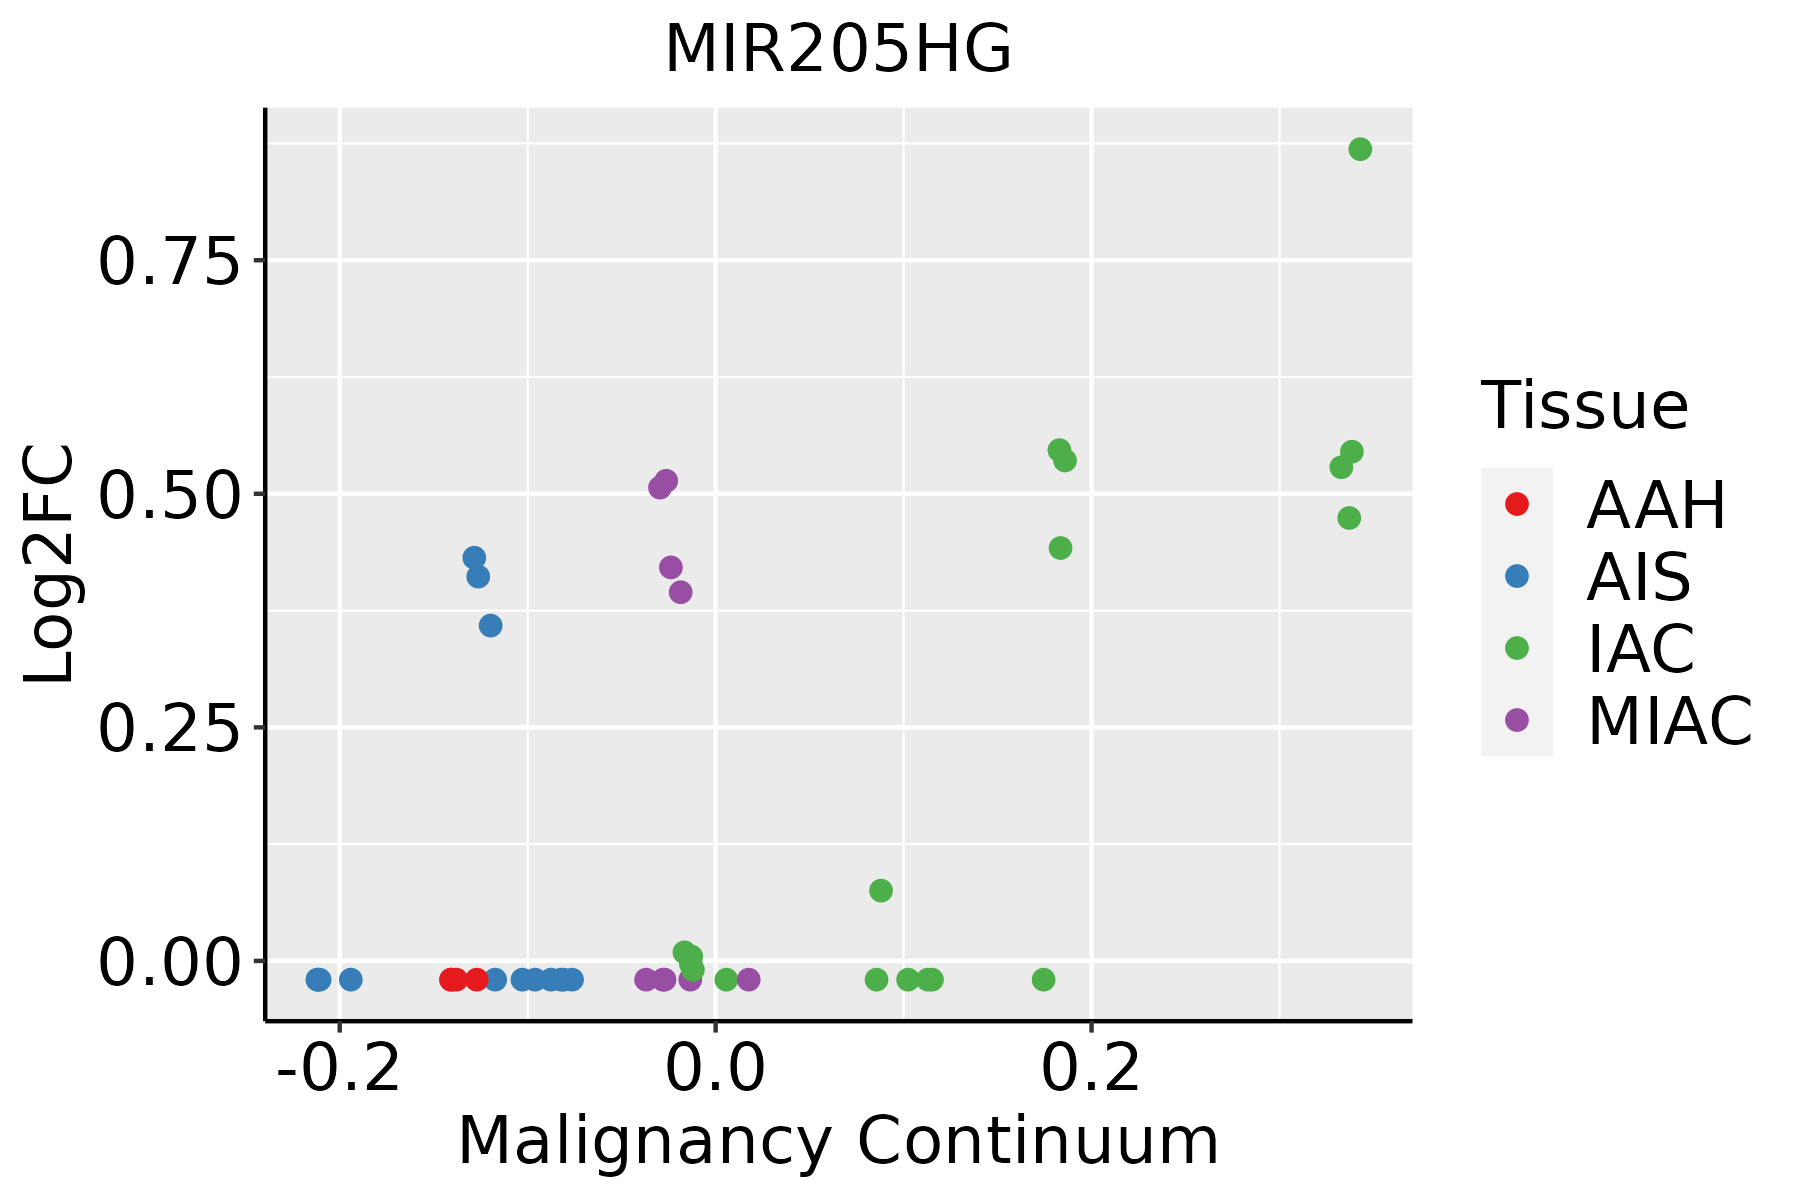 | AAH: Atypical adenomatous hyperplasia |
| AIS: Adenocarcinoma in situ | ||
| IAC: Invasive lung adenocarcinoma | ||
| MIA: Minimally invasive adenocarcinoma | ||
| Prostate |  | BPH: Benign Prostatic Hyperplasia |
| Skin | 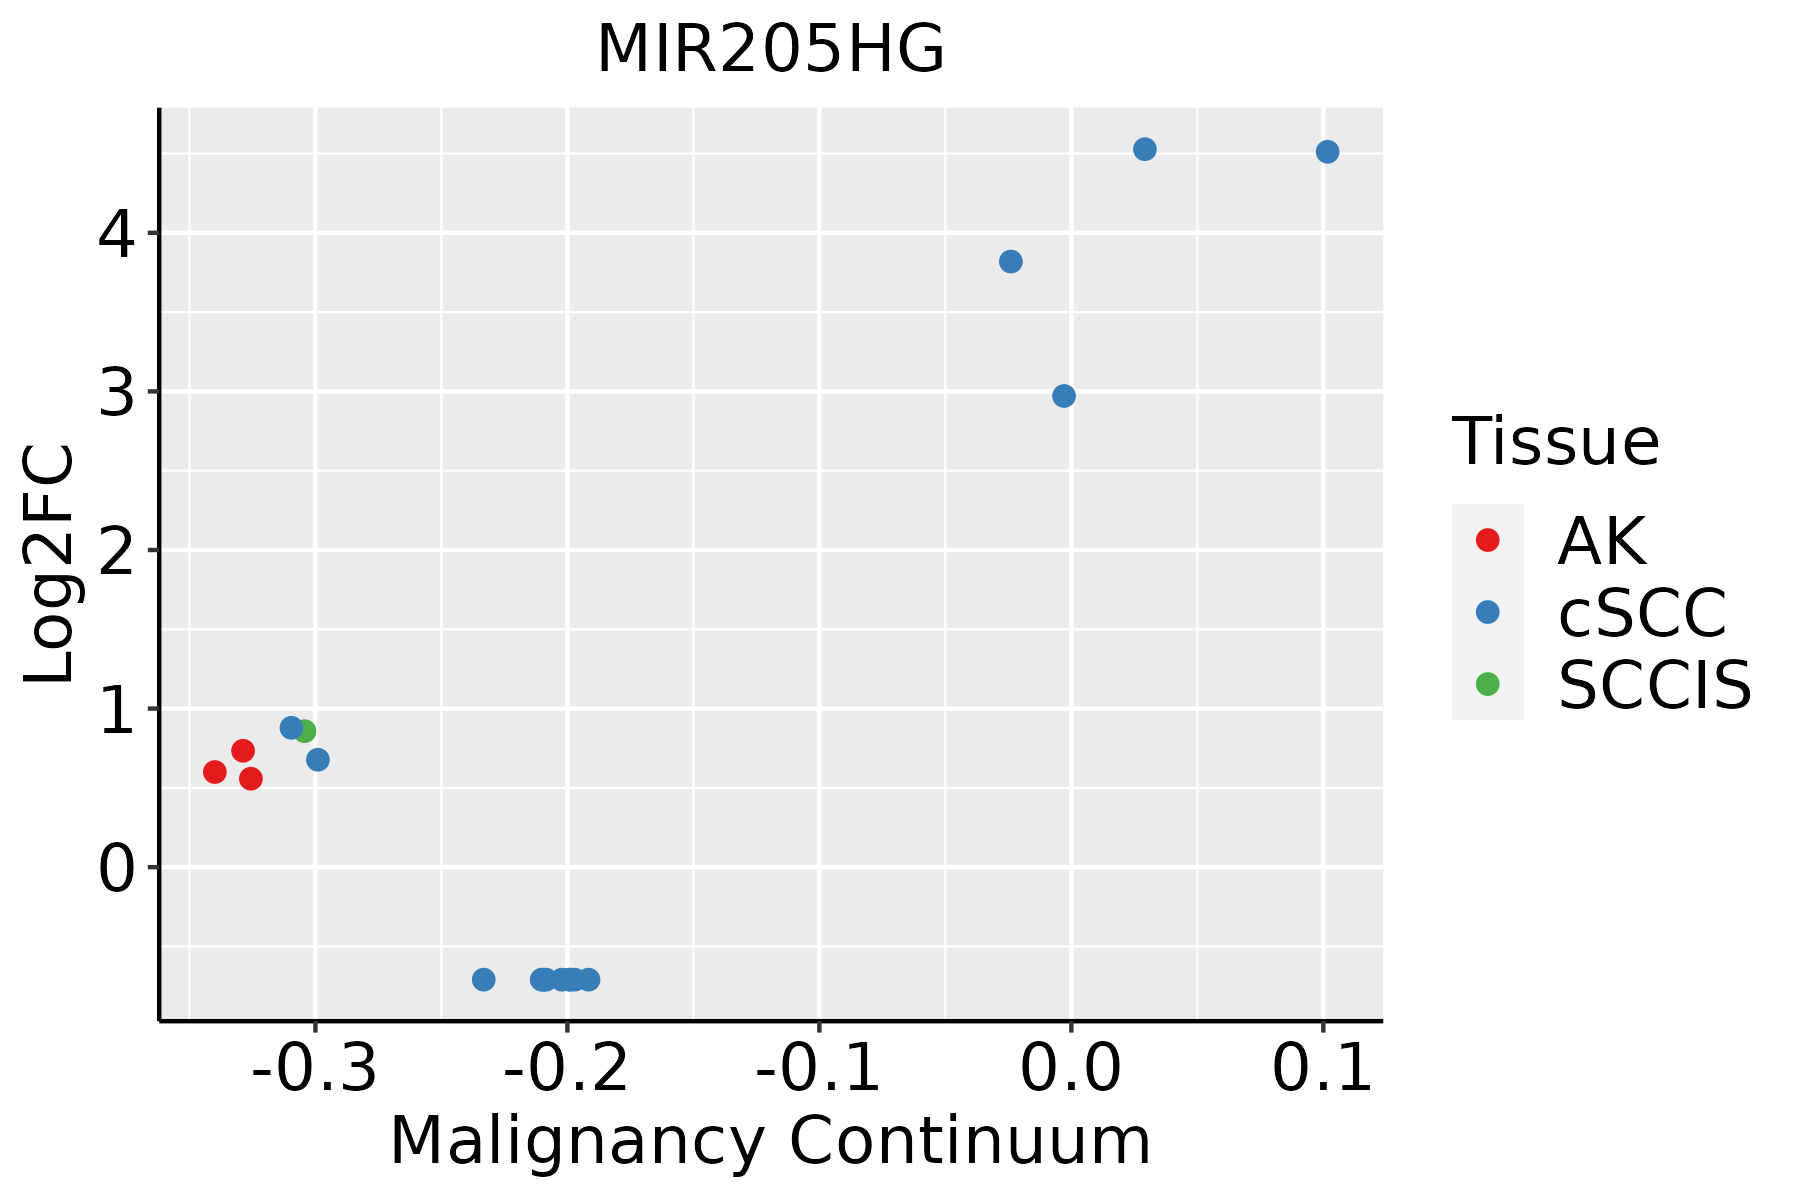 | AK: Actinic keratosis |
| cSCC: Cutaneous squamous cell carcinoma | ||
| SCCIS:squamous cell carcinoma in situ |
| ∗log2FC in expression of this searched gene in stem-like cells from each diseased tissue sample relative to stem-like cells in normal samples in each tissue plotted against the malignancy continuum. Samples are colored based on if they are from different disease stage. |
Top |
Malignant transformation related pathway analysis |
| Find out the enriched GO biological processes and KEGG pathways involved in transition from healthy to precancer to cancer |
| Tissue | Disease Stage | Enriched GO biological Processes |
| Colorectum | AD |  |
| Colorectum | SER |  |
| Colorectum | MSS |  |
| Colorectum | MSI-H |  |
| Colorectum | FAP |  |
| ∗Top 15 enriched GO BP terms are showed in the bar plot of each disease state in each tissue. Each row represents a significant GO biological process which is colored according to the -log10(p.adjust). |
| Page: 1 2 3 4 5 6 7 8 9 |
| GO ID | Tissue | Disease Stage | Description | Gene Ratio | Bg Ratio | pvalue | p.adjust | Count |
| Page: 1 |
| Pathway ID | Tissue | Disease Stage | Description | Gene Ratio | Bg Ratio | pvalue | p.adjust | qvalue | Count |
| Page: 1 |
Top |
Cell-cell communication analysis |
| Identification of potential cell-cell interactions between two cell types and their ligand-receptor pairs for different disease states |
| Ligand | Receptor | LRpair | Pathway | Tissue | Disease Stage |
| Page: 1 |
Top |
Single-cell gene regulatory network inference analysis |
| Find out the significant the regulons (TFs) and the target genes of each regulon across cell types for different disease states |
| TF | Cell Type | Tissue | Disease Stage | Target Gene | RSS | Regulon Activity |
| ∗The dot plots of a searched regulon are shown for all cell subpopulations in each disease state of each tissue based on the regulon specific score inferred using pySCENIC and by calculating the average expression. |
| Page: 1 |
Top |
Somatic mutation of malignant transformation related genes |
| Annotation of somatic variants for genes involved in malignant transformation |
| Hugo Symbol | Variant Class | Variant Classification | dbSNP RS | HGVSc | HGVSp | HGVSp Short | SWISSPROT | BIOTYPE | SIFT | PolyPhen | Tumor Sample Barcode | Tissue | Histology | Sex | Age | Stage | Therapy Types | Drugs | Outcome |
| Page: 1 |
Top |
Related drugs of malignant transformation related genes |
| Identification of chemicals and drugs interact with genes involved in malignant transfromation |
| (DGIdb 4.0) |
| Entrez ID | Symbol | Category | Interaction Types | Drug Claim Name | Drug Name | PMIDs |
| Page: 1 |

Copyright 2023-Present -The University of Texas Health Science Center at Houston |