
|
|||||
|
 | |
| |
| |
| |
| |
| |
|
Gene: MAPRE1 |
Gene summary for MAPRE1 |
| Gene information | Species | Human | Gene symbol | MAPRE1 | Gene ID | 22919 |
| Gene name | microtubule associated protein RP/EB family member 1 | |
| Gene Alias | EB1 | |
| Cytomap | 20q11.21 | |
| Gene Type | protein-coding | GO ID | GO:0000226 | UniProtAcc | Q15691 |
Top |
Malignant transformation analysis |
| Identification of the aberrant gene expression in precancerous and cancerous lesions by comparing the gene expression of stem-like cells in diseased tissues with normal stem cells |
| Entrez ID | Symbol | Replicates | Species | Organ | Tissue | Adj P-value | Log2FC | Malignancy |
| 22919 | MAPRE1 | SYSMH2 | Human | Oral cavity | OSCC | 8.19e-20 | 7.97e-01 | 0.2326 |
| 22919 | MAPRE1 | SYSMH3 | Human | Oral cavity | OSCC | 8.12e-25 | 7.75e-01 | 0.2442 |
| 22919 | MAPRE1 | SYSMH5 | Human | Oral cavity | OSCC | 3.99e-02 | 1.85e-01 | 0.0647 |
| 22919 | MAPRE1 | SYSMH6 | Human | Oral cavity | OSCC | 8.19e-04 | 2.89e-01 | 0.1275 |
| 22919 | MAPRE1 | P5_S10_cSCC | Human | Skin | cSCC | 1.52e-02 | 6.63e-02 | -0.299 |
| 22919 | MAPRE1 | P1_cSCC | Human | Skin | cSCC | 1.25e-14 | 7.04e-01 | 0.0292 |
| 22919 | MAPRE1 | P2_cSCC | Human | Skin | cSCC | 3.13e-12 | 5.29e-01 | -0.024 |
| 22919 | MAPRE1 | P4_cSCC | Human | Skin | cSCC | 5.05e-13 | 7.11e-01 | -0.00290000000000005 |
| 22919 | MAPRE1 | P10_cSCC | Human | Skin | cSCC | 3.67e-33 | 1.10e+00 | 0.1017 |
| 22919 | MAPRE1 | cSCC_p6 | Human | Skin | cSCC | 4.35e-02 | -1.45e-01 | -0.1989 |
| 22919 | MAPRE1 | cSCC_p8 | Human | Skin | cSCC | 3.67e-02 | -8.66e-02 | -0.1971 |
| 22919 | MAPRE1 | Adj_PTCwithHT_6 | Human | Thyroid | HT | 2.54e-05 | -4.65e-01 | 0.02 |
| 22919 | MAPRE1 | Adj_PTCwithHT_8 | Human | Thyroid | HT | 1.34e-05 | -5.84e-01 | 0.0267 |
| 22919 | MAPRE1 | PTCwithHT_6 | Human | Thyroid | HT | 1.56e-03 | -4.81e-01 | 0.02 |
| 22919 | MAPRE1 | PTCwithHT_8 | Human | Thyroid | HT | 1.92e-06 | -4.99e-01 | 0.0351 |
| 22919 | MAPRE1 | PTCwithoutHT_2 | Human | Thyroid | PTC | 7.19e-05 | -4.84e-01 | 0.0419 |
| 22919 | MAPRE1 | male-WTA | Human | Thyroid | PTC | 1.18e-53 | -1.84e-01 | 0.1037 |
| 22919 | MAPRE1 | PTC01 | Human | Thyroid | PTC | 5.41e-10 | -2.60e-01 | 0.1899 |
| 22919 | MAPRE1 | PTC03 | Human | Thyroid | PTC | 8.30e-03 | -4.27e-01 | 0.1784 |
| 22919 | MAPRE1 | PTC04 | Human | Thyroid | PTC | 2.36e-10 | -2.16e-01 | 0.1927 |
| Page: 1 2 3 4 5 6 7 |
| Tissue | Expression Dynamics | Abbreviation |
| Colorectum (GSE201348) | 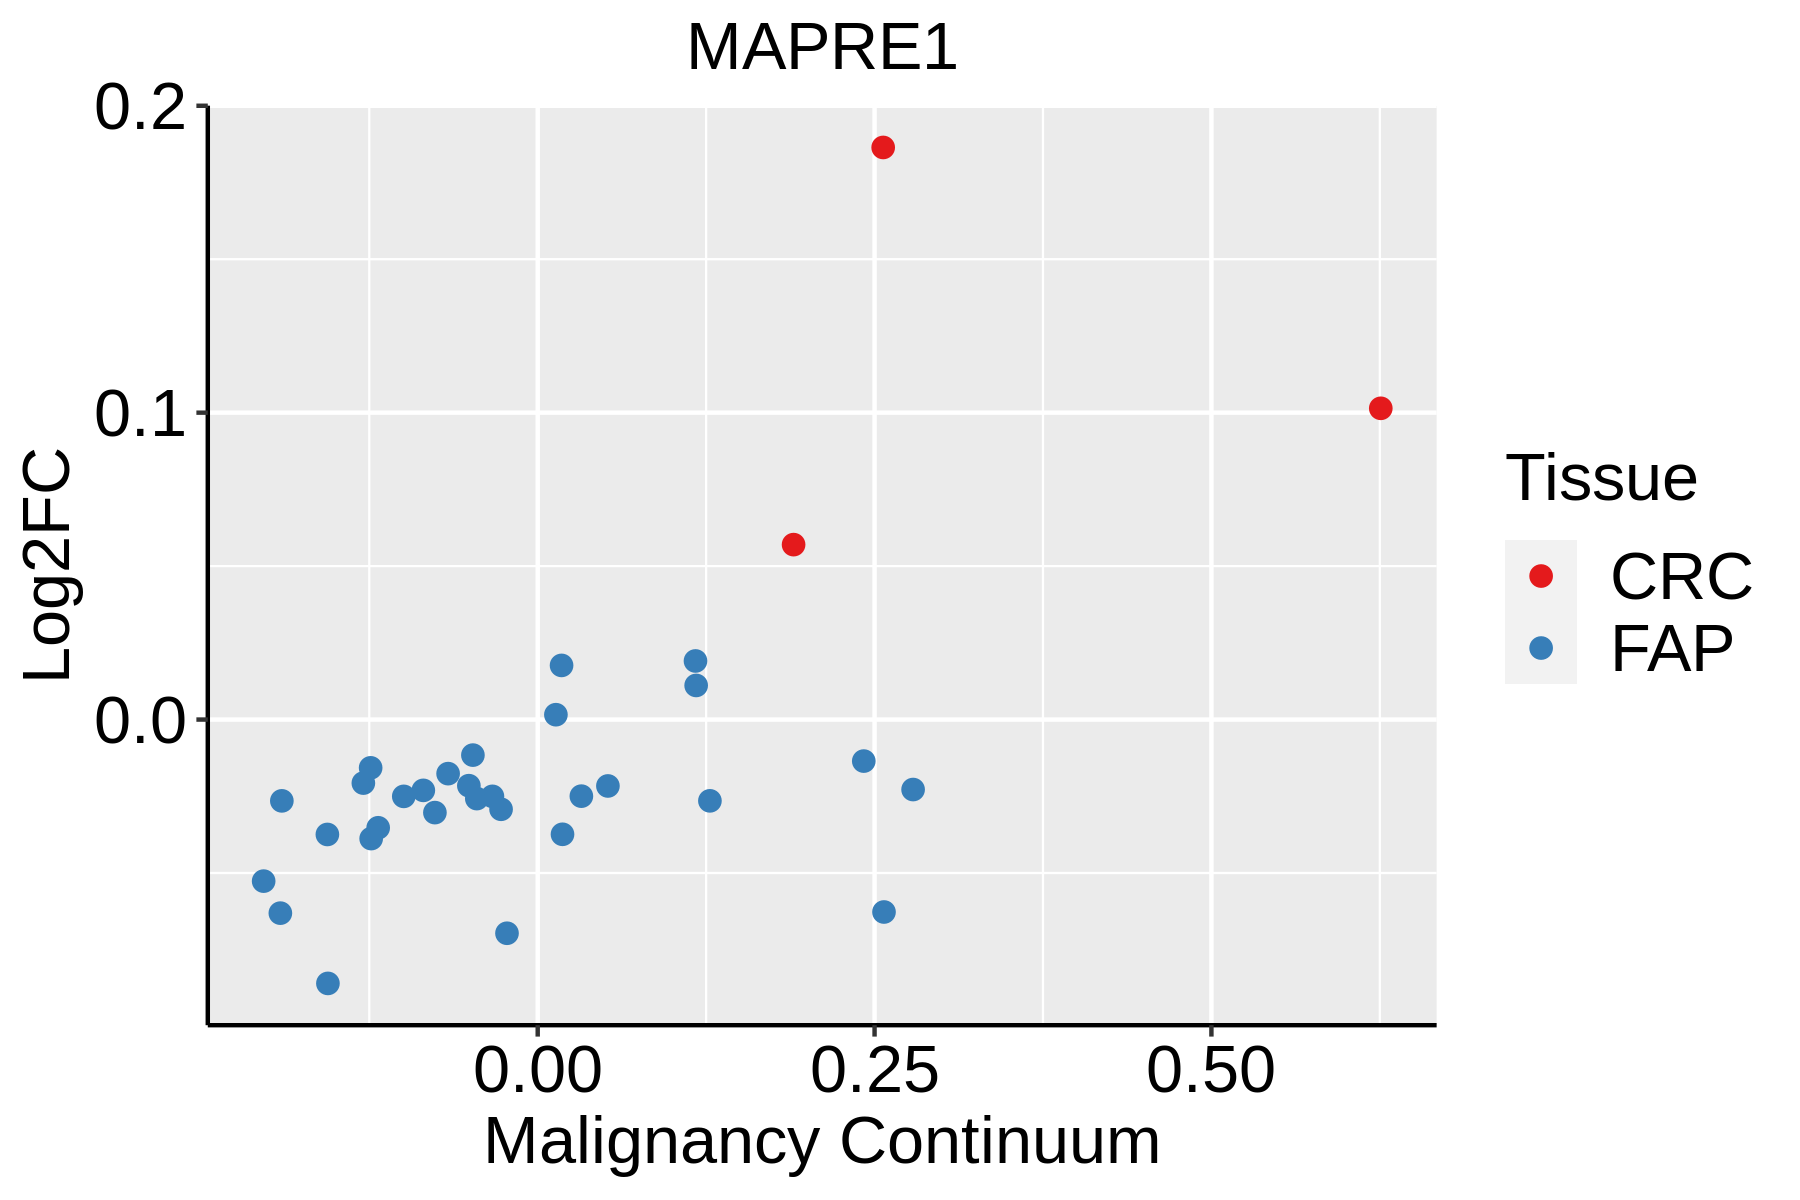 | FAP: Familial adenomatous polyposis |
| CRC: Colorectal cancer | ||
| Colorectum (HTA11) |  | AD: Adenomas |
| SER: Sessile serrated lesions | ||
| MSI-H: Microsatellite-high colorectal cancer | ||
| MSS: Microsatellite stable colorectal cancer | ||
| Esophagus |  | ESCC: Esophageal squamous cell carcinoma |
| HGIN: High-grade intraepithelial neoplasias | ||
| LGIN: Low-grade intraepithelial neoplasias | ||
| Liver | 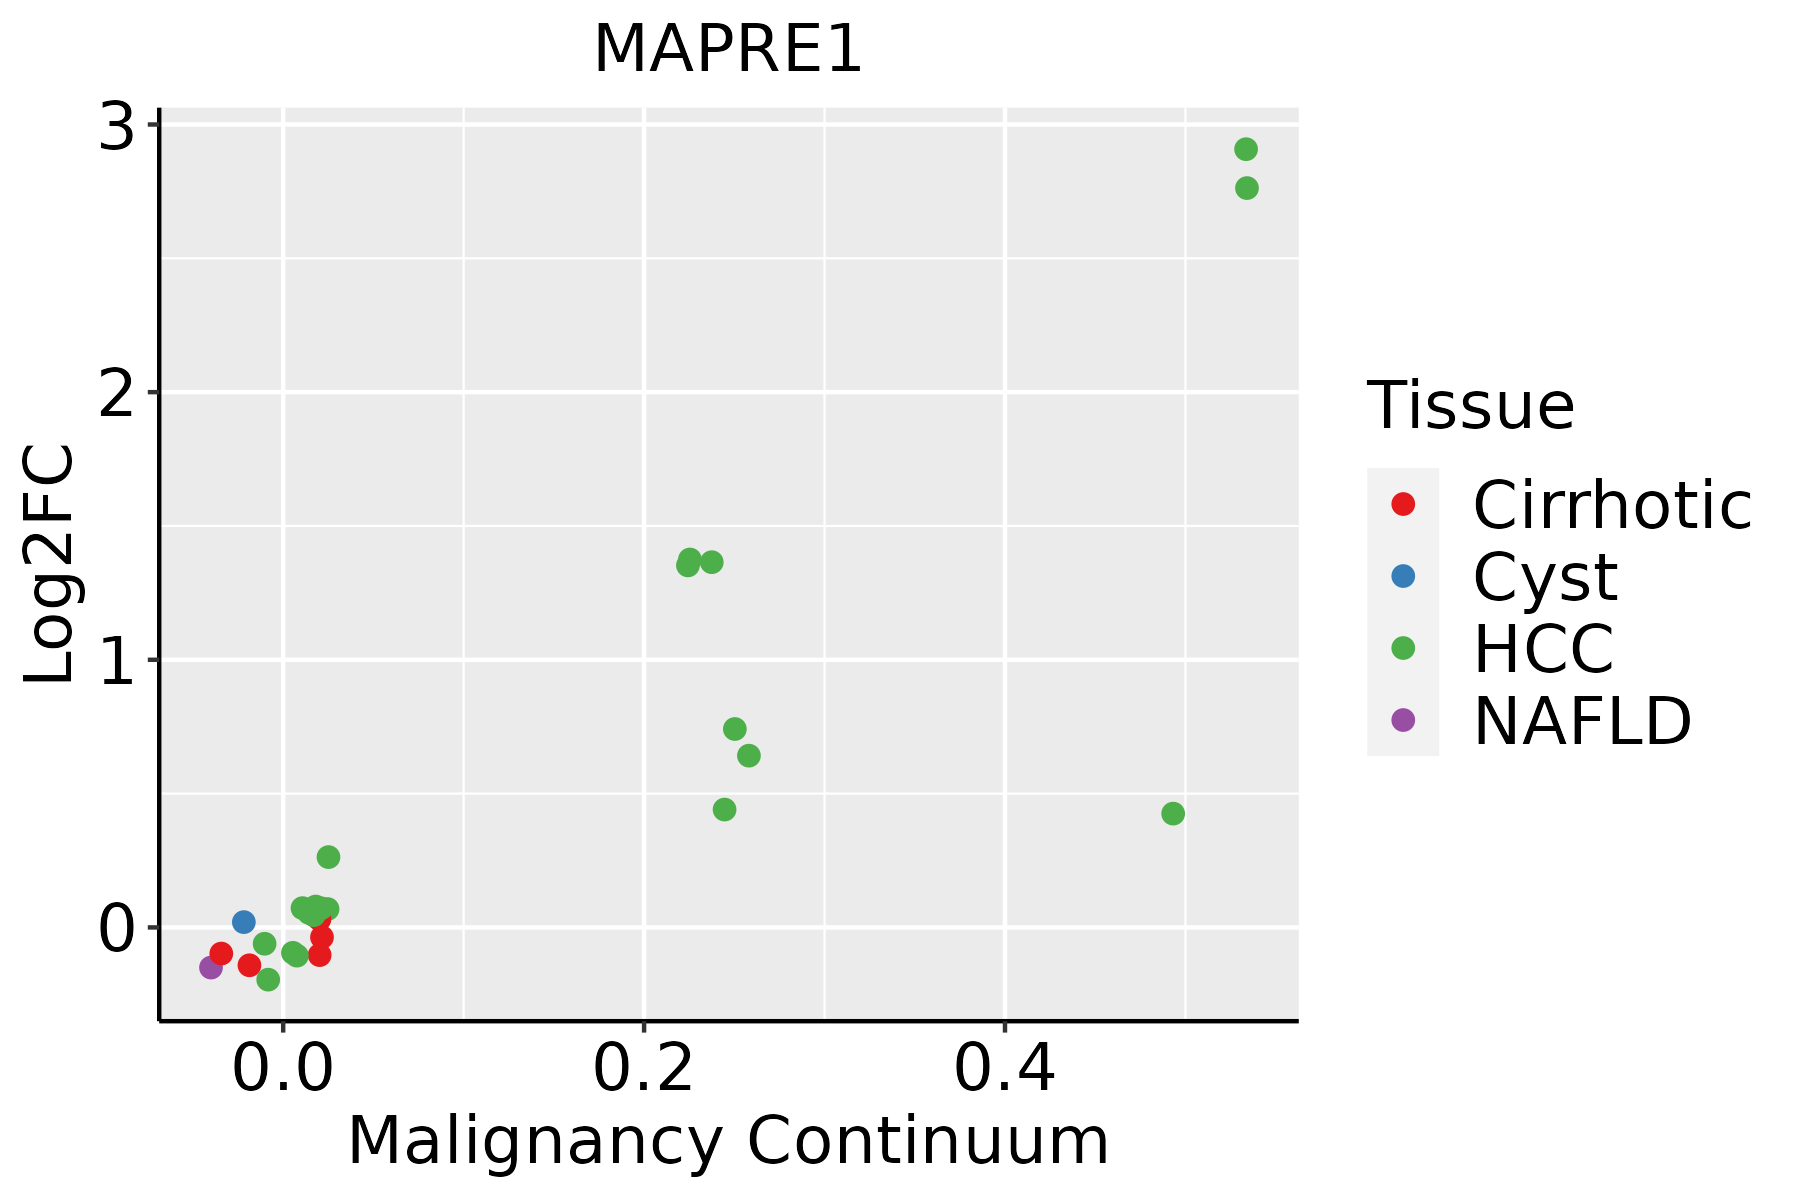 | HCC: Hepatocellular carcinoma |
| NAFLD: Non-alcoholic fatty liver disease | ||
| Oral Cavity |  | EOLP: Erosive Oral lichen planus |
| LP: leukoplakia | ||
| NEOLP: Non-erosive oral lichen planus | ||
| OSCC: Oral squamous cell carcinoma | ||
| Skin | 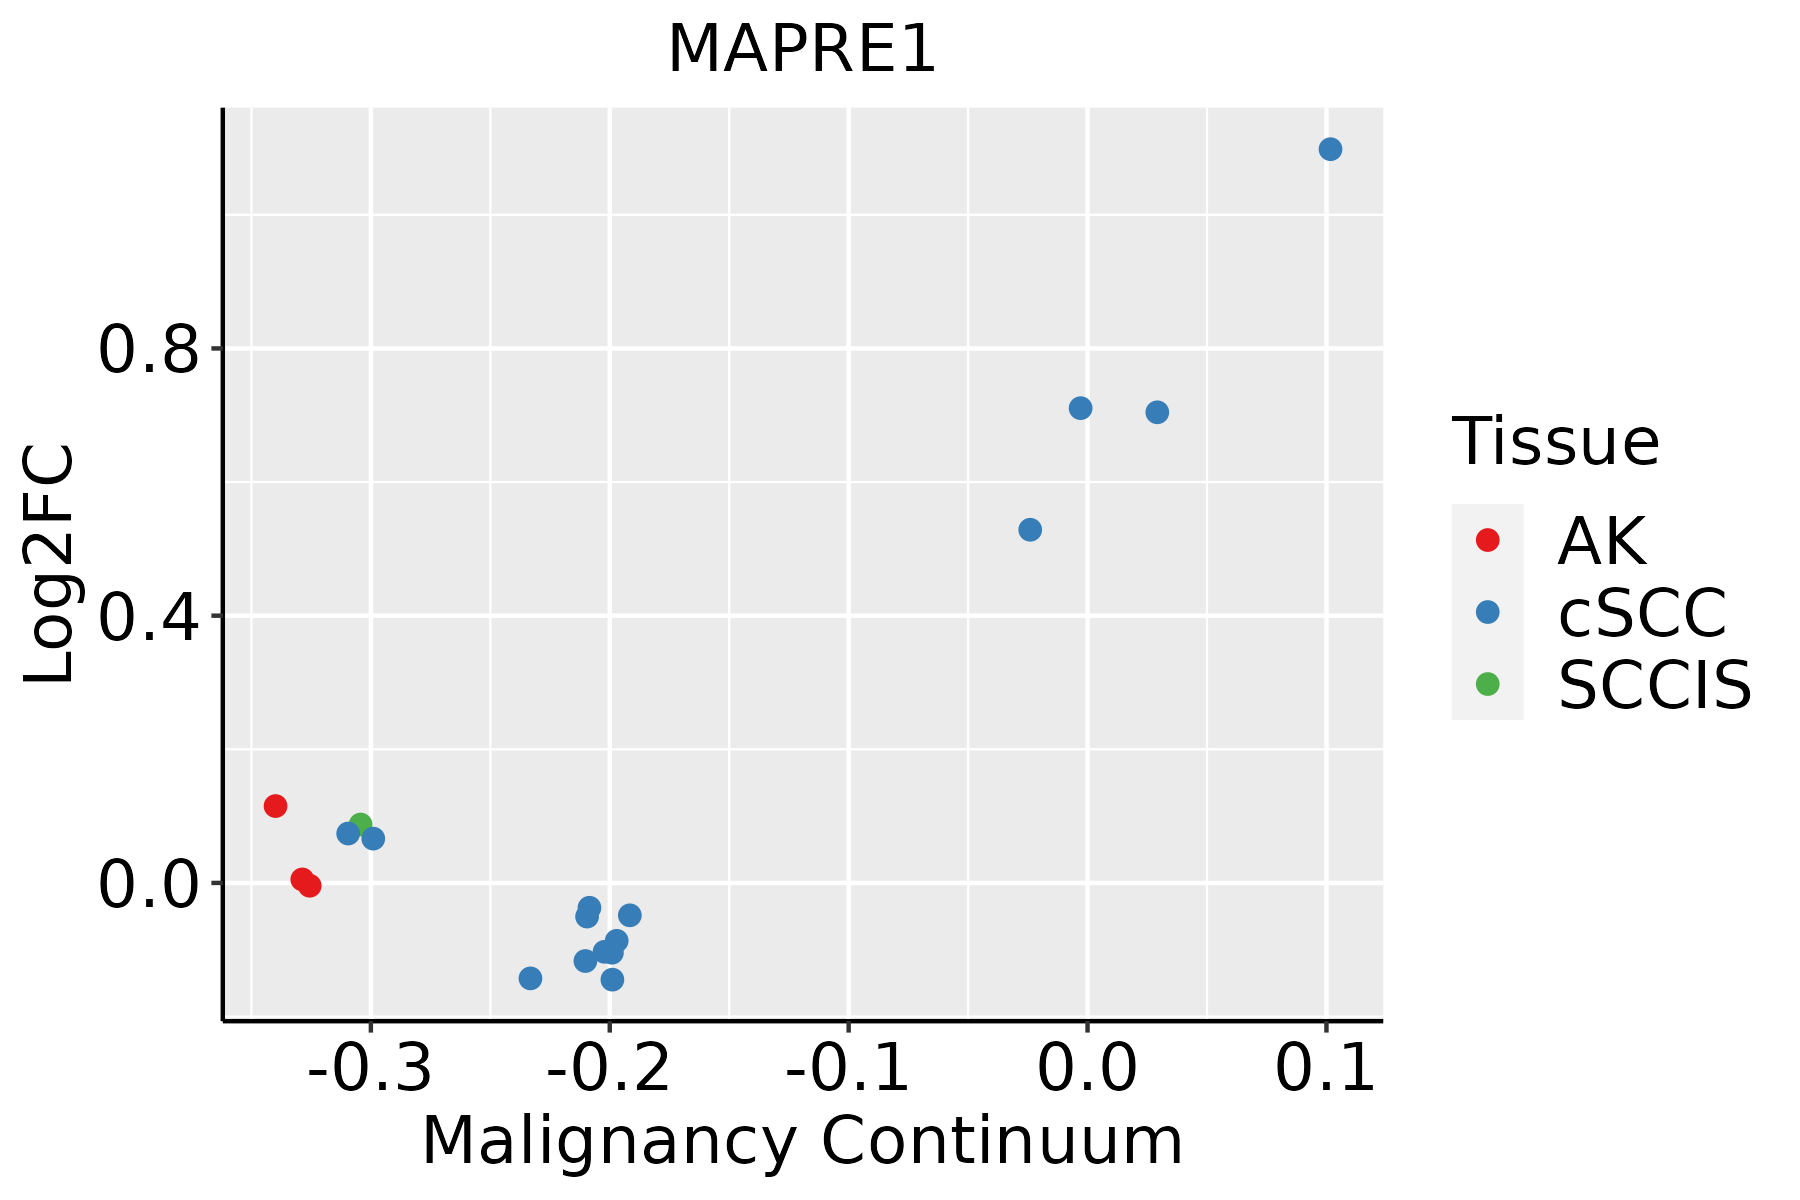 | AK: Actinic keratosis |
| cSCC: Cutaneous squamous cell carcinoma | ||
| SCCIS:squamous cell carcinoma in situ | ||
| Thyroid | 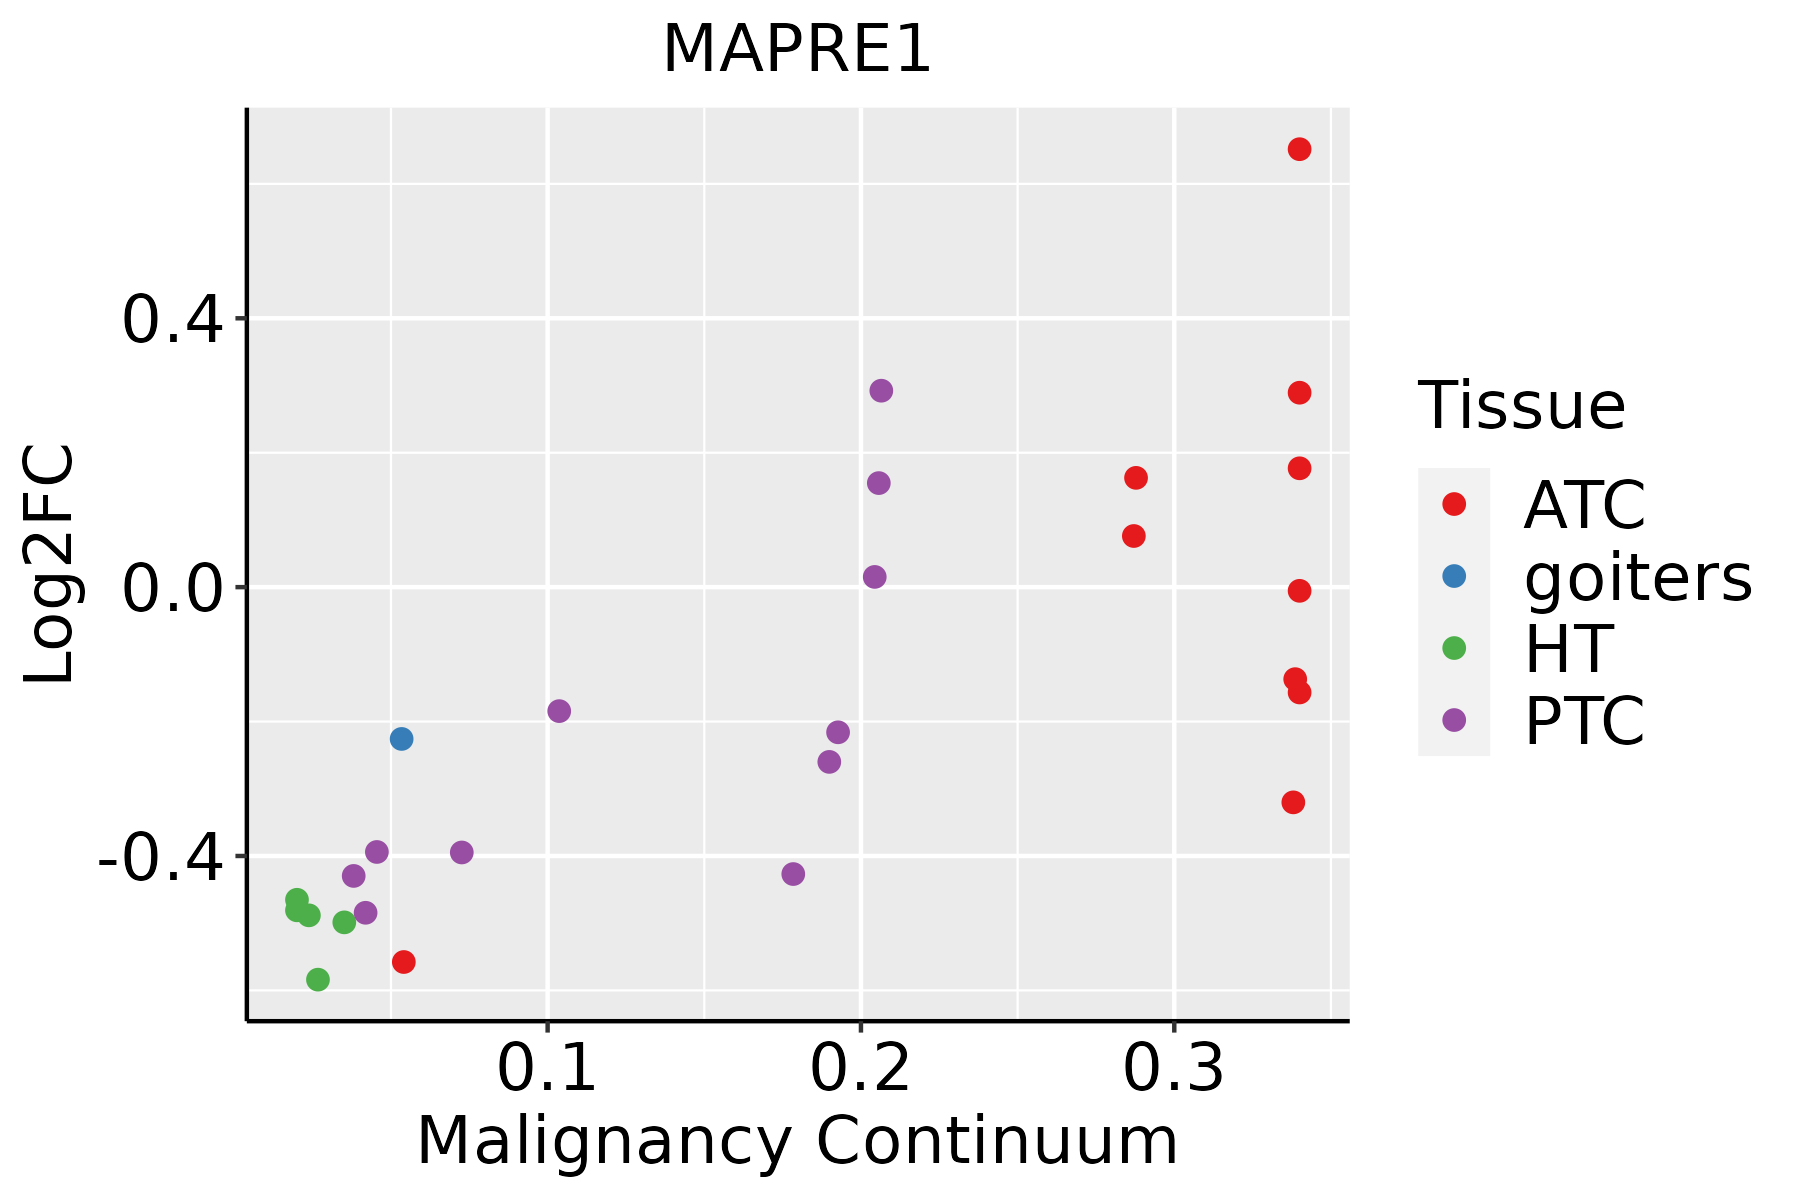 | ATC: Anaplastic thyroid cancer |
| HT: Hashimoto's thyroiditis | ||
| PTC: Papillary thyroid cancer |
| ∗log2FC in expression of this searched gene in stem-like cells from each diseased tissue sample relative to stem-like cells in normal samples in each tissue plotted against the malignancy continuum. Samples are colored based on if they are from different disease stage. |
Top |
Malignant transformation related pathway analysis |
| Find out the enriched GO biological processes and KEGG pathways involved in transition from healthy to precancer to cancer |
| Tissue | Disease Stage | Enriched GO biological Processes |
| Colorectum | AD |  |
| Colorectum | SER |  |
| Colorectum | MSS |  |
| Colorectum | MSI-H |  |
| Colorectum | FAP |  |
| ∗Top 15 enriched GO BP terms are showed in the bar plot of each disease state in each tissue. Each row represents a significant GO biological process which is colored according to the -log10(p.adjust). |
| Page: 1 2 3 4 5 6 7 8 9 |
| GO ID | Tissue | Disease Stage | Description | Gene Ratio | Bg Ratio | pvalue | p.adjust | Count |
| GO:1902903 | Colorectum | AD | regulation of supramolecular fiber organization | 139/3918 | 383/18723 | 2.01e-12 | 3.19e-10 | 139 |
| GO:0032271 | Colorectum | AD | regulation of protein polymerization | 94/3918 | 233/18723 | 1.01e-11 | 1.29e-09 | 94 |
| GO:0051258 | Colorectum | AD | protein polymerization | 112/3918 | 297/18723 | 1.85e-11 | 2.27e-09 | 112 |
| GO:0043254 | Colorectum | AD | regulation of protein-containing complex assembly | 148/3918 | 428/18723 | 2.64e-11 | 3.18e-09 | 148 |
| GO:1902905 | Colorectum | AD | positive regulation of supramolecular fiber organization | 85/3918 | 209/18723 | 5.95e-11 | 6.33e-09 | 85 |
| GO:0051495 | Colorectum | AD | positive regulation of cytoskeleton organization | 89/3918 | 226/18723 | 1.61e-10 | 1.56e-08 | 89 |
| GO:0032273 | Colorectum | AD | positive regulation of protein polymerization | 62/3918 | 138/18723 | 1.94e-10 | 1.76e-08 | 62 |
| GO:0031334 | Colorectum | AD | positive regulation of protein-containing complex assembly | 91/3918 | 237/18723 | 4.78e-10 | 3.99e-08 | 91 |
| GO:0051098 | Colorectum | AD | regulation of binding | 126/3918 | 363/18723 | 6.01e-10 | 4.88e-08 | 126 |
| GO:0010639 | Colorectum | AD | negative regulation of organelle organization | 114/3918 | 348/18723 | 1.41e-07 | 6.49e-06 | 114 |
| GO:0051099 | Colorectum | AD | positive regulation of binding | 66/3918 | 173/18723 | 1.47e-07 | 6.64e-06 | 66 |
| GO:0032272 | Colorectum | AD | negative regulation of protein polymerization | 36/3918 | 80/18723 | 1.13e-06 | 3.72e-05 | 36 |
| GO:0043393 | Colorectum | AD | regulation of protein binding | 68/3918 | 196/18723 | 5.17e-06 | 1.34e-04 | 68 |
| GO:1902904 | Colorectum | AD | negative regulation of supramolecular fiber organization | 60/3918 | 167/18723 | 5.23e-06 | 1.35e-04 | 60 |
| GO:0031333 | Colorectum | AD | negative regulation of protein-containing complex assembly | 52/3918 | 141/18723 | 9.27e-06 | 2.18e-04 | 52 |
| GO:0051494 | Colorectum | AD | negative regulation of cytoskeleton organization | 58/3918 | 163/18723 | 1.04e-05 | 2.40e-04 | 58 |
| GO:0032092 | Colorectum | AD | positive regulation of protein binding | 33/3918 | 85/18723 | 1.22e-04 | 1.78e-03 | 33 |
| GO:0071539 | Colorectum | AD | protein localization to centrosome | 16/3918 | 33/18723 | 3.86e-04 | 4.41e-03 | 16 |
| GO:0007051 | Colorectum | AD | spindle organization | 58/3918 | 184/18723 | 4.71e-04 | 5.20e-03 | 58 |
| GO:1905508 | Colorectum | AD | protein localization to microtubule organizing center | 16/3918 | 35/18723 | 8.76e-04 | 8.51e-03 | 16 |
| Page: 1 2 3 4 5 6 7 8 9 10 11 12 13 14 |
| Pathway ID | Tissue | Disease Stage | Description | Gene Ratio | Bg Ratio | pvalue | p.adjust | qvalue | Count |
| Page: 1 |
Top |
Cell-cell communication analysis |
| Identification of potential cell-cell interactions between two cell types and their ligand-receptor pairs for different disease states |
| Ligand | Receptor | LRpair | Pathway | Tissue | Disease Stage |
| Page: 1 |
Top |
Single-cell gene regulatory network inference analysis |
| Find out the significant the regulons (TFs) and the target genes of each regulon across cell types for different disease states |
| TF | Cell Type | Tissue | Disease Stage | Target Gene | RSS | Regulon Activity |
| ∗The dot plots of a searched regulon are shown for all cell subpopulations in each disease state of each tissue based on the regulon specific score inferred using pySCENIC and by calculating the average expression. |
| Page: 1 |
Top |
Somatic mutation of malignant transformation related genes |
| Annotation of somatic variants for genes involved in malignant transformation |
| Hugo Symbol | Variant Class | Variant Classification | dbSNP RS | HGVSc | HGVSp | HGVSp Short | SWISSPROT | BIOTYPE | SIFT | PolyPhen | Tumor Sample Barcode | Tissue | Histology | Sex | Age | Stage | Therapy Types | Drugs | Outcome |
| MAPRE1 | SNV | Missense_Mutation | novel | c.556G>A | p.Val186Met | p.V186M | Q15691 | protein_coding | tolerated(0.18) | benign(0.003) | TCGA-A2-A3XW-01 | Breast | breast invasive carcinoma | Female | <65 | I/II | Chemotherapy | adriamyicin | CR |
| MAPRE1 | SNV | Missense_Mutation | novel | c.776N>A | p.Gly259Glu | p.G259E | Q15691 | protein_coding | tolerated(0.59) | probably_damaging(0.994) | TCGA-CA-6717-01 | Colorectum | colon adenocarcinoma | Male | <65 | I/II | Chemotherapy | oxaliplatin | CR |
| MAPRE1 | SNV | Missense_Mutation | c.257G>A | p.Gly86Asp | p.G86D | Q15691 | protein_coding | deleterious(0.04) | benign(0.041) | TCGA-F4-6809-01 | Colorectum | colon adenocarcinoma | Female | <65 | I/II | Unknown | Unknown | PD | |
| MAPRE1 | SNV | Missense_Mutation | c.93T>G | p.Asn31Lys | p.N31K | Q15691 | protein_coding | deleterious(0.02) | possibly_damaging(0.56) | TCGA-AG-A02X-01 | Colorectum | rectum adenocarcinoma | Male | >=65 | I/II | Unknown | Unknown | SD | |
| MAPRE1 | SNV | Missense_Mutation | rs770912318 | c.260T>C | p.Val87Ala | p.V87A | Q15691 | protein_coding | deleterious(0.01) | possibly_damaging(0.75) | TCGA-A5-A0VQ-01 | Endometrium | uterine corpus endometrioid carcinoma | Female | <65 | I/II | Chemotherapy | carboplatin | SD |
| MAPRE1 | SNV | Missense_Mutation | novel | c.365A>C | p.Lys122Thr | p.K122T | Q15691 | protein_coding | tolerated(0.08) | benign(0.119) | TCGA-AP-A059-01 | Endometrium | uterine corpus endometrioid carcinoma | Female | >=65 | I/II | Unknown | Unknown | SD |
| MAPRE1 | SNV | Missense_Mutation | c.28N>A | p.Val10Met | p.V10M | Q15691 | protein_coding | tolerated(0.12) | possibly_damaging(0.756) | TCGA-AX-A063-01 | Endometrium | uterine corpus endometrioid carcinoma | Female | <65 | I/II | Unknown | Unknown | SD | |
| MAPRE1 | SNV | Missense_Mutation | rs771324465 | c.604N>A | p.Val202Ile | p.V202I | Q15691 | protein_coding | tolerated(0.13) | benign(0.003) | TCGA-AX-A0J1-01 | Endometrium | uterine corpus endometrioid carcinoma | Female | >=65 | I/II | Unknown | Unknown | SD |
| MAPRE1 | SNV | Missense_Mutation | novel | c.802T>C | p.Tyr268His | p.Y268H | Q15691 | protein_coding | deleterious(0.03) | possibly_damaging(0.543) | TCGA-AX-A1CE-01 | Endometrium | uterine corpus endometrioid carcinoma | Female | <65 | I/II | Unspecific | Paclitaxel | SD |
| MAPRE1 | SNV | Missense_Mutation | novel | c.266A>C | p.Lys89Thr | p.K89T | Q15691 | protein_coding | deleterious(0.02) | probably_damaging(0.936) | TCGA-AX-A2HC-01 | Endometrium | uterine corpus endometrioid carcinoma | Female | <65 | III/IV | Chemotherapy | paclitaxel | PD |
| Page: 1 2 3 4 |
Top |
Related drugs of malignant transformation related genes |
| Identification of chemicals and drugs interact with genes involved in malignant transfromation |
| (DGIdb 4.0) |
| Entrez ID | Symbol | Category | Interaction Types | Drug Claim Name | Drug Name | PMIDs |
| Page: 1 |

Copyright 2023-Present -The University of Texas Health Science Center at Houston |