
|
|||||
|
 | |
| |
| |
| |
| |
| |
|
Gene: KRCC1 |
Gene summary for KRCC1 |
| Gene information | Species | Human | Gene symbol | KRCC1 | Gene ID | 51315 |
| Gene name | lysine rich coiled-coil 1 | |
| Gene Alias | CHBP2 | |
| Cytomap | 2p11.2 | |
| Gene Type | protein-coding | GO ID | GO:0003674 | UniProtAcc | A0A024R5P4 |
Top |
Malignant transformation analysis |
| Identification of the aberrant gene expression in precancerous and cancerous lesions by comparing the gene expression of stem-like cells in diseased tissues with normal stem cells |
| Entrez ID | Symbol | Replicates | Species | Organ | Tissue | Adj P-value | Log2FC | Malignancy |
| 51315 | KRCC1 | C09 | Human | Oral cavity | OSCC | 2.39e-03 | 2.49e-01 | 0.1431 |
| 51315 | KRCC1 | LN38 | Human | Oral cavity | OSCC | 6.29e-08 | 1.29e+00 | 0.168 |
| 51315 | KRCC1 | LN46 | Human | Oral cavity | OSCC | 1.70e-11 | 6.48e-01 | 0.1666 |
| 51315 | KRCC1 | LP15 | Human | Oral cavity | LP | 1.23e-04 | 1.01e+00 | 0.2174 |
| 51315 | KRCC1 | LP17 | Human | Oral cavity | LP | 4.64e-06 | 9.25e-01 | 0.2349 |
| 51315 | KRCC1 | SYSMH3 | Human | Oral cavity | OSCC | 2.45e-05 | 1.97e-01 | 0.2442 |
| 51315 | KRCC1 | SYSMH4 | Human | Oral cavity | OSCC | 4.25e-02 | 4.88e-02 | 0.1226 |
| 51315 | KRCC1 | SYSMH6 | Human | Oral cavity | OSCC | 6.89e-04 | 2.36e-01 | 0.1275 |
| 51315 | KRCC1 | P5_S10_cSCC | Human | Skin | cSCC | 2.68e-02 | 6.79e-02 | -0.299 |
| 51315 | KRCC1 | P2_cSCC | Human | Skin | cSCC | 2.58e-04 | 3.29e-01 | -0.024 |
| 51315 | KRCC1 | P10_cSCC | Human | Skin | cSCC | 1.80e-09 | 5.37e-01 | 0.1017 |
| 51315 | KRCC1 | cSCC_p8 | Human | Skin | cSCC | 1.22e-04 | 1.07e-01 | -0.1971 |
| 51315 | KRCC1 | cSCC_p9 | Human | Skin | cSCC | 5.88e-06 | 1.72e-01 | -0.1991 |
| 51315 | KRCC1 | male-WTA | Human | Thyroid | PTC | 9.41e-39 | 2.09e-01 | 0.1037 |
| 51315 | KRCC1 | PTC01 | Human | Thyroid | PTC | 7.70e-16 | 2.99e-01 | 0.1899 |
| 51315 | KRCC1 | PTC03 | Human | Thyroid | PTC | 9.90e-05 | 1.79e-01 | 0.1784 |
| 51315 | KRCC1 | PTC04 | Human | Thyroid | PTC | 2.84e-15 | 1.24e-01 | 0.1927 |
| 51315 | KRCC1 | PTC05 | Human | Thyroid | PTC | 3.90e-19 | 5.87e-01 | 0.2065 |
| 51315 | KRCC1 | PTC06 | Human | Thyroid | PTC | 9.64e-25 | 6.56e-01 | 0.2057 |
| 51315 | KRCC1 | PTC07 | Human | Thyroid | PTC | 1.63e-24 | 4.81e-01 | 0.2044 |
| Page: 1 2 3 4 5 6 7 |
| Tissue | Expression Dynamics | Abbreviation |
| Colorectum (GSE201348) |  | FAP: Familial adenomatous polyposis |
| CRC: Colorectal cancer | ||
| Colorectum (HTA11) |  | AD: Adenomas |
| SER: Sessile serrated lesions | ||
| MSI-H: Microsatellite-high colorectal cancer | ||
| MSS: Microsatellite stable colorectal cancer | ||
| Esophagus | 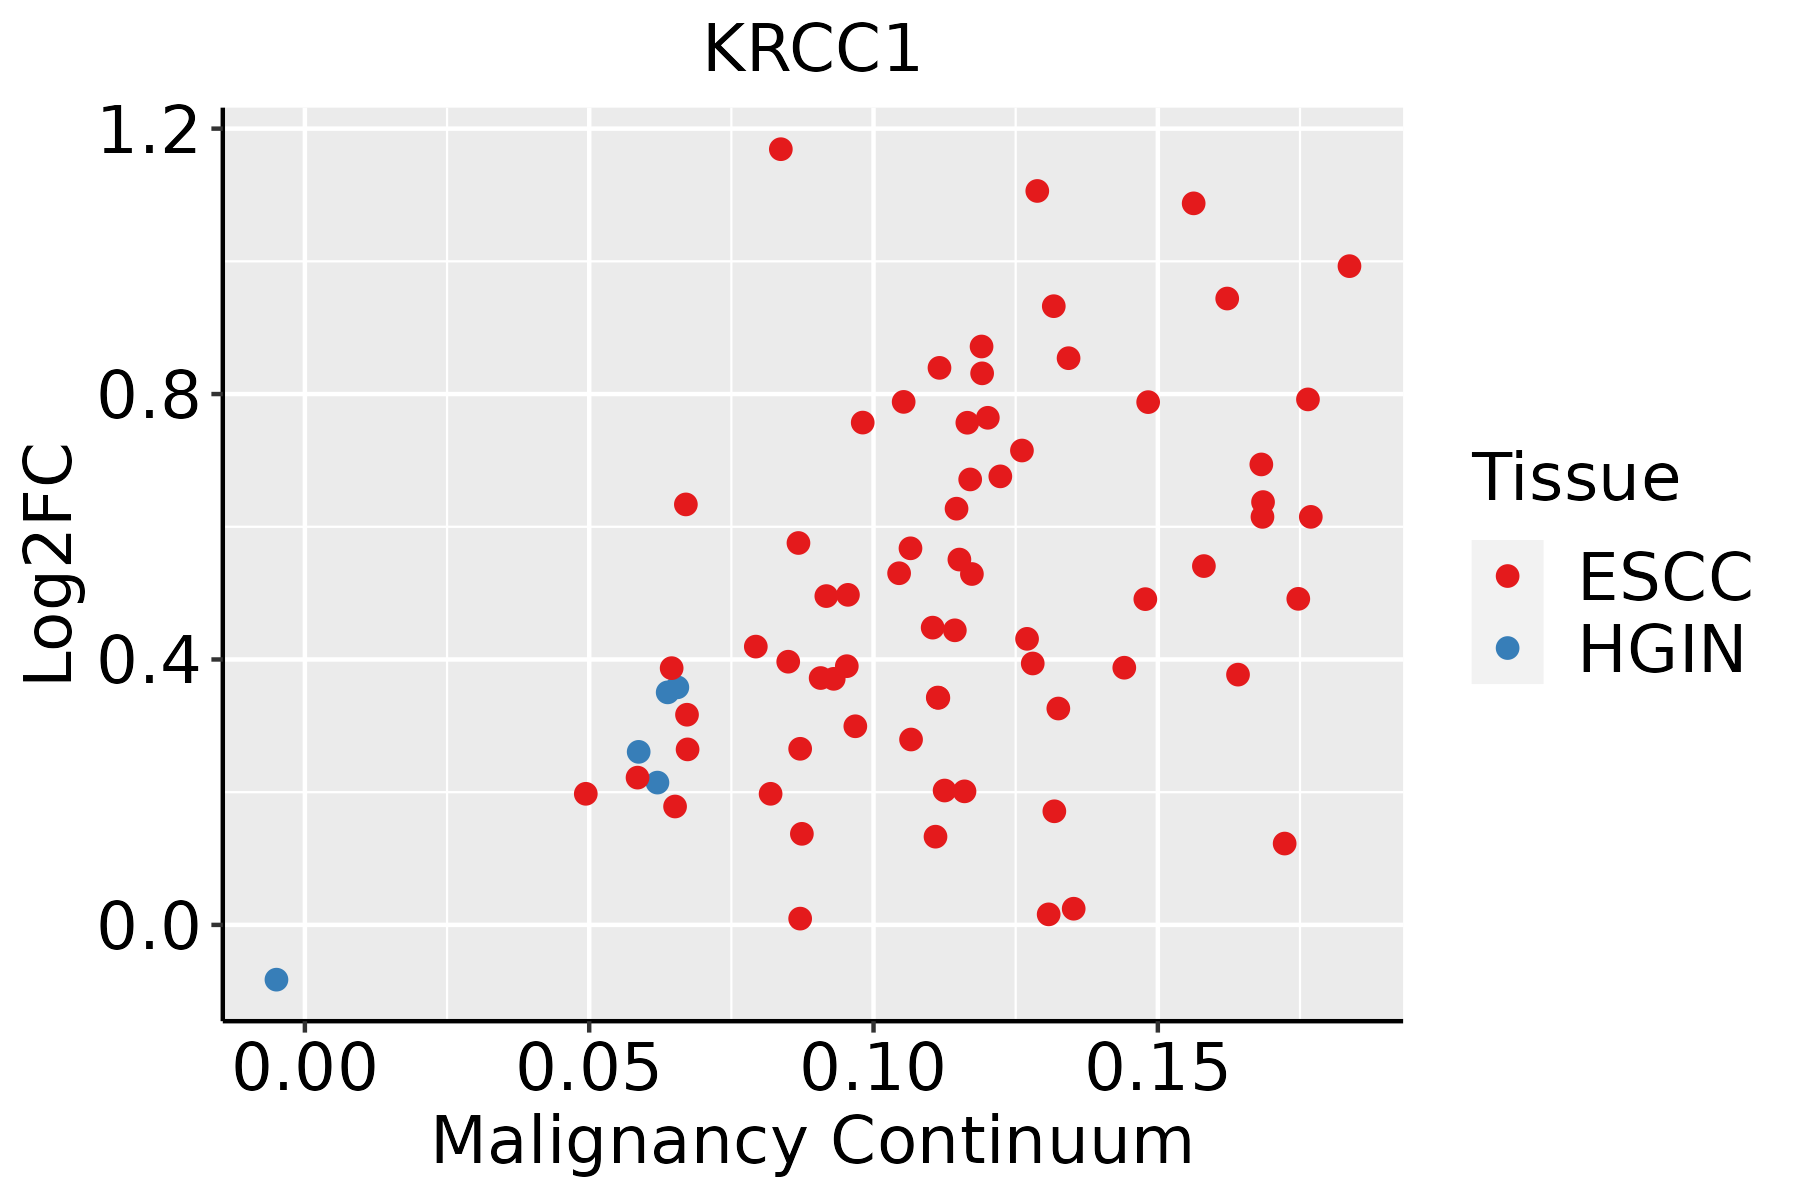 | ESCC: Esophageal squamous cell carcinoma |
| HGIN: High-grade intraepithelial neoplasias | ||
| LGIN: Low-grade intraepithelial neoplasias | ||
| Liver |  | HCC: Hepatocellular carcinoma |
| NAFLD: Non-alcoholic fatty liver disease | ||
| Oral Cavity | 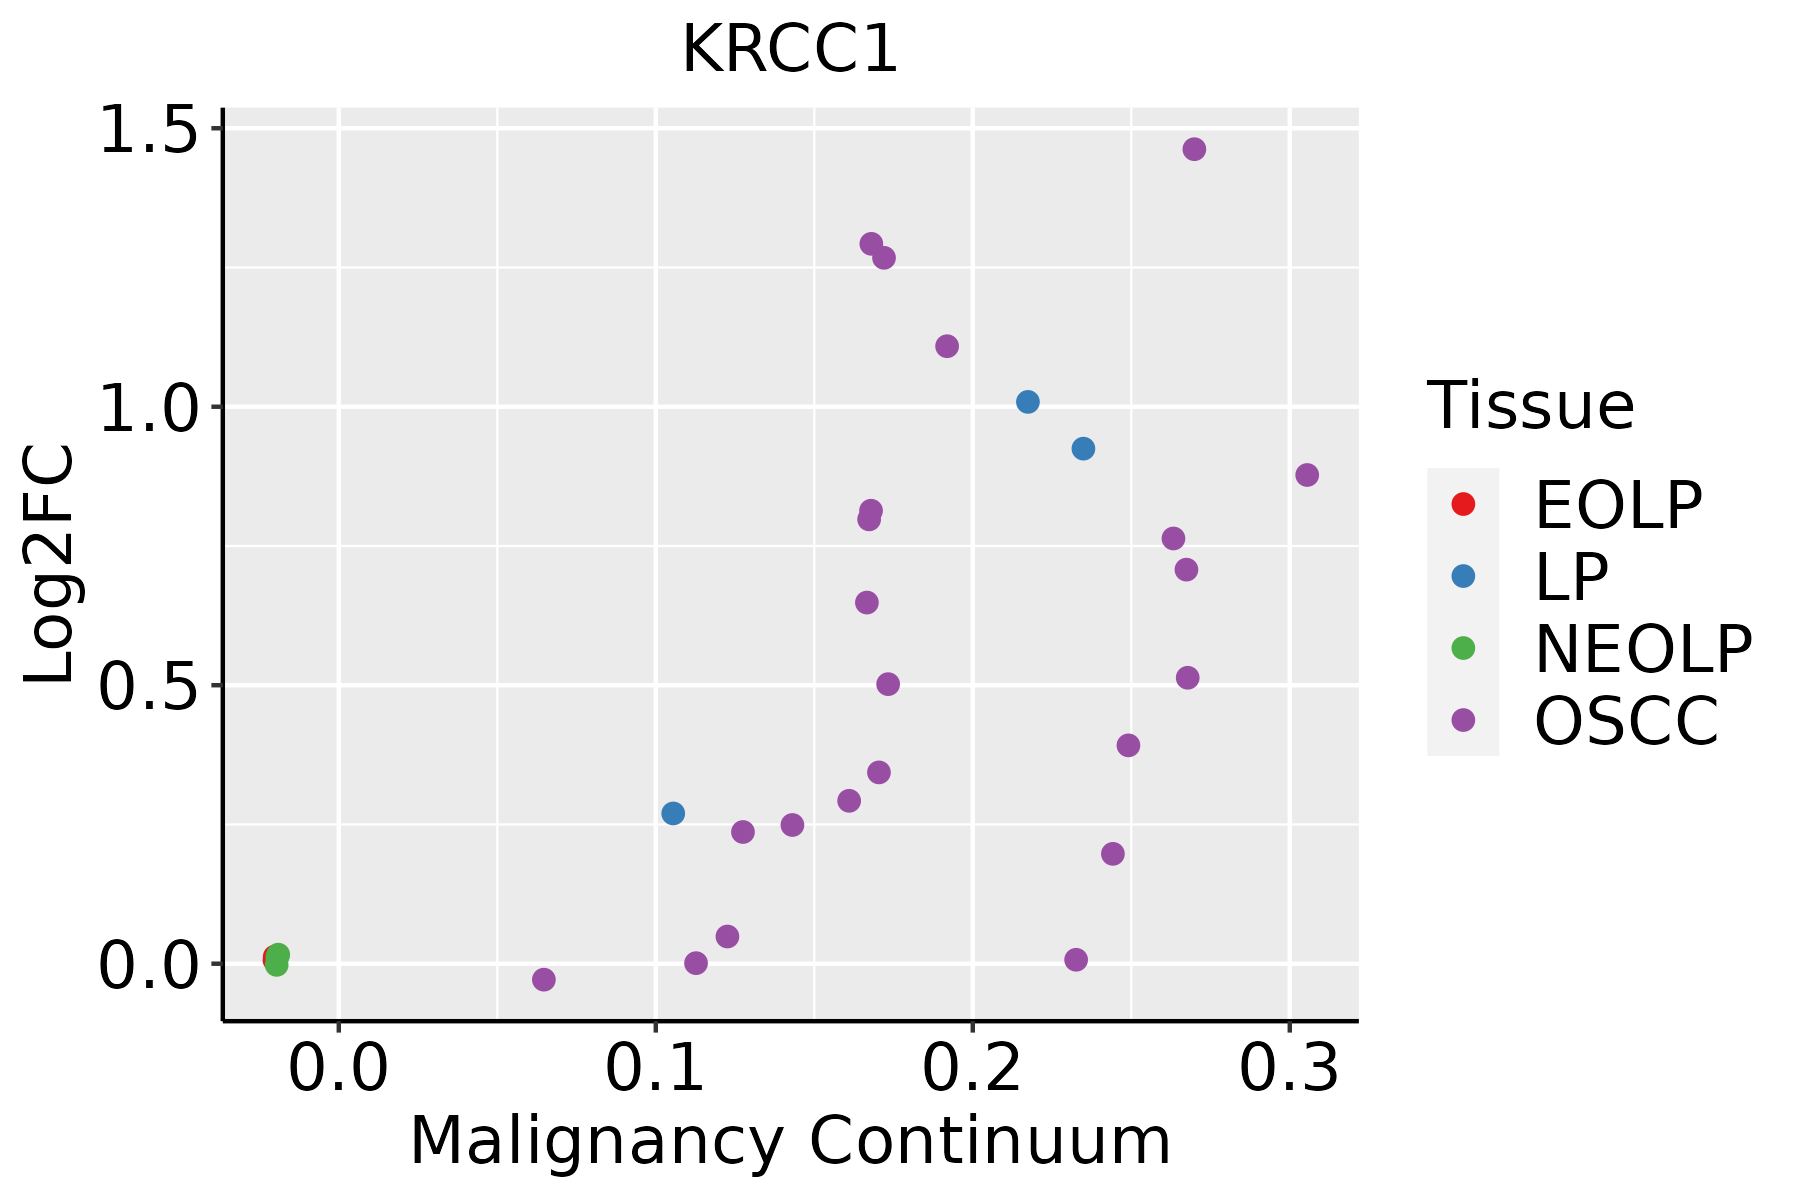 | EOLP: Erosive Oral lichen planus |
| LP: leukoplakia | ||
| NEOLP: Non-erosive oral lichen planus | ||
| OSCC: Oral squamous cell carcinoma | ||
| Prostate | 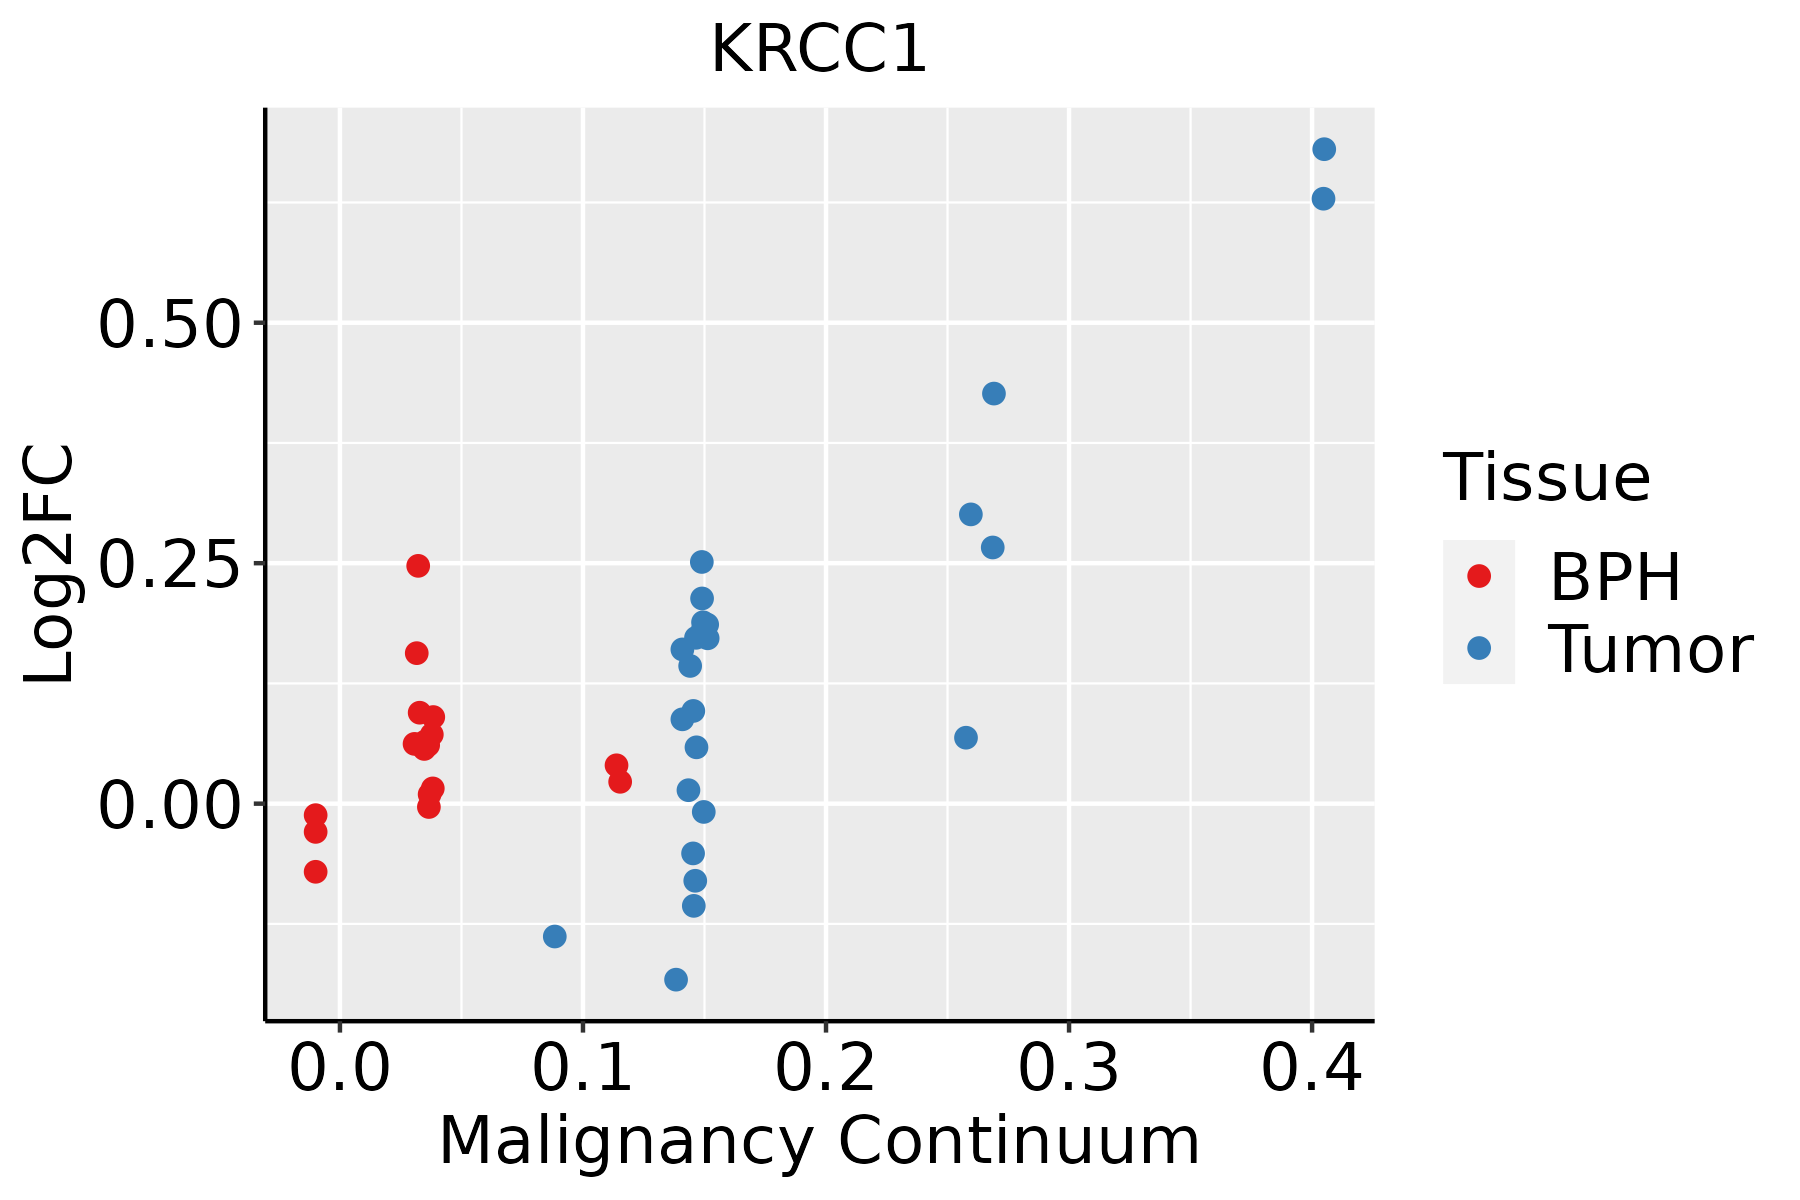 | BPH: Benign Prostatic Hyperplasia |
| Skin | 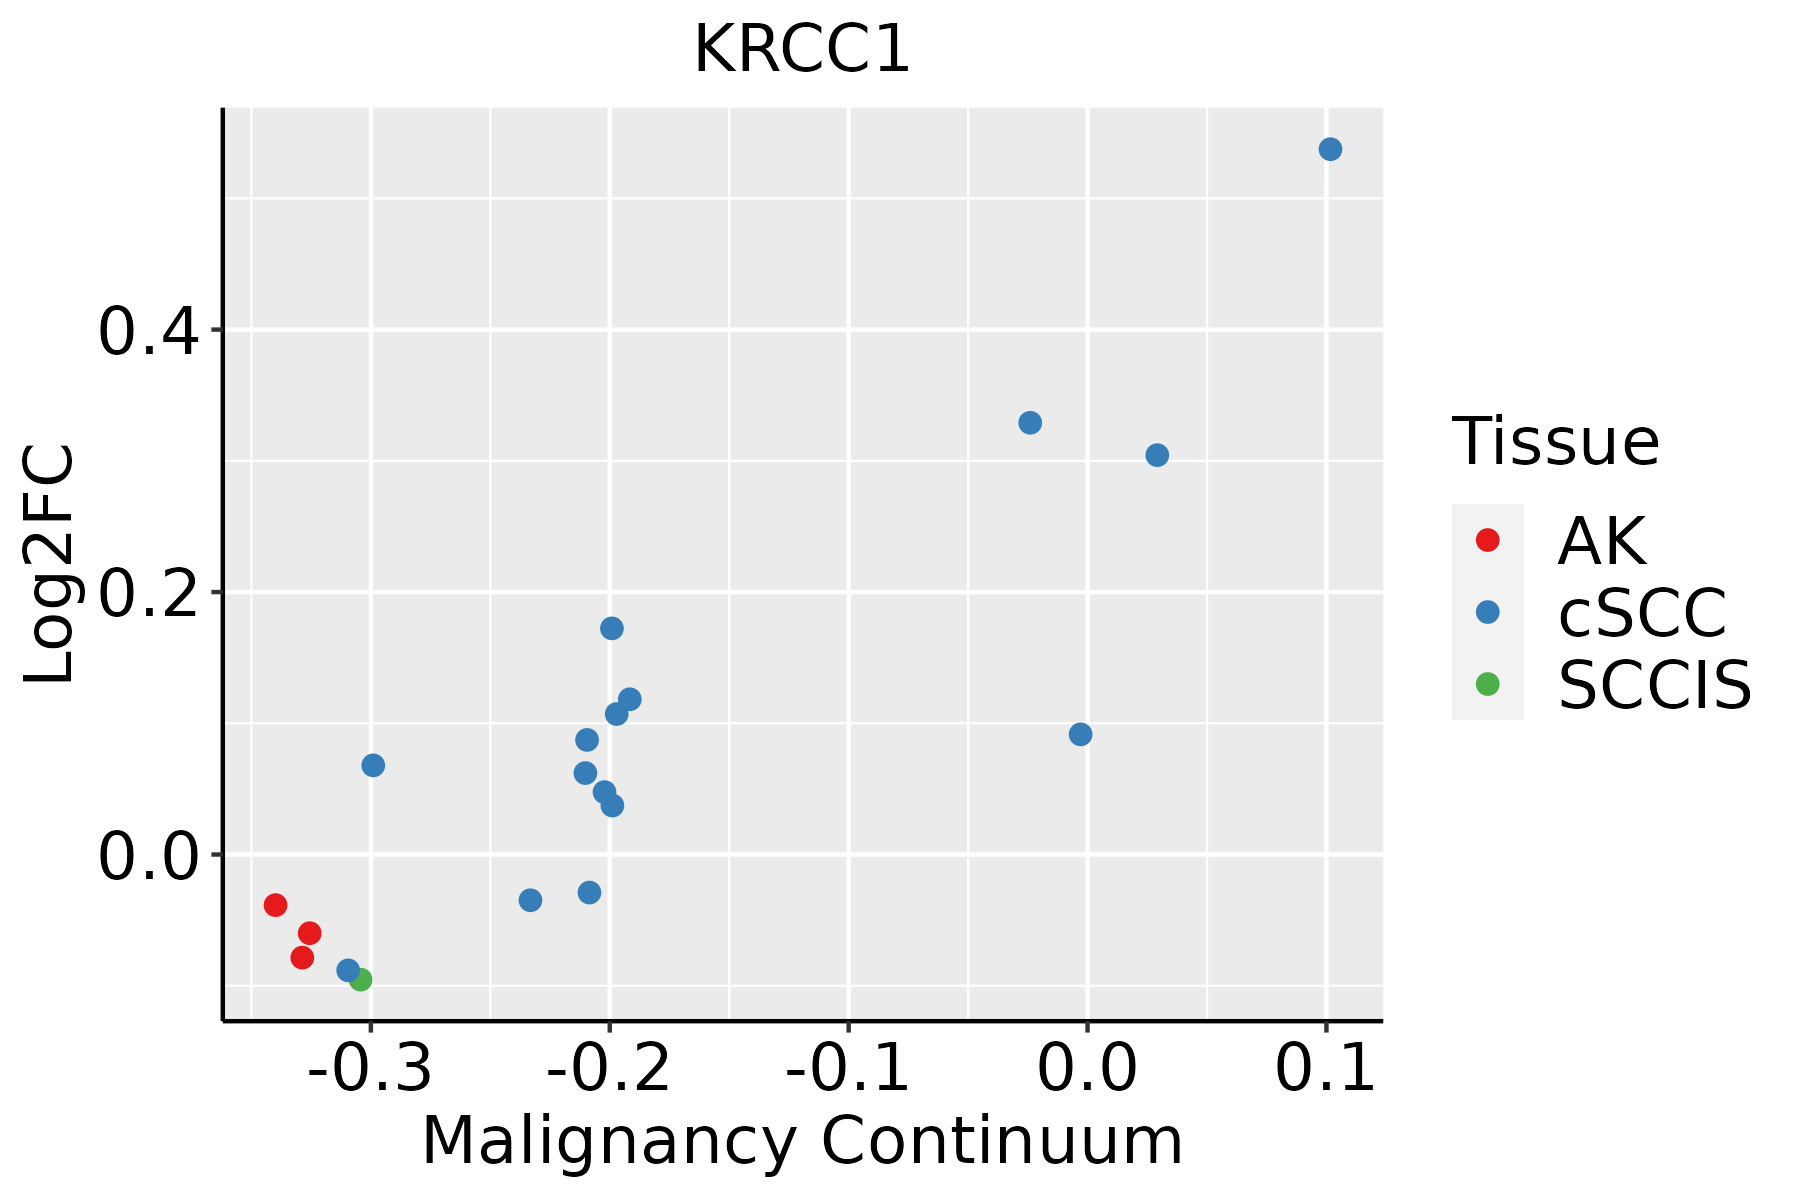 | AK: Actinic keratosis |
| cSCC: Cutaneous squamous cell carcinoma | ||
| SCCIS:squamous cell carcinoma in situ | ||
| Thyroid | 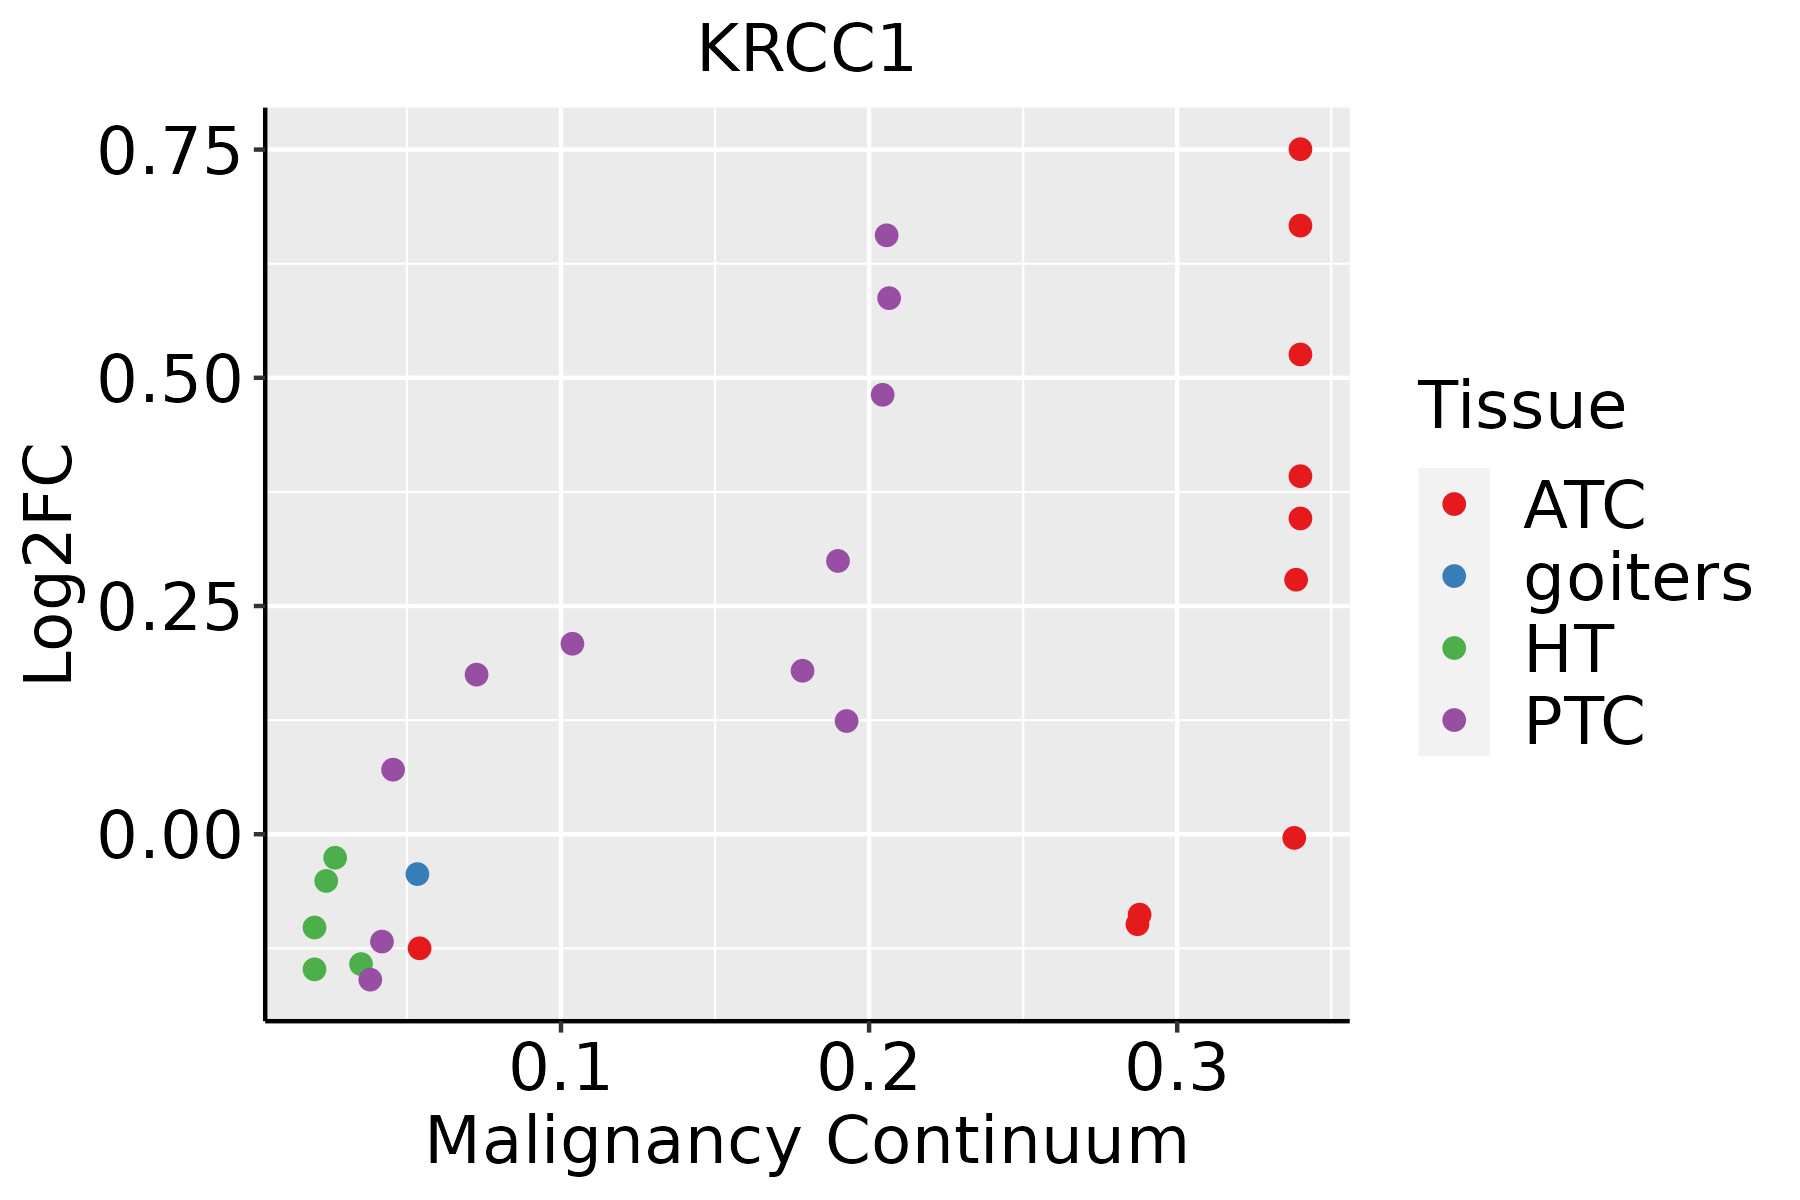 | ATC: Anaplastic thyroid cancer |
| HT: Hashimoto's thyroiditis | ||
| PTC: Papillary thyroid cancer |
| ∗log2FC in expression of this searched gene in stem-like cells from each diseased tissue sample relative to stem-like cells in normal samples in each tissue plotted against the malignancy continuum. Samples are colored based on if they are from different disease stage. |
Top |
Malignant transformation related pathway analysis |
| Find out the enriched GO biological processes and KEGG pathways involved in transition from healthy to precancer to cancer |
| Tissue | Disease Stage | Enriched GO biological Processes |
| Colorectum | AD |  |
| Colorectum | SER |  |
| Colorectum | MSS |  |
| Colorectum | MSI-H |  |
| Colorectum | FAP |  |
| ∗Top 15 enriched GO BP terms are showed in the bar plot of each disease state in each tissue. Each row represents a significant GO biological process which is colored according to the -log10(p.adjust). |
| Page: 1 2 3 4 5 6 7 8 9 |
| GO ID | Tissue | Disease Stage | Description | Gene Ratio | Bg Ratio | pvalue | p.adjust | Count |
| Page: 1 |
| Pathway ID | Tissue | Disease Stage | Description | Gene Ratio | Bg Ratio | pvalue | p.adjust | qvalue | Count |
| Page: 1 |
Top |
Cell-cell communication analysis |
| Identification of potential cell-cell interactions between two cell types and their ligand-receptor pairs for different disease states |
| Ligand | Receptor | LRpair | Pathway | Tissue | Disease Stage |
| Page: 1 |
Top |
Single-cell gene regulatory network inference analysis |
| Find out the significant the regulons (TFs) and the target genes of each regulon across cell types for different disease states |
| TF | Cell Type | Tissue | Disease Stage | Target Gene | RSS | Regulon Activity |
| ∗The dot plots of a searched regulon are shown for all cell subpopulations in each disease state of each tissue based on the regulon specific score inferred using pySCENIC and by calculating the average expression. |
| Page: 1 |
Top |
Somatic mutation of malignant transformation related genes |
| Annotation of somatic variants for genes involved in malignant transformation |
| Hugo Symbol | Variant Class | Variant Classification | dbSNP RS | HGVSc | HGVSp | HGVSp Short | SWISSPROT | BIOTYPE | SIFT | PolyPhen | Tumor Sample Barcode | Tissue | Histology | Sex | Age | Stage | Therapy Types | Drugs | Outcome |
| KRCC1 | SNV | Missense_Mutation | novel | c.37N>T | p.Asp13Tyr | p.D13Y | Q9NPI7 | protein_coding | deleterious(0) | probably_damaging(0.983) | TCGA-A8-A09Q-01 | Breast | breast invasive carcinoma | Female | >=65 | III/IV | Hormone Therapy | anastrozole | SD |
| KRCC1 | SNV | Missense_Mutation | c.15N>T | p.Lys5Asn | p.K5N | Q9NPI7 | protein_coding | tolerated(0.08) | benign(0.051) | TCGA-AG-A002-01 | Colorectum | rectum adenocarcinoma | Male | <65 | I/II | Unknown | Unknown | SD | |
| KRCC1 | SNV | Missense_Mutation | c.490C>T | p.Pro164Ser | p.P164S | Q9NPI7 | protein_coding | tolerated(0.76) | benign(0.124) | TCGA-AH-6897-01 | Colorectum | rectum adenocarcinoma | Male | <65 | I/II | Unknown | Unknown | SD | |
| KRCC1 | SNV | Missense_Mutation | novel | c.549N>A | p.Ser183Arg | p.S183R | Q9NPI7 | protein_coding | tolerated(0.19) | benign(0.005) | TCGA-A5-A0G2-01 | Endometrium | uterine corpus endometrioid carcinoma | Female | <65 | III/IV | Unknown | Unknown | SD |
| KRCC1 | SNV | Missense_Mutation | novel | c.357N>A | p.Asn119Lys | p.N119K | Q9NPI7 | protein_coding | deleterious(0.01) | benign(0.232) | TCGA-A5-A0G2-01 | Endometrium | uterine corpus endometrioid carcinoma | Female | <65 | III/IV | Unknown | Unknown | SD |
| KRCC1 | SNV | Missense_Mutation | rs147560562 | c.164C>T | p.Thr55Met | p.T55M | Q9NPI7 | protein_coding | deleterious(0.02) | benign(0.001) | TCGA-A5-A1OF-01 | Endometrium | uterine corpus endometrioid carcinoma | Female | <65 | I/II | Unknown | Unknown | SD |
| KRCC1 | SNV | Missense_Mutation | rs779719379 | c.320N>T | p.Thr107Met | p.T107M | Q9NPI7 | protein_coding | deleterious(0.01) | possibly_damaging(0.897) | TCGA-AJ-A8CW-01 | Endometrium | uterine corpus endometrioid carcinoma | Female | <65 | I/II | Unknown | Unknown | SD |
| KRCC1 | SNV | Missense_Mutation | c.635N>C | p.Glu212Ala | p.E212A | Q9NPI7 | protein_coding | tolerated(0.3) | benign(0.021) | TCGA-AP-A056-01 | Endometrium | uterine corpus endometrioid carcinoma | Female | <65 | I/II | Unknown | Unknown | SD | |
| KRCC1 | SNV | Missense_Mutation | novel | c.764N>A | p.Ser255Tyr | p.S255Y | Q9NPI7 | protein_coding | deleterious(0) | possibly_damaging(0.895) | TCGA-AP-A0LM-01 | Endometrium | uterine corpus endometrioid carcinoma | Female | <65 | III/IV | Chemotherapy | cisplatin | SD |
| KRCC1 | SNV | Missense_Mutation | novel | c.670N>T | p.Asp224Tyr | p.D224Y | Q9NPI7 | protein_coding | deleterious(0.01) | possibly_damaging(0.8) | TCGA-AP-A1DV-01 | Endometrium | uterine corpus endometrioid carcinoma | Female | <65 | I/II | Unknown | Unknown | SD |
| Page: 1 2 3 |
Top |
Related drugs of malignant transformation related genes |
| Identification of chemicals and drugs interact with genes involved in malignant transfromation |
| (DGIdb 4.0) |
| Entrez ID | Symbol | Category | Interaction Types | Drug Claim Name | Drug Name | PMIDs |
| Page: 1 |

Copyright 2023-Present -The University of Texas Health Science Center at Houston |