
|
|||||
|
 | |
| |
| |
| |
| |
| |
|
Gene: KIZ |
Gene summary for KIZ |
| Gene information | Species | Human | Gene symbol | KIZ | Gene ID | 55857 |
| Gene name | kizuna centrosomal protein | |
| Gene Alias | C20orf19 | |
| Cytomap | 20p11.23 | |
| Gene Type | protein-coding | GO ID | GO:0000226 | UniProtAcc | Q2M2Z5 |
Top |
Malignant transformation analysis |
| Identification of the aberrant gene expression in precancerous and cancerous lesions by comparing the gene expression of stem-like cells in diseased tissues with normal stem cells |
| Entrez ID | Symbol | Replicates | Species | Organ | Tissue | Adj P-value | Log2FC | Malignancy |
| 55857 | KIZ | ATC1 | Human | Thyroid | ATC | 5.28e-04 | 1.40e-01 | 0.2878 |
| 55857 | KIZ | ATC4 | Human | Thyroid | ATC | 7.54e-11 | 2.64e-01 | 0.34 |
| 55857 | KIZ | ATC5 | Human | Thyroid | ATC | 4.35e-20 | 1.91e-01 | 0.34 |
| Page: 1 2 3 4 5 6 |
| Tissue | Expression Dynamics | Abbreviation |
| Endometrium | 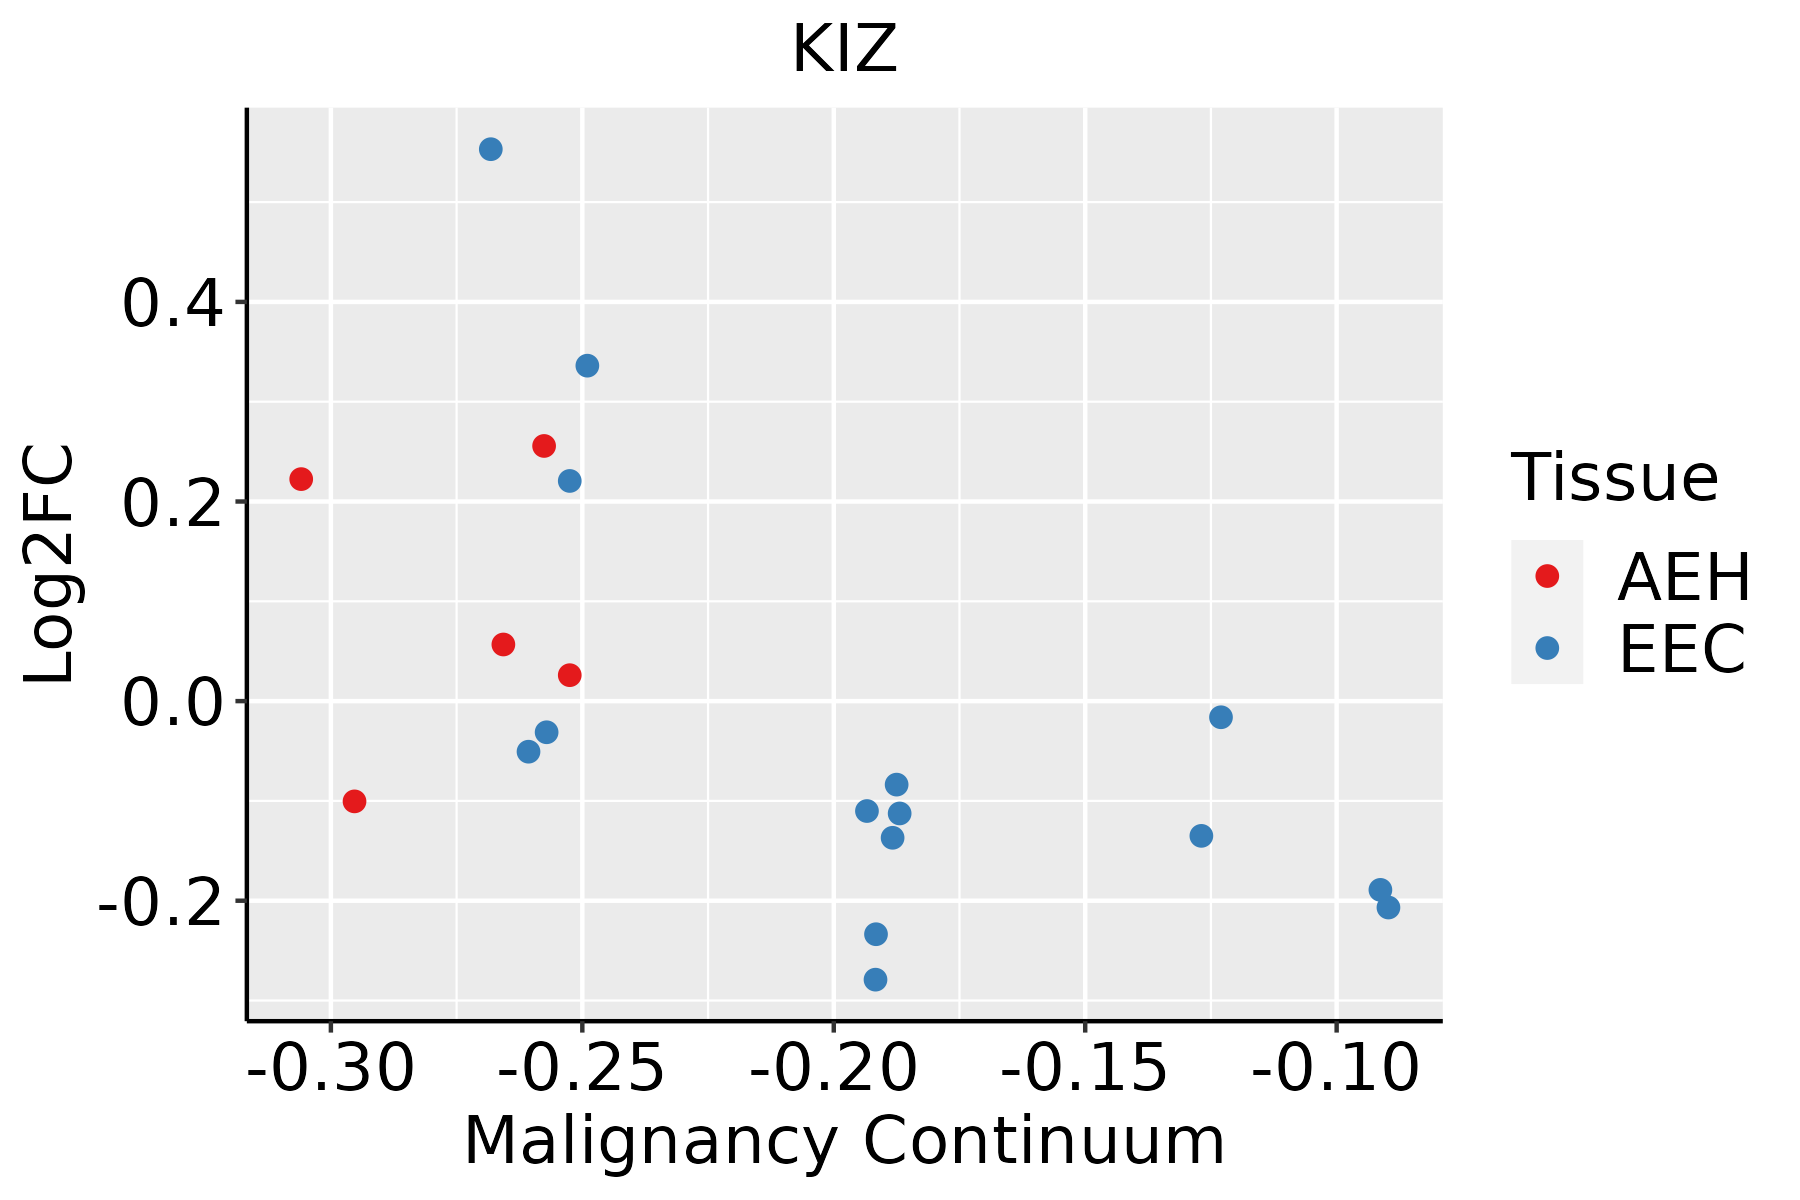 | AEH: Atypical endometrial hyperplasia |
| EEC: Endometrioid Cancer | ||
| Esophagus |  | ESCC: Esophageal squamous cell carcinoma |
| HGIN: High-grade intraepithelial neoplasias | ||
| LGIN: Low-grade intraepithelial neoplasias | ||
| Liver | 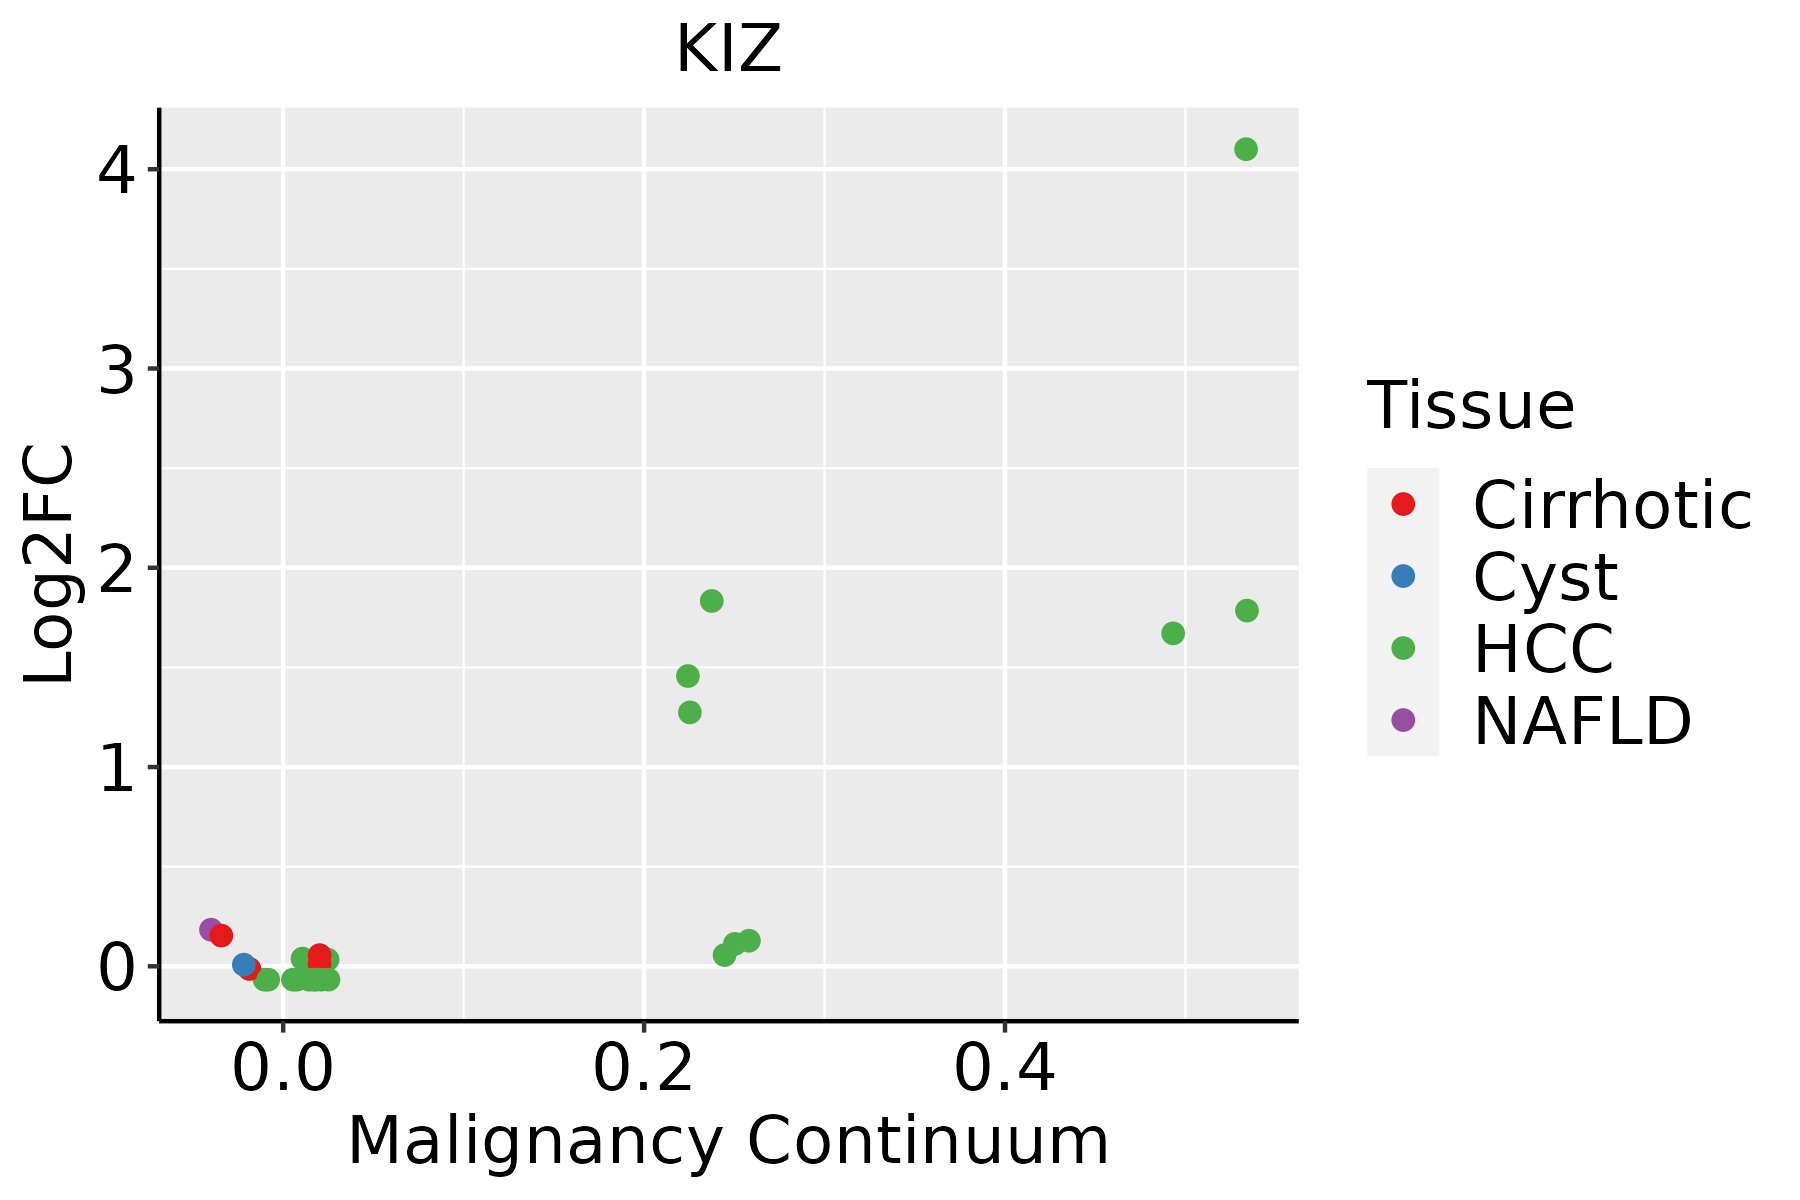 | HCC: Hepatocellular carcinoma |
| NAFLD: Non-alcoholic fatty liver disease | ||
| Oral Cavity |  | EOLP: Erosive Oral lichen planus |
| LP: leukoplakia | ||
| NEOLP: Non-erosive oral lichen planus | ||
| OSCC: Oral squamous cell carcinoma | ||
| Thyroid | 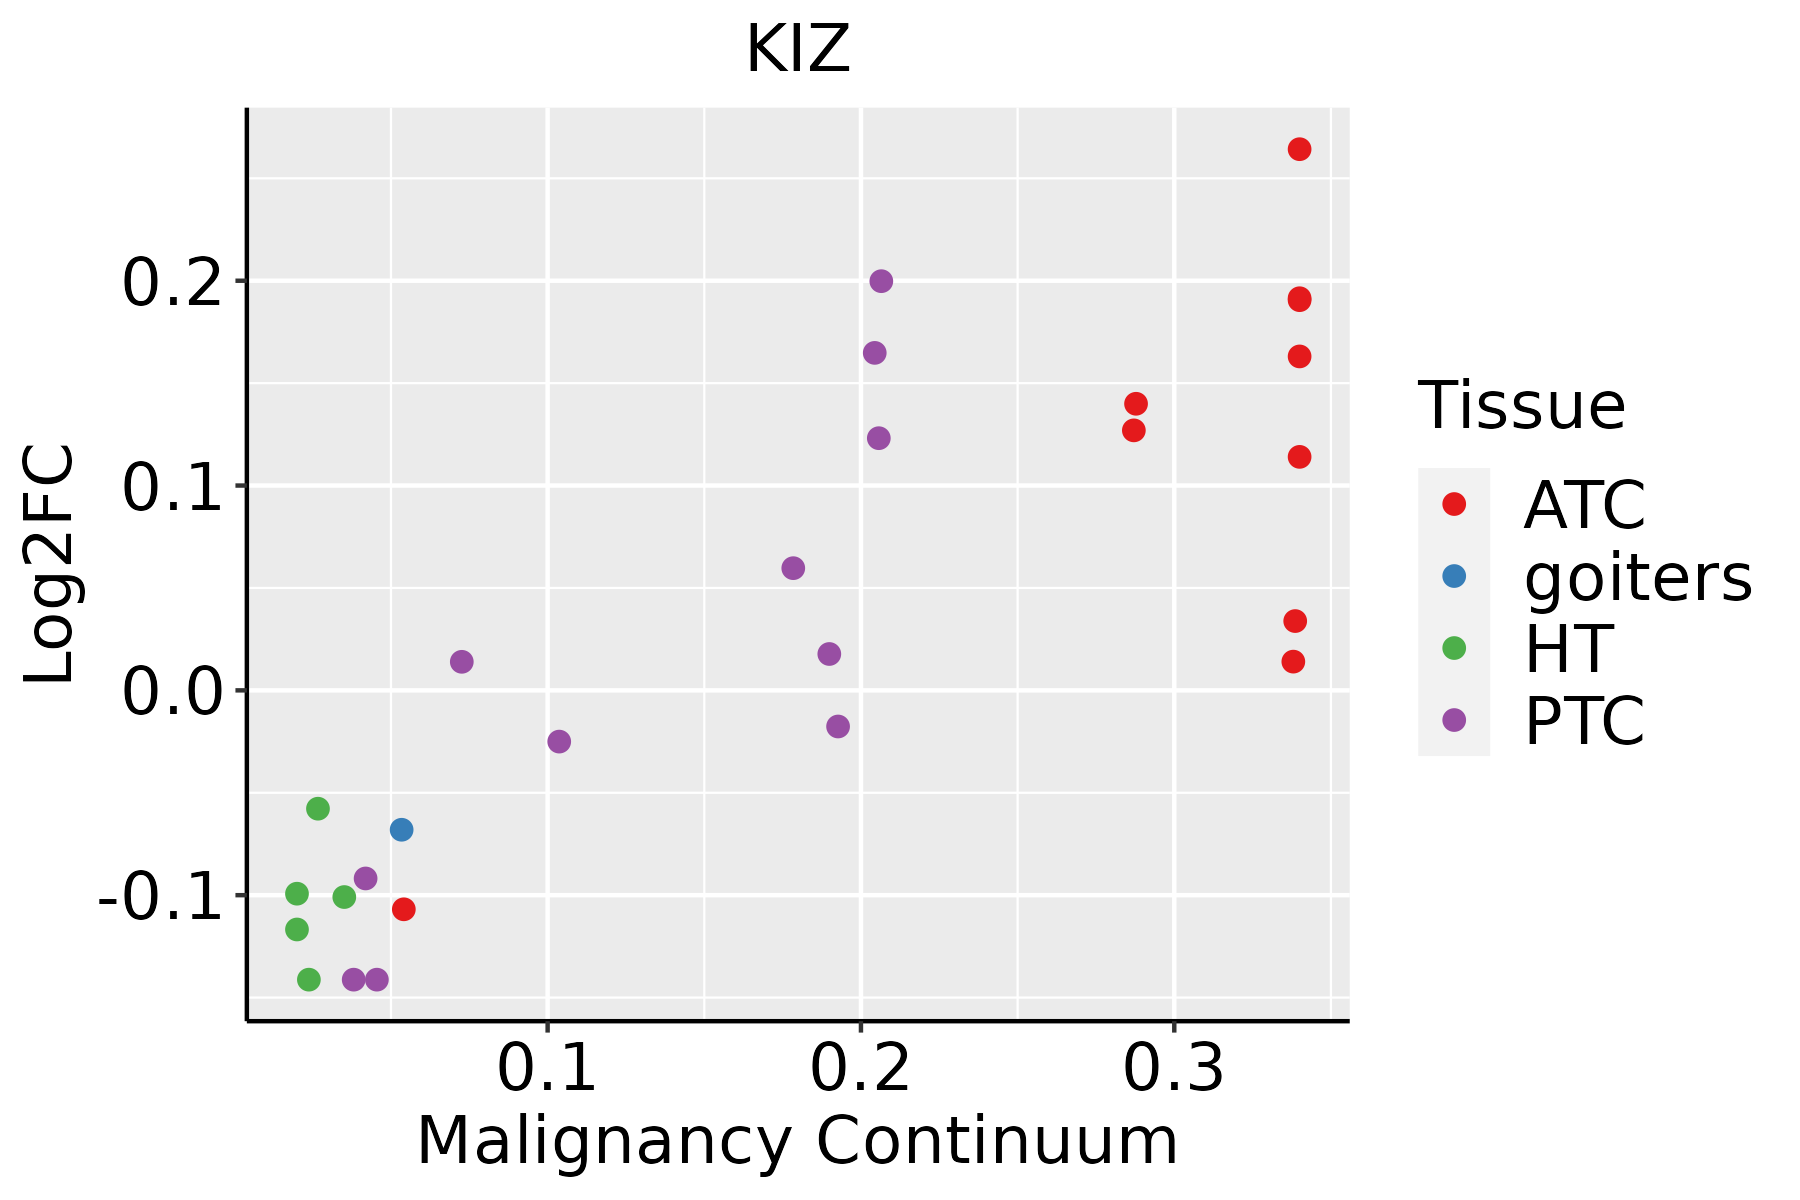 | ATC: Anaplastic thyroid cancer |
| HT: Hashimoto's thyroiditis | ||
| PTC: Papillary thyroid cancer |
| ∗log2FC in expression of this searched gene in stem-like cells from each diseased tissue sample relative to stem-like cells in normal samples in each tissue plotted against the malignancy continuum. Samples are colored based on if they are from different disease stage. |
Top |
Malignant transformation related pathway analysis |
| Find out the enriched GO biological processes and KEGG pathways involved in transition from healthy to precancer to cancer |
| Tissue | Disease Stage | Enriched GO biological Processes |
| Colorectum | AD |  |
| Colorectum | SER |  |
| Colorectum | MSS |  |
| Colorectum | MSI-H |  |
| Colorectum | FAP |  |
| ∗Top 15 enriched GO BP terms are showed in the bar plot of each disease state in each tissue. Each row represents a significant GO biological process which is colored according to the -log10(p.adjust). |
| Page: 1 2 3 4 5 6 7 8 9 |
| GO ID | Tissue | Disease Stage | Description | Gene Ratio | Bg Ratio | pvalue | p.adjust | Count |
| GO:000705114 | Esophagus | ESCC | spindle organization | 134/8552 | 184/18723 | 5.70e-14 | 2.87e-12 | 134 |
| GO:000705111 | Liver | HCC | spindle organization | 116/7958 | 184/18723 | 1.40e-08 | 3.40e-07 | 116 |
| GO:00070517 | Oral cavity | OSCC | spindle organization | 117/7305 | 184/18723 | 1.16e-11 | 4.17e-10 | 117 |
| GO:000705113 | Oral cavity | LP | spindle organization | 72/4623 | 184/18723 | 9.67e-06 | 1.78e-04 | 72 |
| GO:000705116 | Thyroid | PTC | spindle organization | 92/5968 | 184/18723 | 2.21e-07 | 3.92e-06 | 92 |
| GO:000705122 | Thyroid | ATC | spindle organization | 109/6293 | 184/18723 | 7.99e-13 | 3.46e-11 | 109 |
| Page: 1 |
| Pathway ID | Tissue | Disease Stage | Description | Gene Ratio | Bg Ratio | pvalue | p.adjust | qvalue | Count |
| Page: 1 |
Top |
Cell-cell communication analysis |
| Identification of potential cell-cell interactions between two cell types and their ligand-receptor pairs for different disease states |
| Ligand | Receptor | LRpair | Pathway | Tissue | Disease Stage |
| Page: 1 |
Top |
Single-cell gene regulatory network inference analysis |
| Find out the significant the regulons (TFs) and the target genes of each regulon across cell types for different disease states |
| TF | Cell Type | Tissue | Disease Stage | Target Gene | RSS | Regulon Activity |
| ∗The dot plots of a searched regulon are shown for all cell subpopulations in each disease state of each tissue based on the regulon specific score inferred using pySCENIC and by calculating the average expression. |
| Page: 1 |
Top |
Somatic mutation of malignant transformation related genes |
| Annotation of somatic variants for genes involved in malignant transformation |
| Hugo Symbol | Variant Class | Variant Classification | dbSNP RS | HGVSc | HGVSp | HGVSp Short | SWISSPROT | BIOTYPE | SIFT | PolyPhen | Tumor Sample Barcode | Tissue | Histology | Sex | Age | Stage | Therapy Types | Drugs | Outcome |
| KIZ | SNV | Missense_Mutation | novel | c.1963N>C | p.Glu655Gln | p.E655Q | Q2M2Z5 | protein_coding | deleterious(0) | probably_damaging(0.998) | TCGA-A2-A0YK-01 | Breast | breast invasive carcinoma | Female | <65 | I/II | Chemotherapy | cytoxan | SD |
| KIZ | insertion | Nonsense_Mutation | novel | c.909_910insTGGTGACCACTTCCCTATGGGACAGCTGGATGCAGC | p.Ile303_Leu304insTrpTerProLeuProTyrGlyThrAlaGlyCysSer | p.I303_L304insW*PLPYGTAGCS | Q2M2Z5 | protein_coding | TCGA-AO-A0JB-01 | Breast | breast invasive carcinoma | Female | <65 | III/IV | Chemotherapy | cyclophosphamide | SD | ||
| KIZ | insertion | Nonsense_Mutation | novel | c.624_625insTAAACAATTAGGTG | p.Val209Ter | p.V209* | Q2M2Z5 | protein_coding | TCGA-AR-A0U0-01 | Breast | breast invasive carcinoma | Female | >=65 | I/II | Unknown | Unknown | SD | ||
| KIZ | SNV | Missense_Mutation | novel | c.551A>C | p.Lys184Thr | p.K184T | Q2M2Z5 | protein_coding | deleterious(0) | possibly_damaging(0.801) | TCGA-EA-A3HU-01 | Cervix | cervical & endocervical cancer | Female | <65 | I/II | Unknown | Unknown | SD |
| KIZ | SNV | Missense_Mutation | novel | c.300N>T | p.Lys100Asn | p.K100N | Q2M2Z5 | protein_coding | tolerated(0.07) | probably_damaging(0.962) | TCGA-A6-A566-01 | Colorectum | colon adenocarcinoma | Female | <65 | III/IV | Chemotherapy | oxaliplatin | PD |
| KIZ | SNV | Missense_Mutation | novel | c.469N>G | p.Thr157Ala | p.T157A | Q2M2Z5 | protein_coding | deleterious(0.02) | benign(0.01) | TCGA-AA-3495-01 | Colorectum | colon adenocarcinoma | Male | >=65 | I/II | Unknown | Unknown | SD |
| KIZ | SNV | Missense_Mutation | novel | c.565N>A | p.Pro189Thr | p.P189T | Q2M2Z5 | protein_coding | deleterious(0) | possibly_damaging(0.676) | TCGA-AA-3854-01 | Colorectum | colon adenocarcinoma | Female | >=65 | I/II | Unknown | Unknown | SD |
| KIZ | SNV | Missense_Mutation | novel | c.1838C>T | p.Ser613Leu | p.S613L | Q2M2Z5 | protein_coding | tolerated(0.09) | benign(0.042) | TCGA-AA-A00N-01 | Colorectum | colon adenocarcinoma | Male | >=65 | I/II | Unknown | Unknown | PD |
| KIZ | SNV | Missense_Mutation | novel | c.1172N>A | p.Ser391Asn | p.S391N | Q2M2Z5 | protein_coding | tolerated(0.17) | benign(0.031) | TCGA-AZ-4313-01 | Colorectum | colon adenocarcinoma | Female | <65 | I/II | Unknown | Unknown | SD |
| KIZ | SNV | Missense_Mutation | novel | c.1784N>A | p.Gly595Asp | p.G595D | Q2M2Z5 | protein_coding | deleterious(0) | probably_damaging(0.912) | TCGA-CA-6717-01 | Colorectum | colon adenocarcinoma | Male | <65 | I/II | Chemotherapy | oxaliplatin | CR |
| Page: 1 2 3 4 5 6 7 8 |
Top |
Related drugs of malignant transformation related genes |
| Identification of chemicals and drugs interact with genes involved in malignant transfromation |
| (DGIdb 4.0) |
| Entrez ID | Symbol | Category | Interaction Types | Drug Claim Name | Drug Name | PMIDs |
| Page: 1 |

Copyright 2023-Present -The University of Texas Health Science Center at Houston |