| Tissue | Expression Dynamics | Abbreviation |
| Cervix | 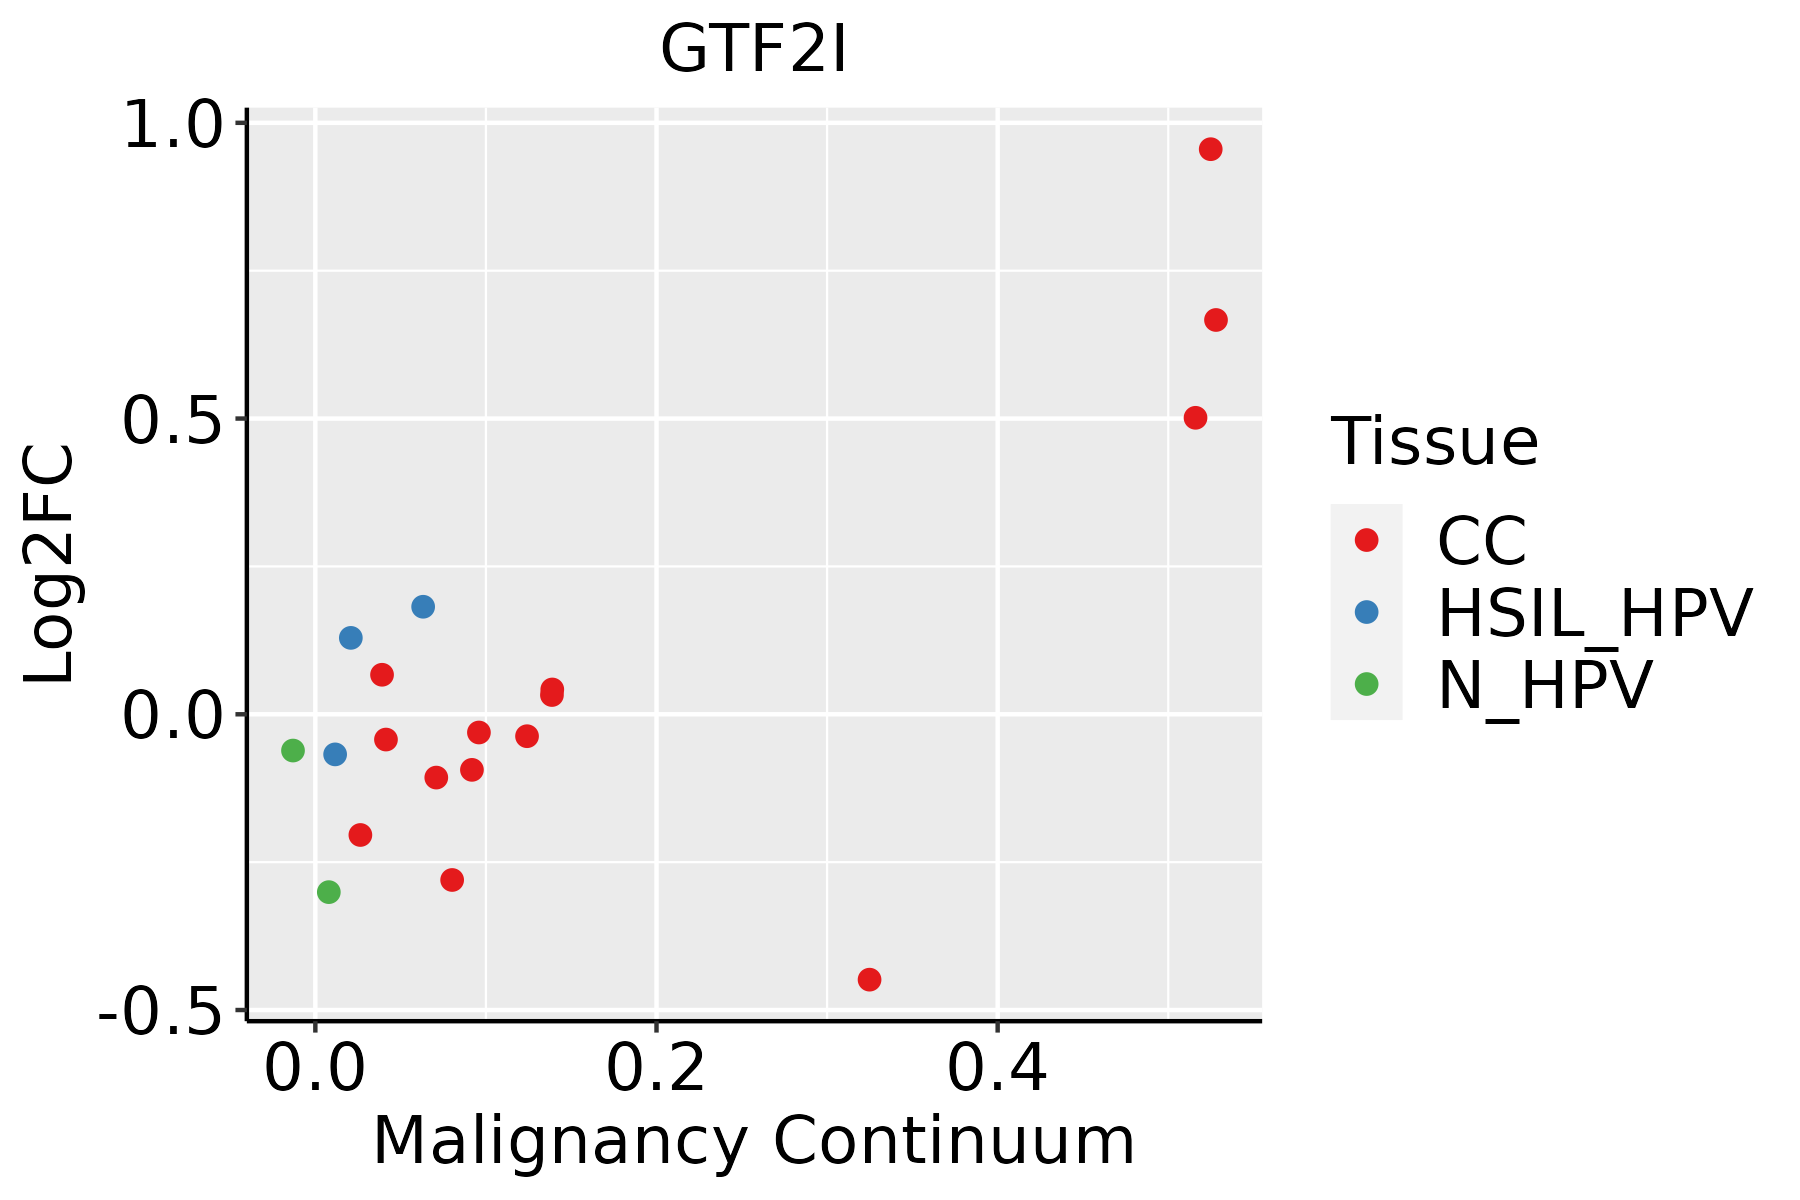 | CC: Cervix cancer |
| HSIL_HPV: HPV-infected high-grade squamous intraepithelial lesions |
| N_HPV: HPV-infected normal cervix |
| Colorectum (GSE201348) |  | FAP: Familial adenomatous polyposis |
| CRC: Colorectal cancer |
| Colorectum (HTA11) |  | AD: Adenomas |
| SER: Sessile serrated lesions |
| MSI-H: Microsatellite-high colorectal cancer |
| MSS: Microsatellite stable colorectal cancer |
| Endometrium | 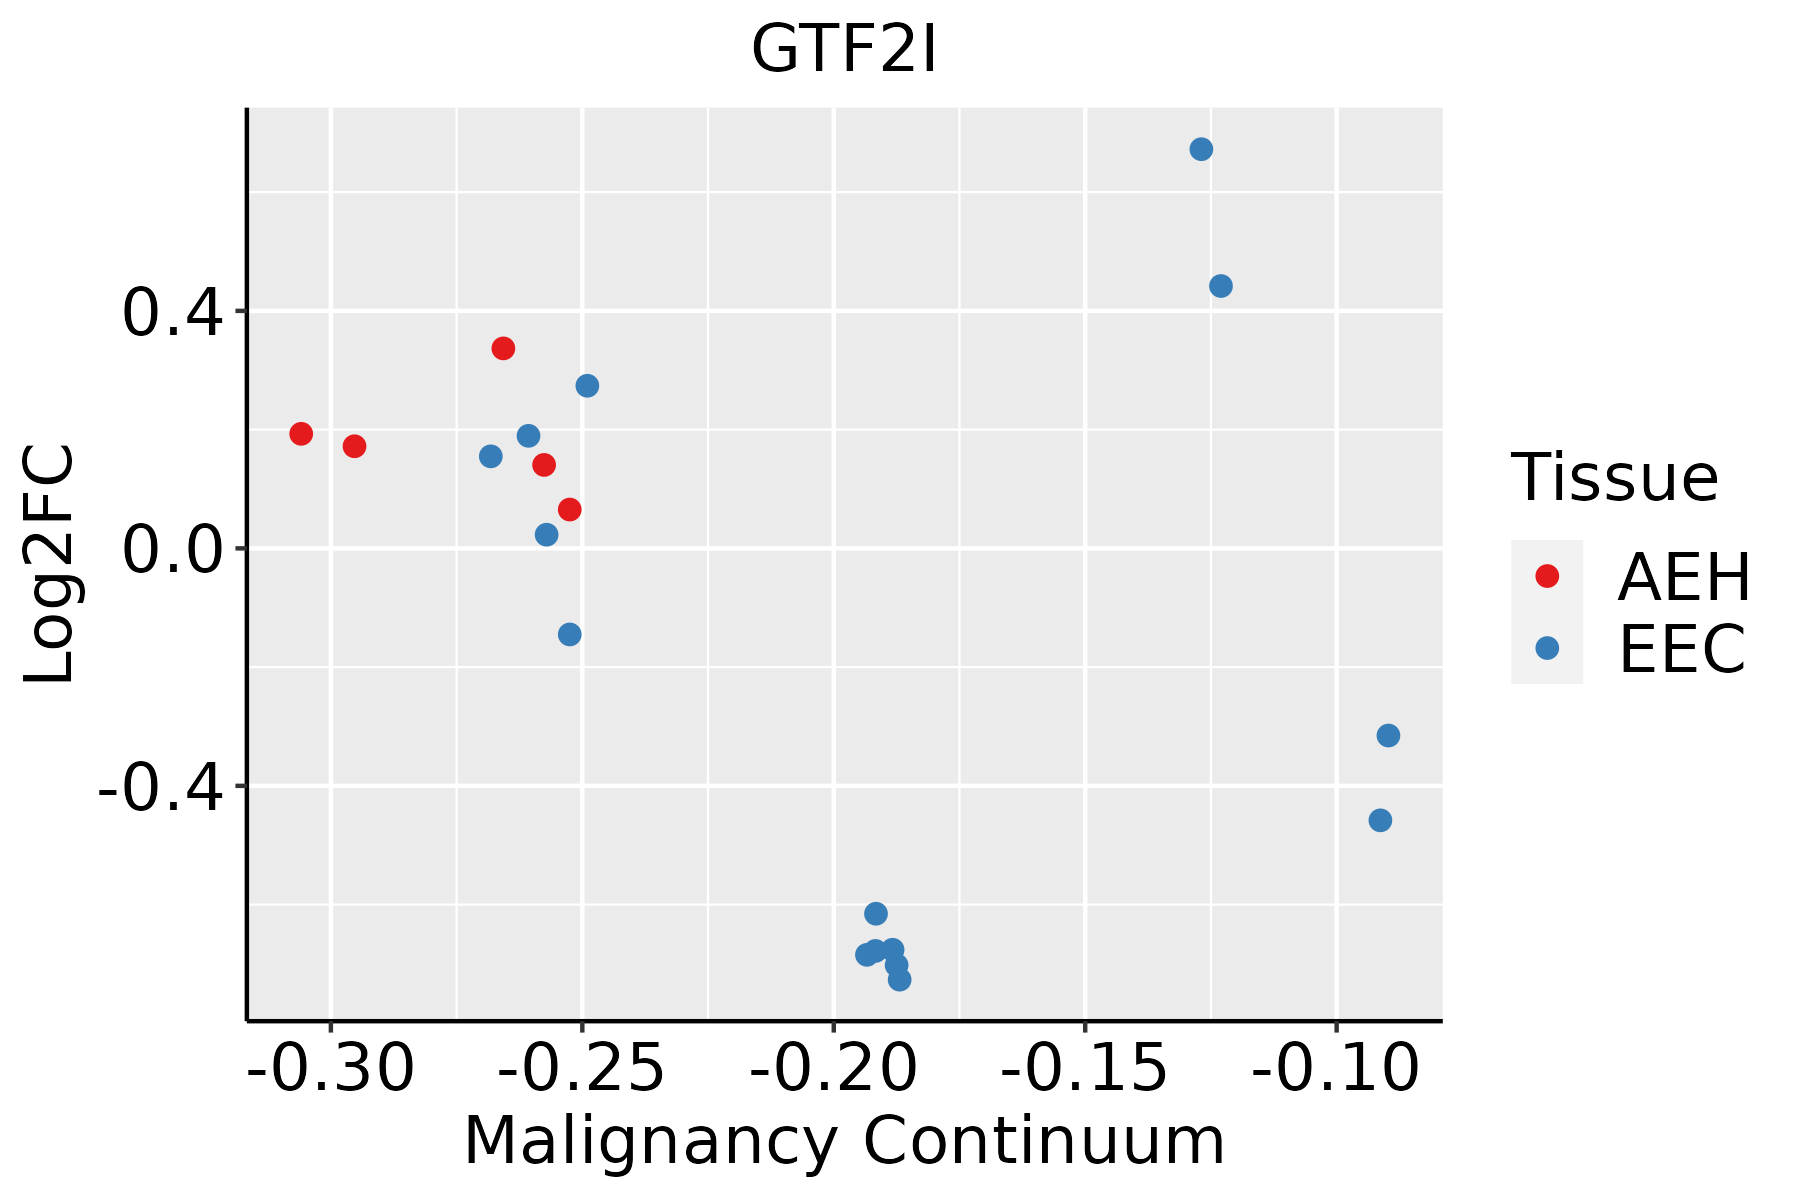 | AEH: Atypical endometrial hyperplasia |
| EEC: Endometrioid Cancer |
| Esophagus | 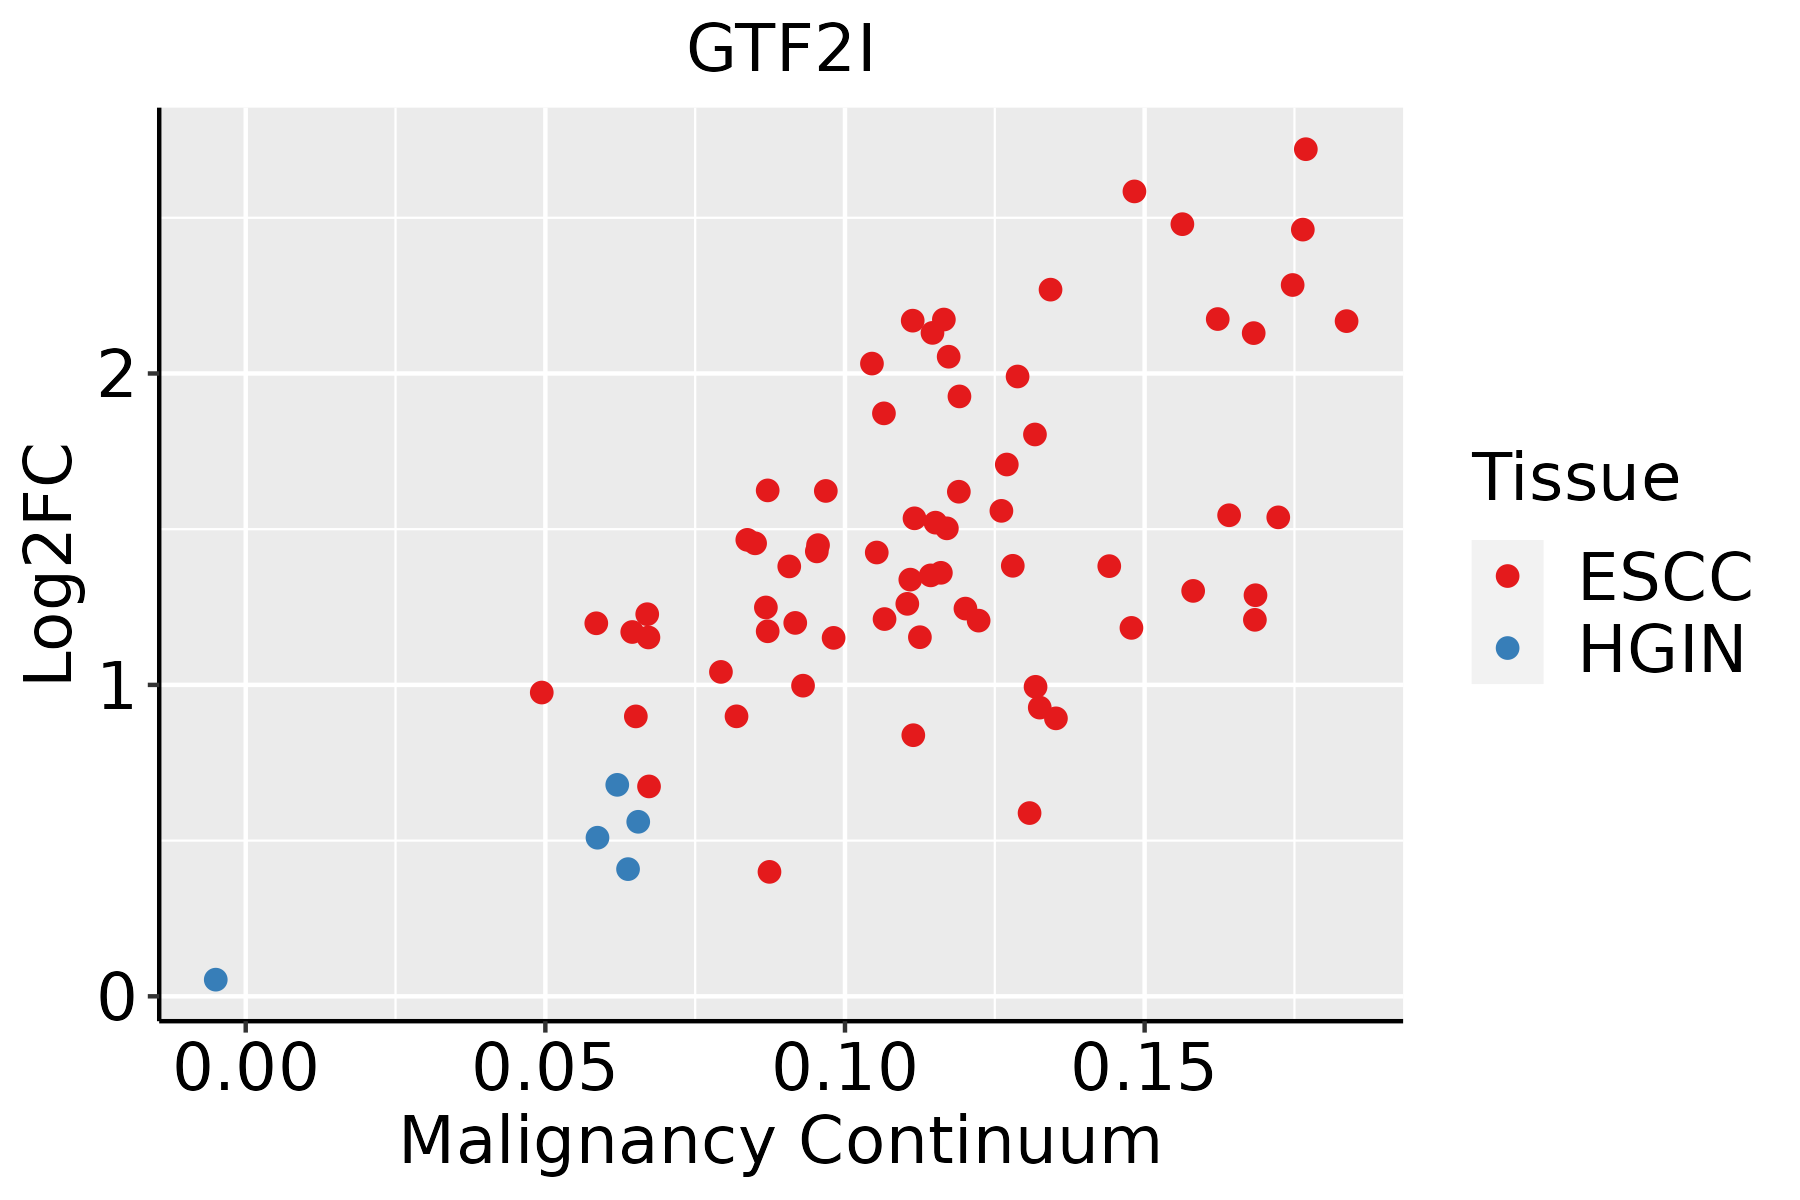 | ESCC: Esophageal squamous cell carcinoma |
| HGIN: High-grade intraepithelial neoplasias |
| LGIN: Low-grade intraepithelial neoplasias |
| GC | 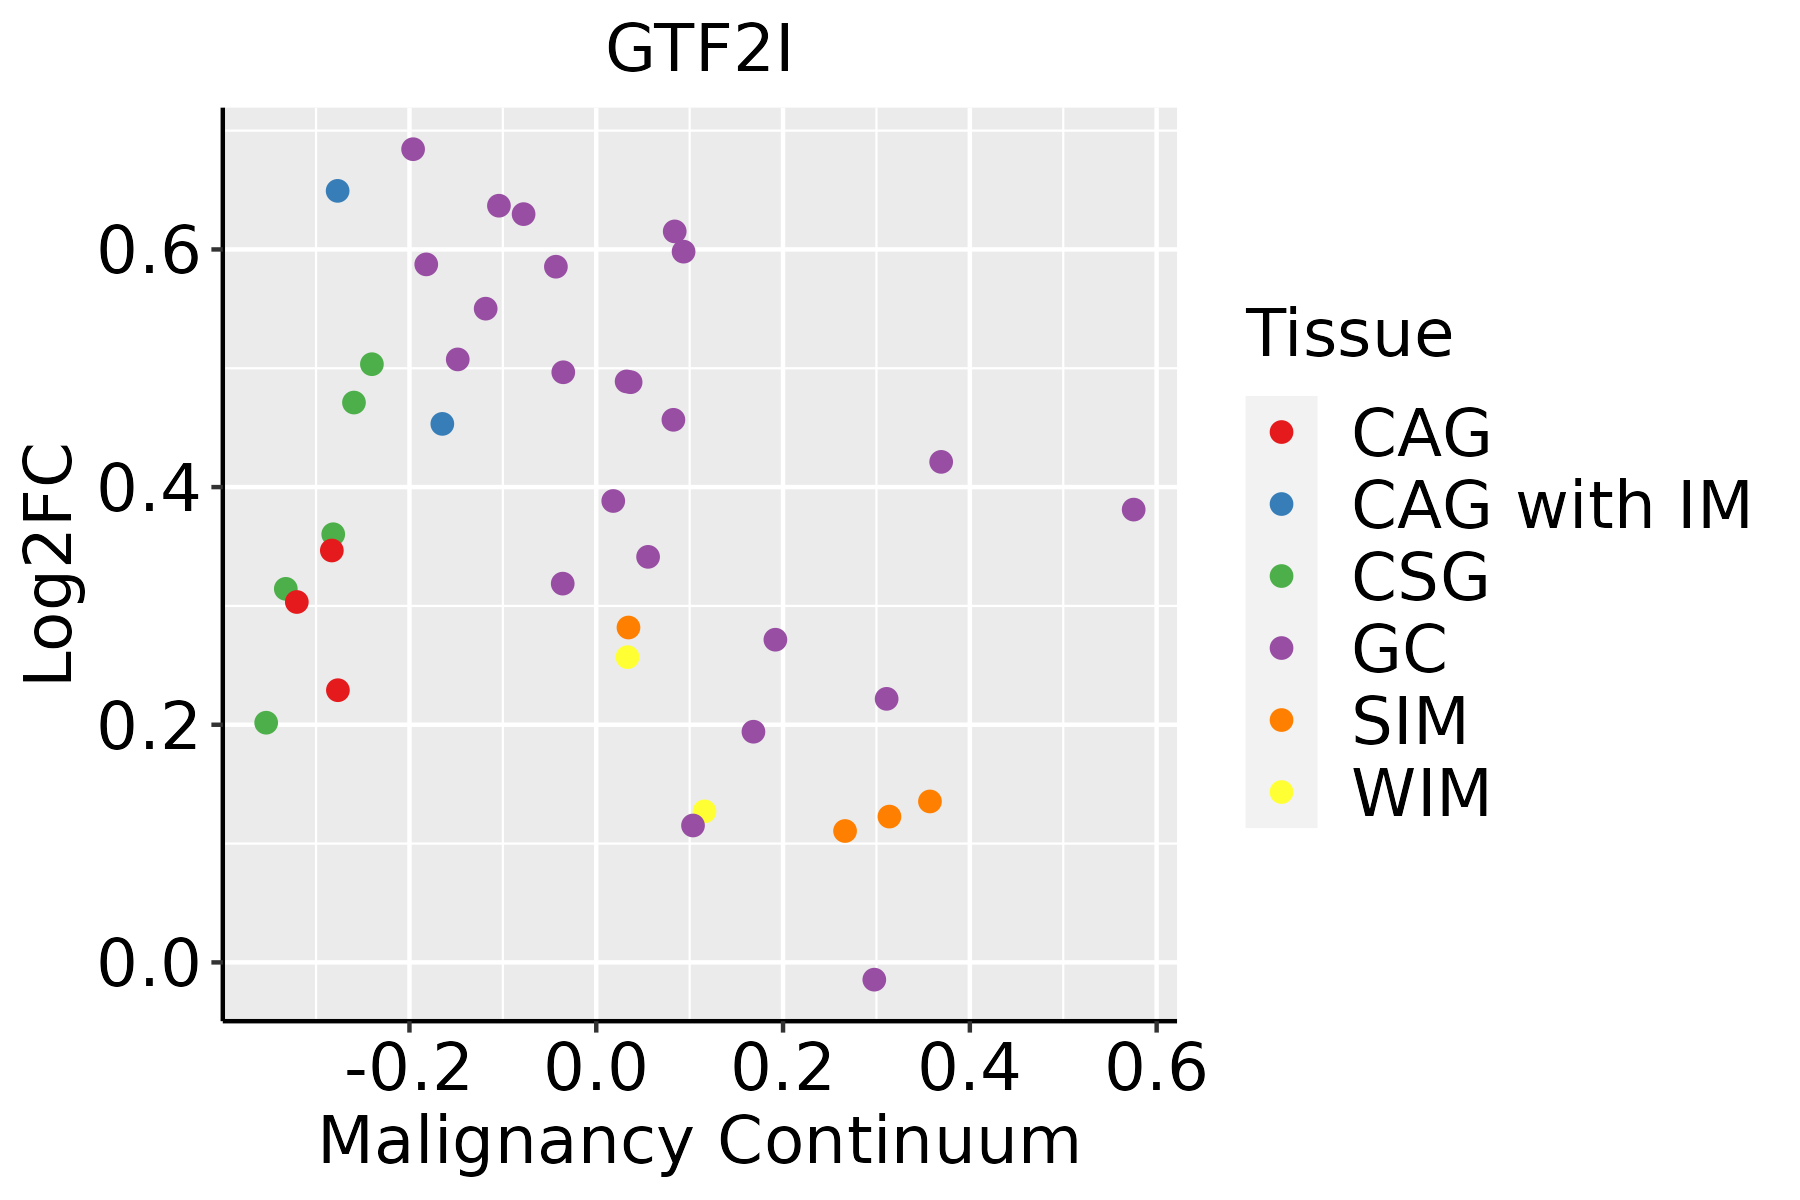 | CAG: Chronic atrophic gastritis |
| CAG with IM: Chronic atrophic gastritis with intestinal metaplasia |
| CSG: Chronic superficial gastritis |
| GC: Gastric cancer |
| SIM: Severe intestinal metaplasia |
| WIM: Wild intestinal metaplasia |
| Liver | 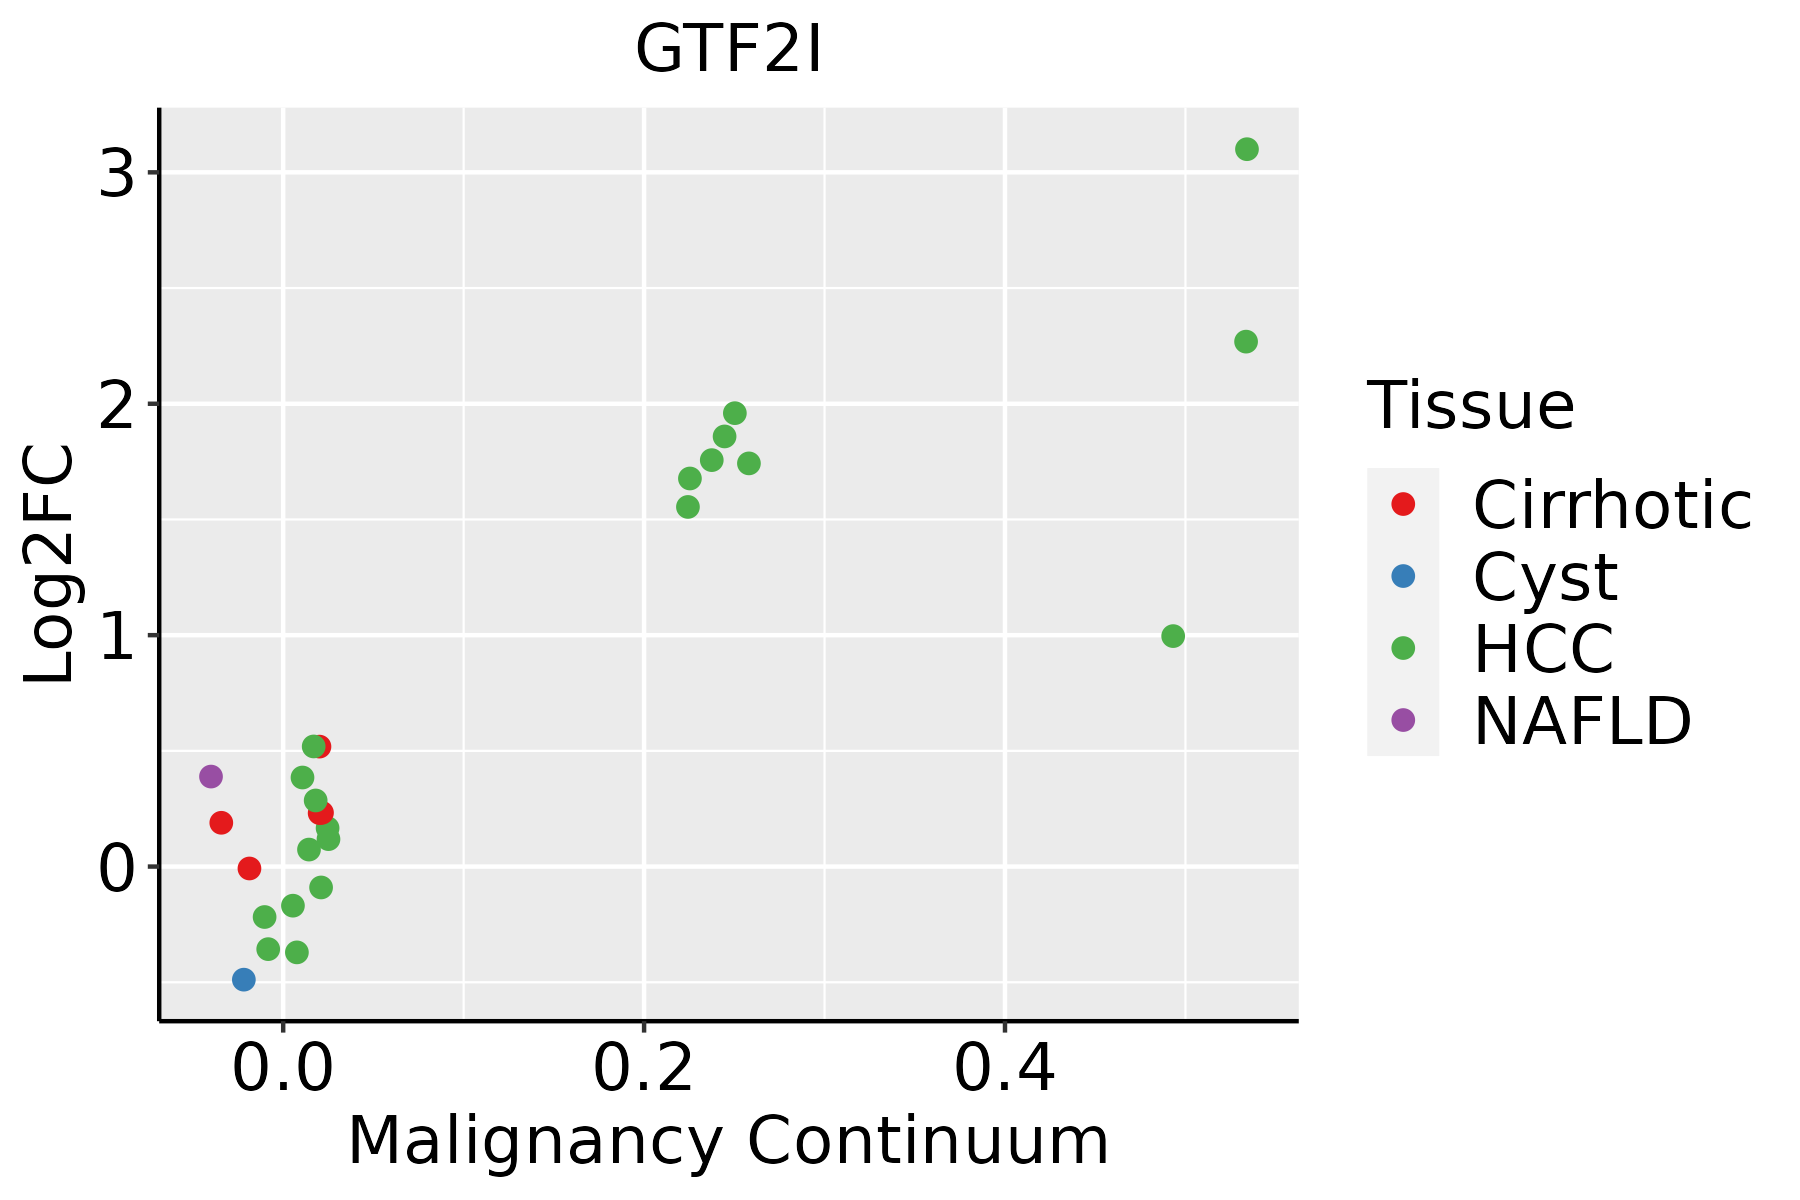 | HCC: Hepatocellular carcinoma |
| NAFLD: Non-alcoholic fatty liver disease |
| Lung | 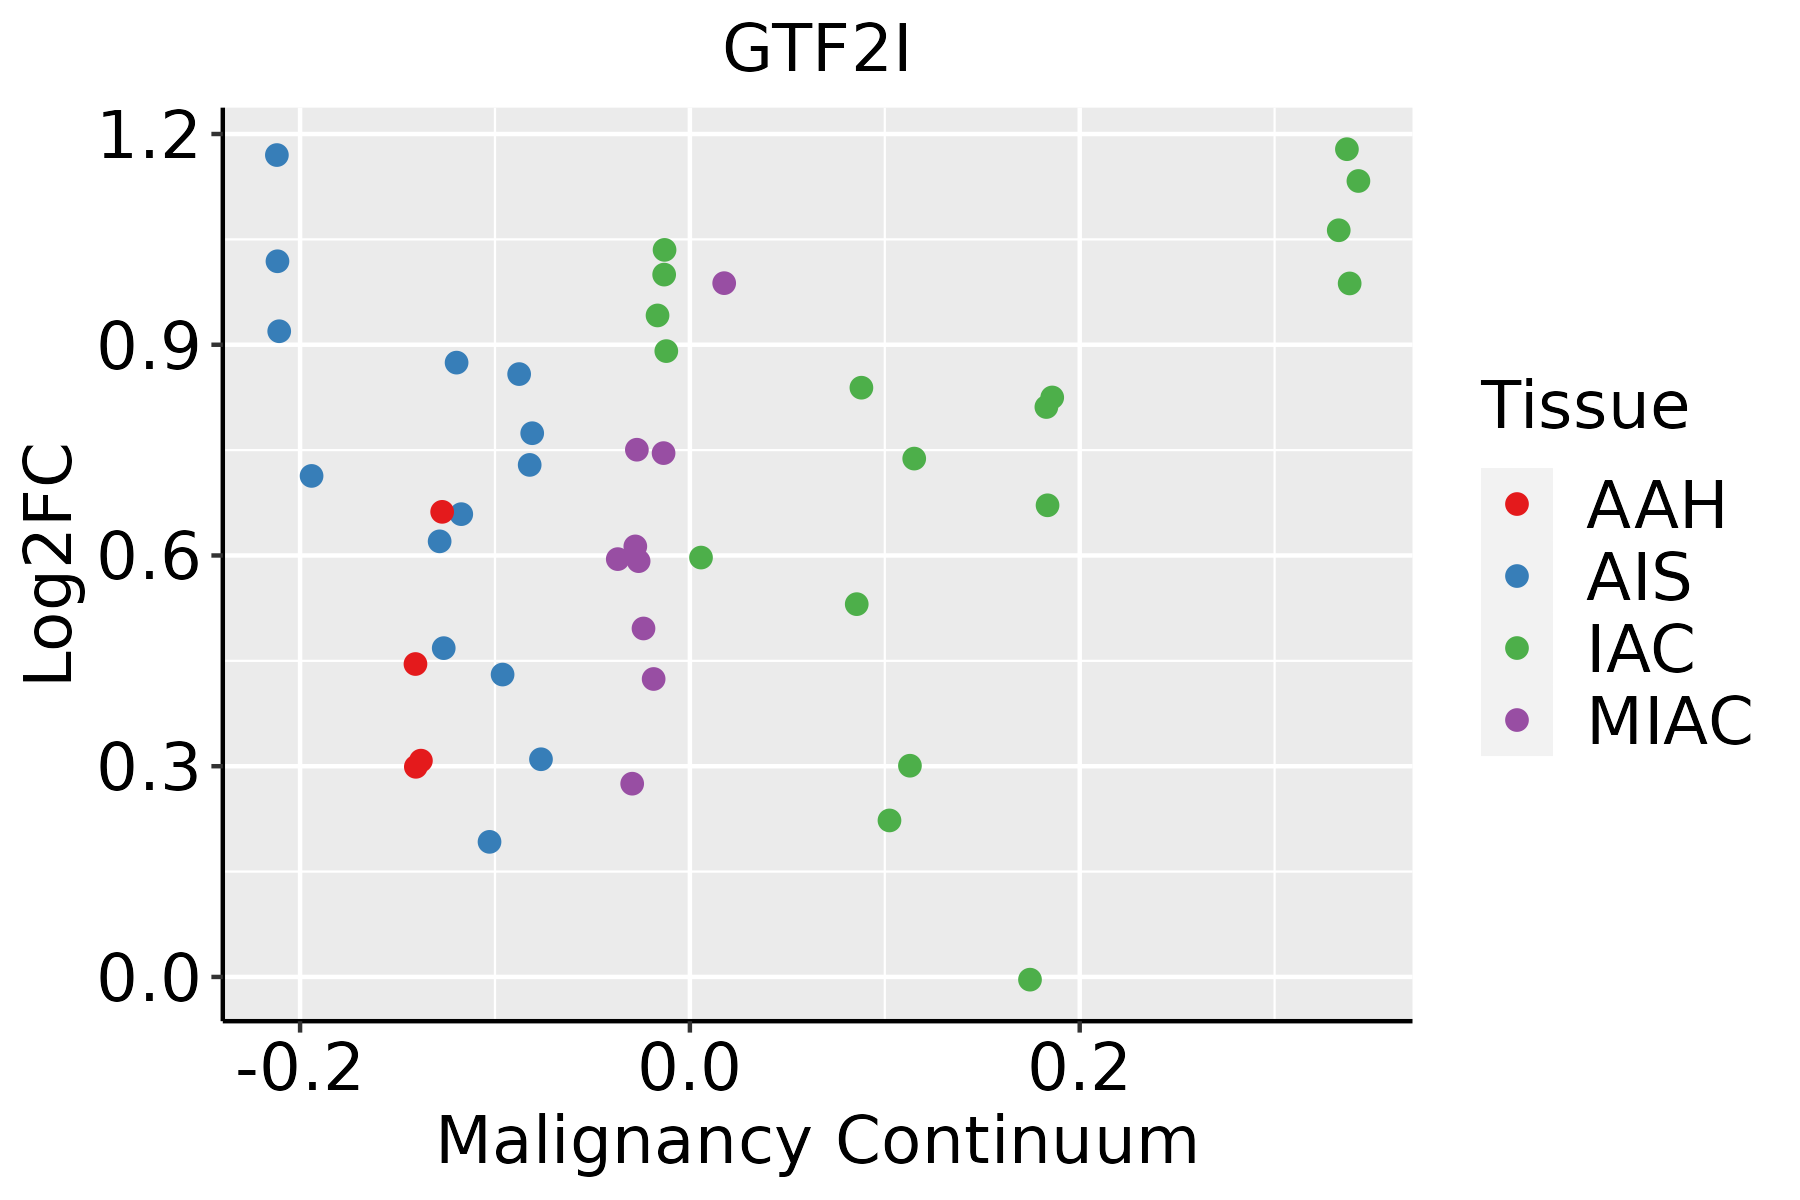 | AAH: Atypical adenomatous hyperplasia |
| AIS: Adenocarcinoma in situ |
| IAC: Invasive lung adenocarcinoma |
| MIA: Minimally invasive adenocarcinoma |
| Oral Cavity |  | EOLP: Erosive Oral lichen planus |
| LP: leukoplakia |
| NEOLP: Non-erosive oral lichen planus |
| OSCC: Oral squamous cell carcinoma |
| Prostate | 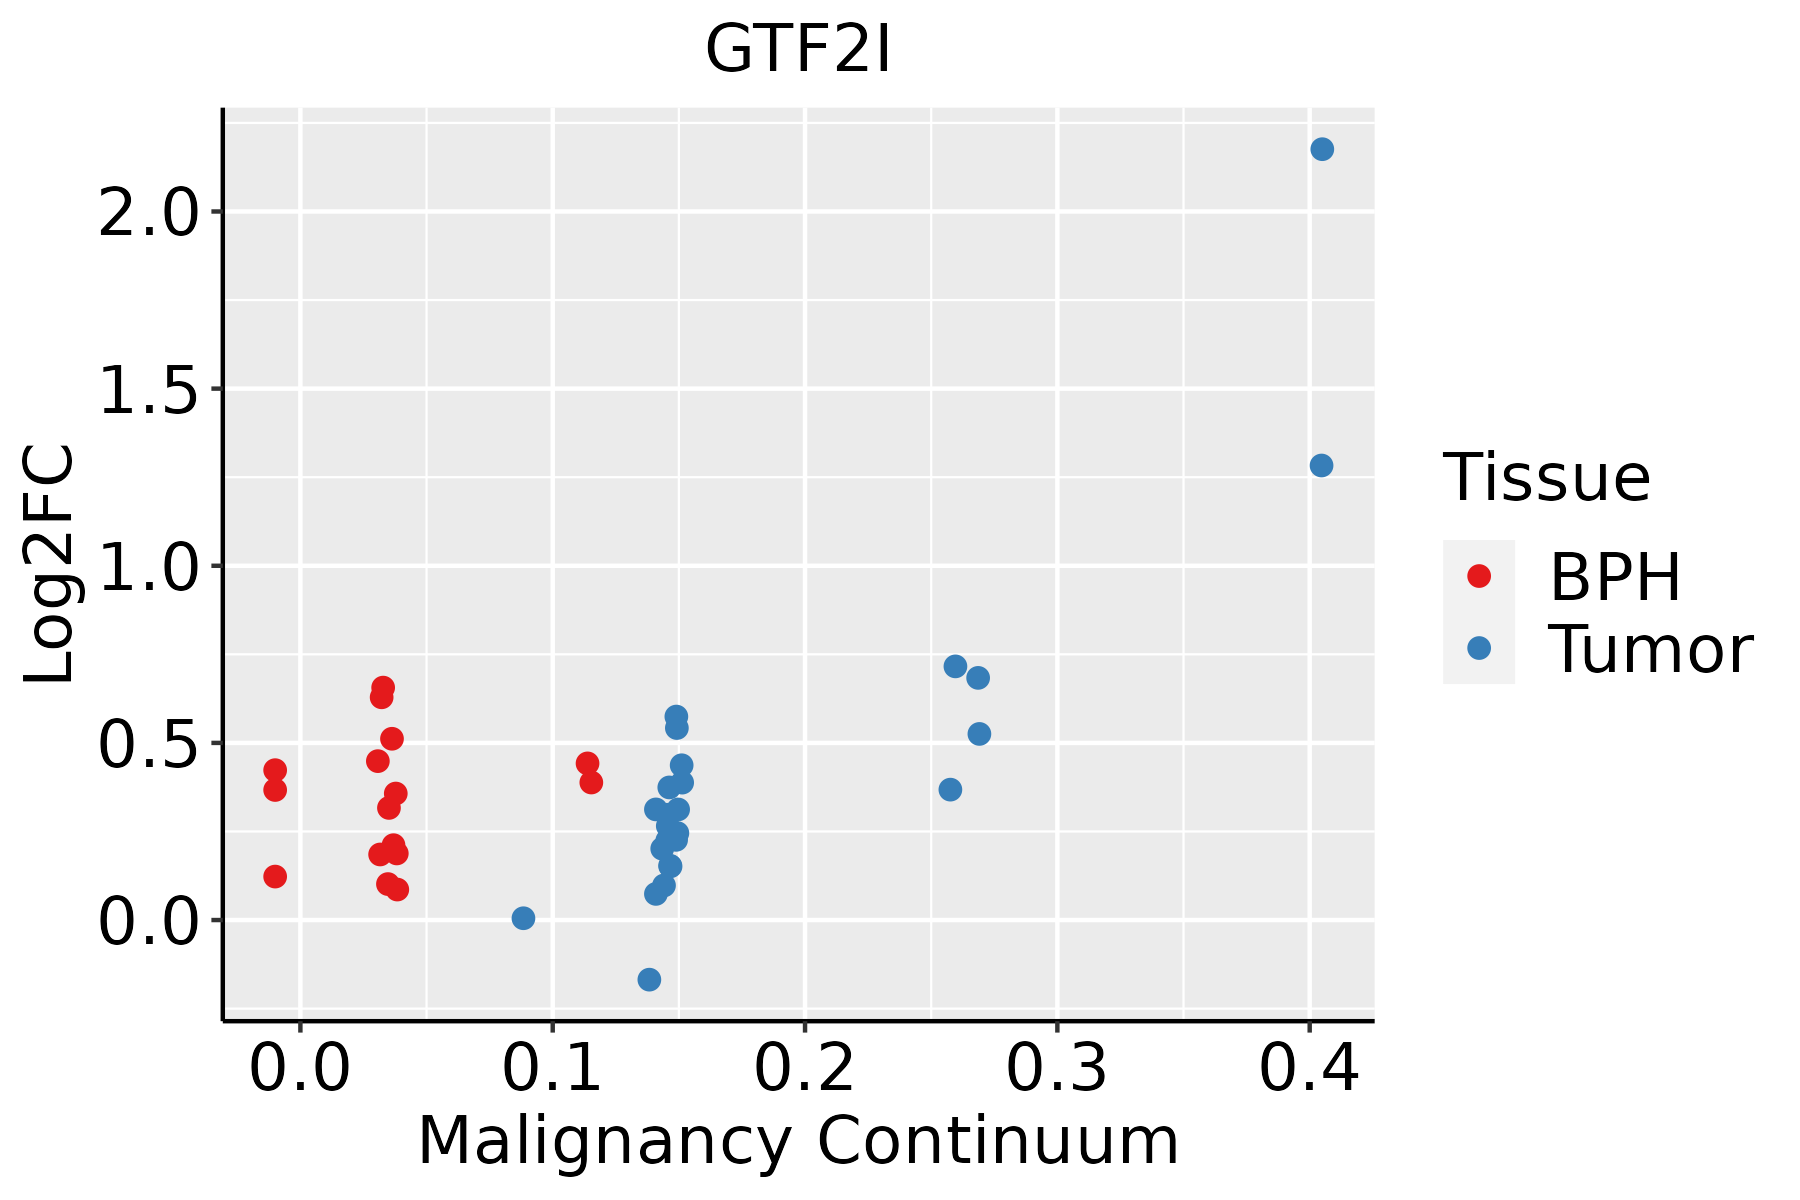 | BPH: Benign Prostatic Hyperplasia |
| Skin |  | AK: Actinic keratosis |
| cSCC: Cutaneous squamous cell carcinoma |
| SCCIS:squamous cell carcinoma in situ |
| Thyroid | 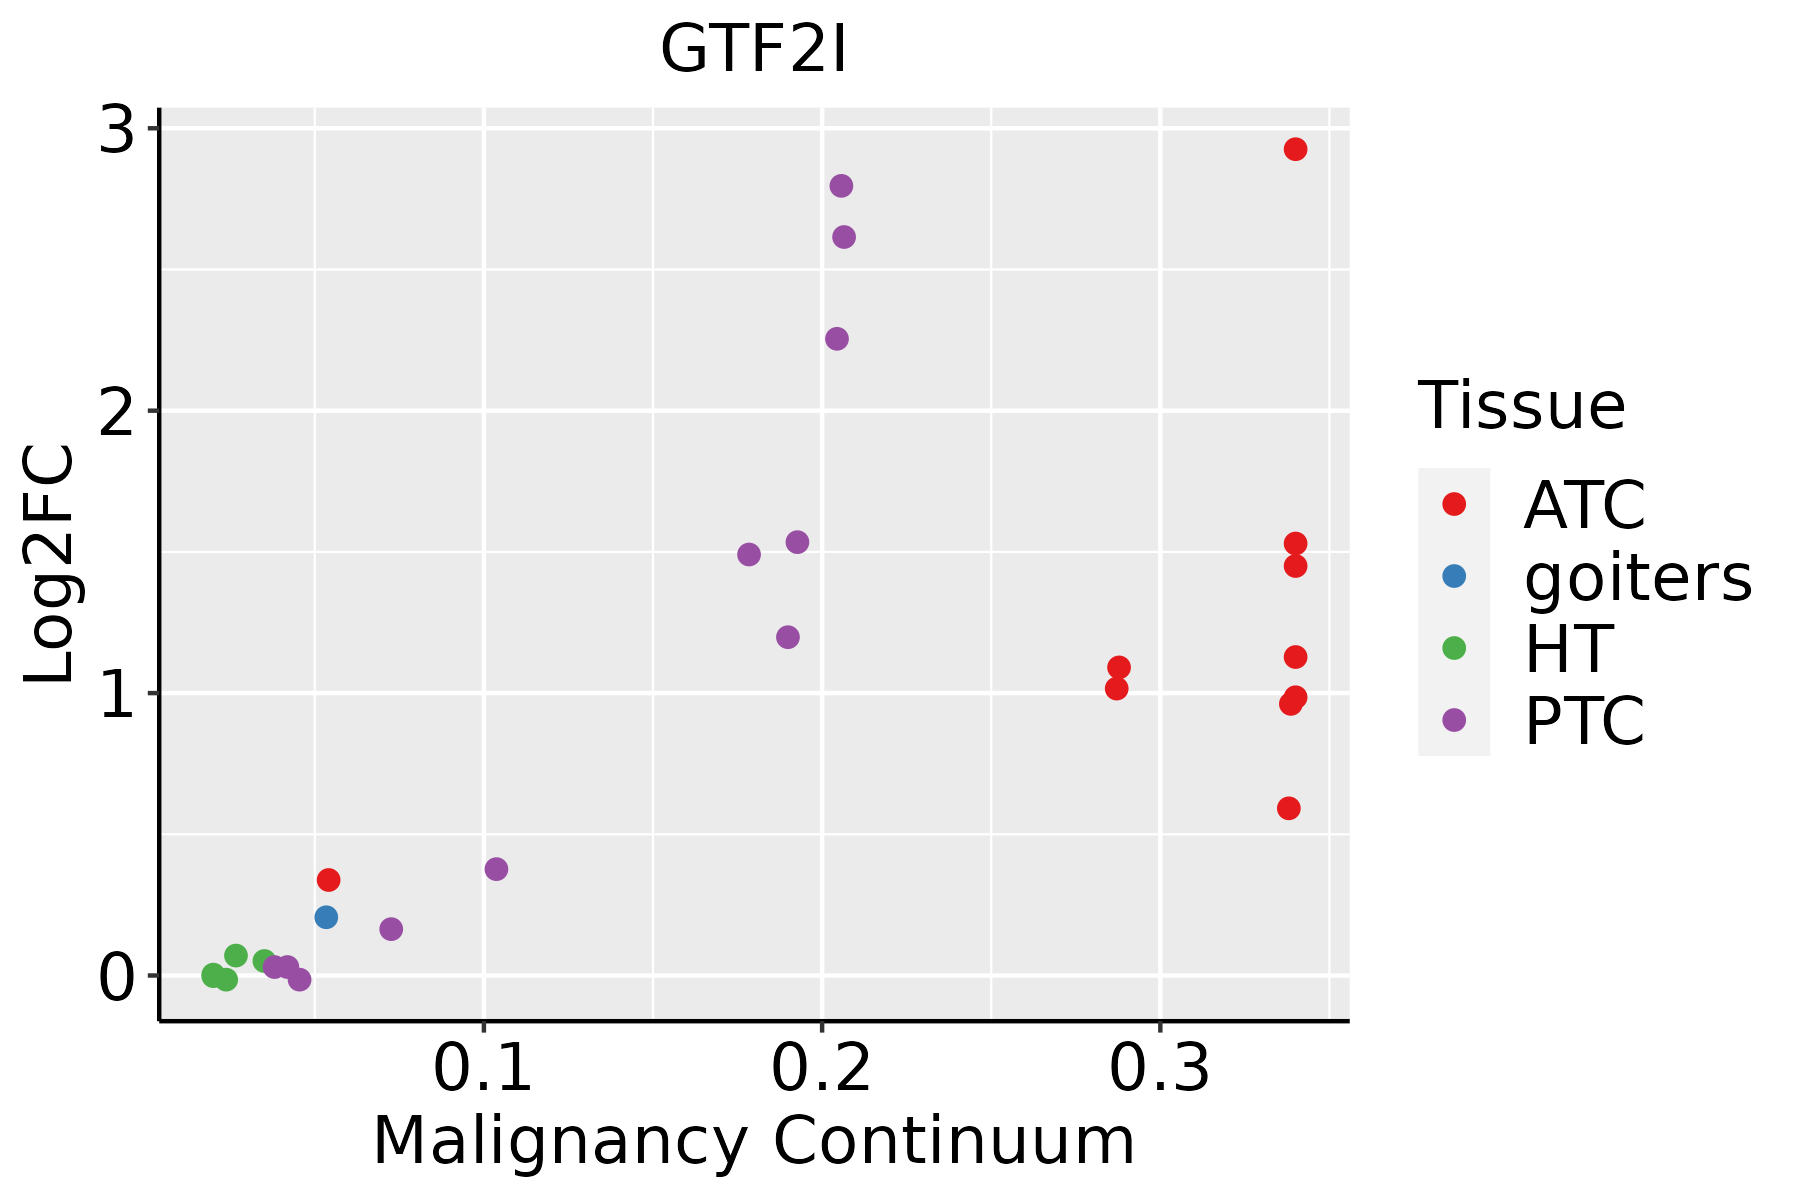 | ATC: Anaplastic thyroid cancer |
| HT: Hashimoto's thyroiditis |
| PTC: Papillary thyroid cancer |
| GO ID | Tissue | Disease Stage | Description | Gene Ratio | Bg Ratio | pvalue | p.adjust | Count |
| GO:19013423 | Cervix | CC | regulation of vasculature development | 60/2311 | 348/18723 | 4.48e-03 | 2.72e-02 | 60 |
| GO:00457653 | Cervix | CC | regulation of angiogenesis | 59/2311 | 342/18723 | 4.73e-03 | 2.83e-02 | 59 |
| GO:00902578 | Cervix | CC | regulation of muscle system process | 45/2311 | 252/18723 | 6.73e-03 | 3.70e-02 | 45 |
| GO:00435024 | Cervix | CC | regulation of muscle adaptation | 21/2311 | 98/18723 | 7.71e-03 | 4.09e-02 | 21 |
| GO:004576521 | Cervix | N_HPV | regulation of angiogenesis | 25/534 | 342/18723 | 1.80e-05 | 5.30e-04 | 25 |
| GO:190134221 | Cervix | N_HPV | regulation of vasculature development | 25/534 | 348/18723 | 2.41e-05 | 6.66e-04 | 25 |
| GO:00725031 | Cervix | N_HPV | cellular divalent inorganic cation homeostasis | 24/534 | 486/18723 | 6.76e-03 | 4.52e-02 | 24 |
| GO:0090257 | Colorectum | AD | regulation of muscle system process | 73/3918 | 252/18723 | 1.46e-03 | 1.24e-02 | 73 |
| GO:0043502 | Colorectum | AD | regulation of muscle adaptation | 31/3918 | 98/18723 | 8.45e-03 | 4.94e-02 | 31 |
| GO:00902572 | Colorectum | MSS | regulation of muscle system process | 66/3467 | 252/18723 | 1.55e-03 | 1.41e-02 | 66 |
| GO:00030121 | Colorectum | MSS | muscle system process | 105/3467 | 452/18723 | 6.39e-03 | 4.26e-02 | 105 |
| GO:00902574 | Colorectum | FAP | regulation of muscle system process | 58/2622 | 252/18723 | 7.22e-05 | 1.33e-03 | 58 |
| GO:00030122 | Colorectum | FAP | muscle system process | 89/2622 | 452/18723 | 4.63e-04 | 5.39e-03 | 89 |
| GO:00435022 | Colorectum | FAP | regulation of muscle adaptation | 26/2622 | 98/18723 | 7.75e-04 | 8.17e-03 | 26 |
| GO:00435001 | Colorectum | FAP | muscle adaptation | 28/2622 | 121/18723 | 4.50e-03 | 3.06e-02 | 28 |
| GO:00902575 | Colorectum | CRC | regulation of muscle system process | 51/2078 | 252/18723 | 1.49e-05 | 4.63e-04 | 51 |
| GO:00030123 | Colorectum | CRC | muscle system process | 74/2078 | 452/18723 | 3.92e-04 | 5.80e-03 | 74 |
| GO:00435023 | Colorectum | CRC | regulation of muscle adaptation | 21/2078 | 98/18723 | 2.22e-03 | 2.16e-02 | 21 |
| GO:00030126 | Endometrium | AEH | muscle system process | 78/2100 | 452/18723 | 6.89e-05 | 1.06e-03 | 78 |
| GO:00902579 | Endometrium | AEH | regulation of muscle system process | 44/2100 | 252/18723 | 1.92e-03 | 1.51e-02 | 44 |
| Pathway ID | Tissue | Disease Stage | Description | Gene Ratio | Bg Ratio | pvalue | p.adjust | qvalue | Count |
| hsa04022 | Colorectum | MSS | cGMP-PKG signaling pathway | 51/1875 | 167/8465 | 6.83e-03 | 2.73e-02 | 1.67e-02 | 51 |
| hsa040221 | Colorectum | MSS | cGMP-PKG signaling pathway | 51/1875 | 167/8465 | 6.83e-03 | 2.73e-02 | 1.67e-02 | 51 |
| hsa040222 | Colorectum | FAP | cGMP-PKG signaling pathway | 42/1404 | 167/8465 | 2.84e-03 | 1.27e-02 | 7.70e-03 | 42 |
| hsa040223 | Colorectum | FAP | cGMP-PKG signaling pathway | 42/1404 | 167/8465 | 2.84e-03 | 1.27e-02 | 7.70e-03 | 42 |
| hsa030222 | Esophagus | ESCC | Basal transcription factors | 35/4205 | 45/8465 | 1.01e-04 | 4.06e-04 | 2.08e-04 | 35 |
| hsa0302211 | Esophagus | ESCC | Basal transcription factors | 35/4205 | 45/8465 | 1.01e-04 | 4.06e-04 | 2.08e-04 | 35 |
| hsa03022 | Oral cavity | OSCC | Basal transcription factors | 28/3704 | 45/8465 | 9.53e-03 | 2.11e-02 | 1.08e-02 | 28 |
| hsa030221 | Oral cavity | OSCC | Basal transcription factors | 28/3704 | 45/8465 | 9.53e-03 | 2.11e-02 | 1.08e-02 | 28 |
| hsa040224 | Oral cavity | EOLP | cGMP-PKG signaling pathway | 36/1218 | 167/8465 | 7.34e-03 | 2.12e-02 | 1.25e-02 | 36 |
| hsa0402211 | Oral cavity | EOLP | cGMP-PKG signaling pathway | 36/1218 | 167/8465 | 7.34e-03 | 2.12e-02 | 1.25e-02 | 36 |
| TF | Cell Type | Tissue | Disease Stage | Target Gene | RSS | Regulon Activity |
| GTF2I | CD8TEXP | Liver | HCC | HOPX,TMEM127,TRIM28, etc. | 4.34e-03 |  |
| GTF2I | CD8TEFF | Liver | HCC | HOPX,TMEM127,TRIM28, etc. | 9.04e-03 | |
| GTF2I | CD8TEXINT | Liver | Healthy | HOPX,TMEM127,TRIM28, etc. | 0.00e+00 |  |
| GTF2I | CD4TN | Liver | Healthy | HOPX,TMEM127,TRIM28, etc. | 0.00e+00 | |
| GTF2I | TREG | Liver | Healthy | HOPX,TMEM127,TRIM28, etc. | -2.22e-16 | |
| GTF2I | BMEM | Liver | NAFLD | HOPX,TMEM127,TRIM28, etc. | 0.00e+00 |  |
| GTF2I | M1MAC | Lung | AIS | BRWD3,ZCCHC17,PHLDA2, etc. | 4.17e-02 |  |
| GTF2I | M2MAC | Lung | AIS | BRWD3,ZCCHC17,PHLDA2, etc. | 6.11e-02 | |
| GTF2I | NEUT | Lung | AIS | BRWD3,ZCCHC17,PHLDA2, etc. | 1.01e-02 | |
| Hugo Symbol | Variant Class | Variant Classification | dbSNP RS | HGVSc | HGVSp | HGVSp Short | SWISSPROT | BIOTYPE | SIFT | PolyPhen | Tumor Sample Barcode | Tissue | Histology | Sex | Age | Stage | Therapy Types | Drugs | Outcome |
| GTF2I | SNV | Missense_Mutation | novel | c.127G>A | p.Glu43Lys | p.E43K | P78347 | protein_coding | deleterious(0) | probably_damaging(0.955) | TCGA-A8-A07U-01 | Breast | breast invasive carcinoma | Female | >=65 | III/IV | Chemotherapy | 5-fluorouracil | SD |
| GTF2I | SNV | Missense_Mutation | novel | c.403C>A | p.Pro135Thr | p.P135T | P78347 | protein_coding | deleterious(0) | probably_damaging(0.999) | TCGA-A8-A08R-01 | Breast | breast invasive carcinoma | Female | <65 | I/II | Unknown | Unknown | SD |
| GTF2I | SNV | Missense_Mutation | novel | c.2795C>G | p.Ser932Cys | p.S932C | P78347 | protein_coding | deleterious(0) | probably_damaging(0.999) | TCGA-D8-A1JH-01 | Breast | breast invasive carcinoma | Female | <65 | I/II | Hormone Therapy | nolvadex | SD |
| GTF2I | SNV | Missense_Mutation | novel | c.161T>C | p.Val54Ala | p.V54A | P78347 | protein_coding | deleterious(0.01) | probably_damaging(0.93) | TCGA-D8-A1XK-01 | Breast | breast invasive carcinoma | Female | <65 | I/II | Chemotherapy | doxorubicine+cyclophosphamide | SD |
| GTF2I | SNV | Missense_Mutation | novel | c.1351N>T | p.Pro451Ser | p.P451S | P78347 | protein_coding | tolerated(0.16) | probably_damaging(0.986) | TCGA-E2-A15H-01 | Breast | breast invasive carcinoma | Female | <65 | I/II | Chemotherapy | herceptin | SD |
| GTF2I | SNV | Missense_Mutation | rs782059244 | c.1288N>T | p.Arg430Cys | p.R430C | P78347 | protein_coding | deleterious(0) | probably_damaging(0.999) | TCGA-E2-A576-01 | Breast | breast invasive carcinoma | Female | >=65 | I/II | Chemotherapy | taxotere | SD |
| GTF2I | SNV | Missense_Mutation | novel | c.824N>A | p.Gly275Glu | p.G275E | P78347 | protein_coding | tolerated(0.17) | benign(0.015) | TCGA-C5-A1MP-01 | Cervix | cervical & endocervical cancer | Female | <65 | I/II | Unknown | Unknown | SD |
| GTF2I | SNV | Missense_Mutation | novel | c.88C>G | p.Leu30Val | p.L30V | P78347 | protein_coding | tolerated(0.07) | probably_damaging(0.978) | TCGA-DS-A1OB-01 | Cervix | cervical & endocervical cancer | Female | <65 | I/II | Chemotherapy | carboplatin | PD |
| GTF2I | SNV | Missense_Mutation | novel | c.1743G>C | p.Leu581Phe | p.L581F | P78347 | protein_coding | tolerated(0.44) | possibly_damaging(0.681) | TCGA-Q1-A73O-01 | Cervix | cervical & endocervical cancer | Female | <65 | I/II | Chemotherapy | cisplatin | CR |
| GTF2I | SNV | Missense_Mutation | novel | c.525N>C | p.Glu175Asp | p.E175D | P78347 | protein_coding | tolerated(0.11) | probably_damaging(0.996) | TCGA-VS-A8EL-01 | Cervix | cervical & endocervical cancer | Female | <65 | I/II | Chemotherapy | cisplatin | CR |


