
|
|||||
|
 | |
| |
| |
| |
| |
| |
|
Gene: GATAD2A |
Gene summary for GATAD2A |
| Gene information | Species | Human | Gene symbol | GATAD2A | Gene ID | 54815 |
| Gene name | GATA zinc finger domain containing 2A | |
| Gene Alias | p66alpha | |
| Cytomap | 19p13.11 | |
| Gene Type | protein-coding | GO ID | GO:0000122 | UniProtAcc | A0A024R7M6 |
Top |
Malignant transformation analysis |
| Identification of the aberrant gene expression in precancerous and cancerous lesions by comparing the gene expression of stem-like cells in diseased tissues with normal stem cells |
| Entrez ID | Symbol | Replicates | Species | Organ | Tissue | Adj P-value | Log2FC | Malignancy |
| 54815 | GATAD2A | P126T-E | Human | Esophagus | ESCC | 1.73e-09 | 4.41e-01 | 0.1125 |
| 54815 | GATAD2A | P127T-E | Human | Esophagus | ESCC | 1.97e-12 | 7.16e-02 | 0.0826 |
| 54815 | GATAD2A | P128T-E | Human | Esophagus | ESCC | 1.16e-23 | 6.03e-01 | 0.1241 |
| 54815 | GATAD2A | P130T-E | Human | Esophagus | ESCC | 5.90e-37 | 7.84e-01 | 0.1676 |
| 54815 | GATAD2A | NAFLD1 | Human | Liver | NAFLD | 1.38e-02 | 4.55e-01 | -0.04 |
| 54815 | GATAD2A | S43 | Human | Liver | Cirrhotic | 4.45e-03 | -4.27e-02 | -0.0187 |
| 54815 | GATAD2A | HCC1_Meng | Human | Liver | HCC | 4.51e-49 | 2.78e-02 | 0.0246 |
| 54815 | GATAD2A | HCC2_Meng | Human | Liver | HCC | 6.91e-18 | 9.75e-02 | 0.0107 |
| 54815 | GATAD2A | HCC2 | Human | Liver | HCC | 2.83e-04 | 3.09e+00 | 0.5341 |
| 54815 | GATAD2A | Pt14.a | Human | Liver | HCC | 1.05e-02 | 2.47e-01 | 0.0169 |
| 54815 | GATAD2A | S014 | Human | Liver | HCC | 7.54e-10 | 5.63e-01 | 0.2254 |
| 54815 | GATAD2A | S015 | Human | Liver | HCC | 9.79e-11 | 6.69e-01 | 0.2375 |
| 54815 | GATAD2A | S016 | Human | Liver | HCC | 3.01e-18 | 6.64e-01 | 0.2243 |
| 54815 | GATAD2A | S027 | Human | Liver | HCC | 4.44e-04 | 6.84e-01 | 0.2446 |
| 54815 | GATAD2A | S028 | Human | Liver | HCC | 1.35e-14 | 7.75e-01 | 0.2503 |
| 54815 | GATAD2A | S029 | Human | Liver | HCC | 8.44e-08 | 5.28e-01 | 0.2581 |
| 54815 | GATAD2A | C04 | Human | Oral cavity | OSCC | 1.70e-16 | 9.20e-01 | 0.2633 |
| 54815 | GATAD2A | C21 | Human | Oral cavity | OSCC | 4.69e-07 | 3.09e-01 | 0.2678 |
| 54815 | GATAD2A | C30 | Human | Oral cavity | OSCC | 4.16e-30 | 1.35e+00 | 0.3055 |
| 54815 | GATAD2A | C43 | Human | Oral cavity | OSCC | 6.99e-03 | 1.41e-01 | 0.1704 |
| Page: 1 2 3 4 5 6 7 8 9 |
| Tissue | Expression Dynamics | Abbreviation |
| Cervix |  | CC: Cervix cancer |
| HSIL_HPV: HPV-infected high-grade squamous intraepithelial lesions | ||
| N_HPV: HPV-infected normal cervix | ||
| Colorectum (GSE201348) |  | FAP: Familial adenomatous polyposis |
| CRC: Colorectal cancer | ||
| Colorectum (HTA11) |  | AD: Adenomas |
| SER: Sessile serrated lesions | ||
| MSI-H: Microsatellite-high colorectal cancer | ||
| MSS: Microsatellite stable colorectal cancer | ||
| Endometrium | 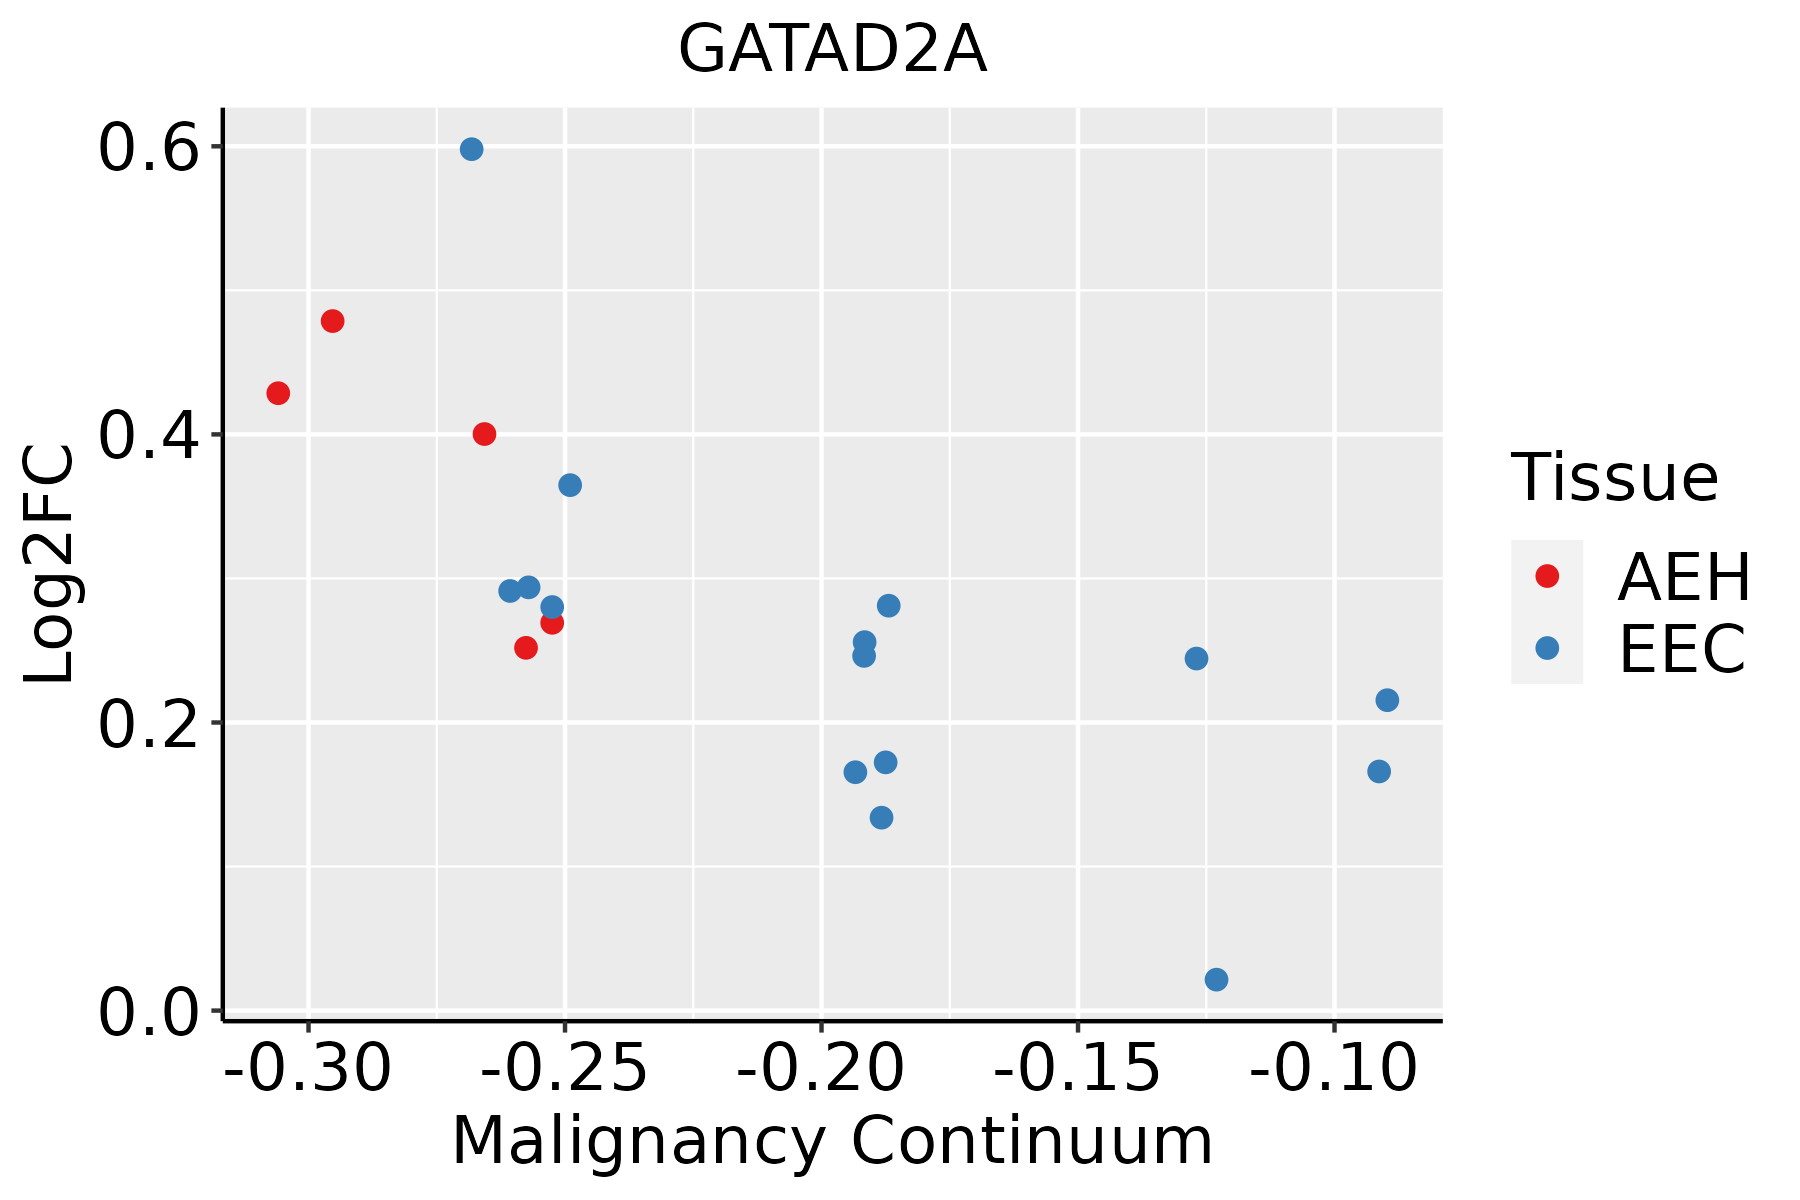 | AEH: Atypical endometrial hyperplasia |
| EEC: Endometrioid Cancer | ||
| Esophagus |  | ESCC: Esophageal squamous cell carcinoma |
| HGIN: High-grade intraepithelial neoplasias | ||
| LGIN: Low-grade intraepithelial neoplasias | ||
| Liver | 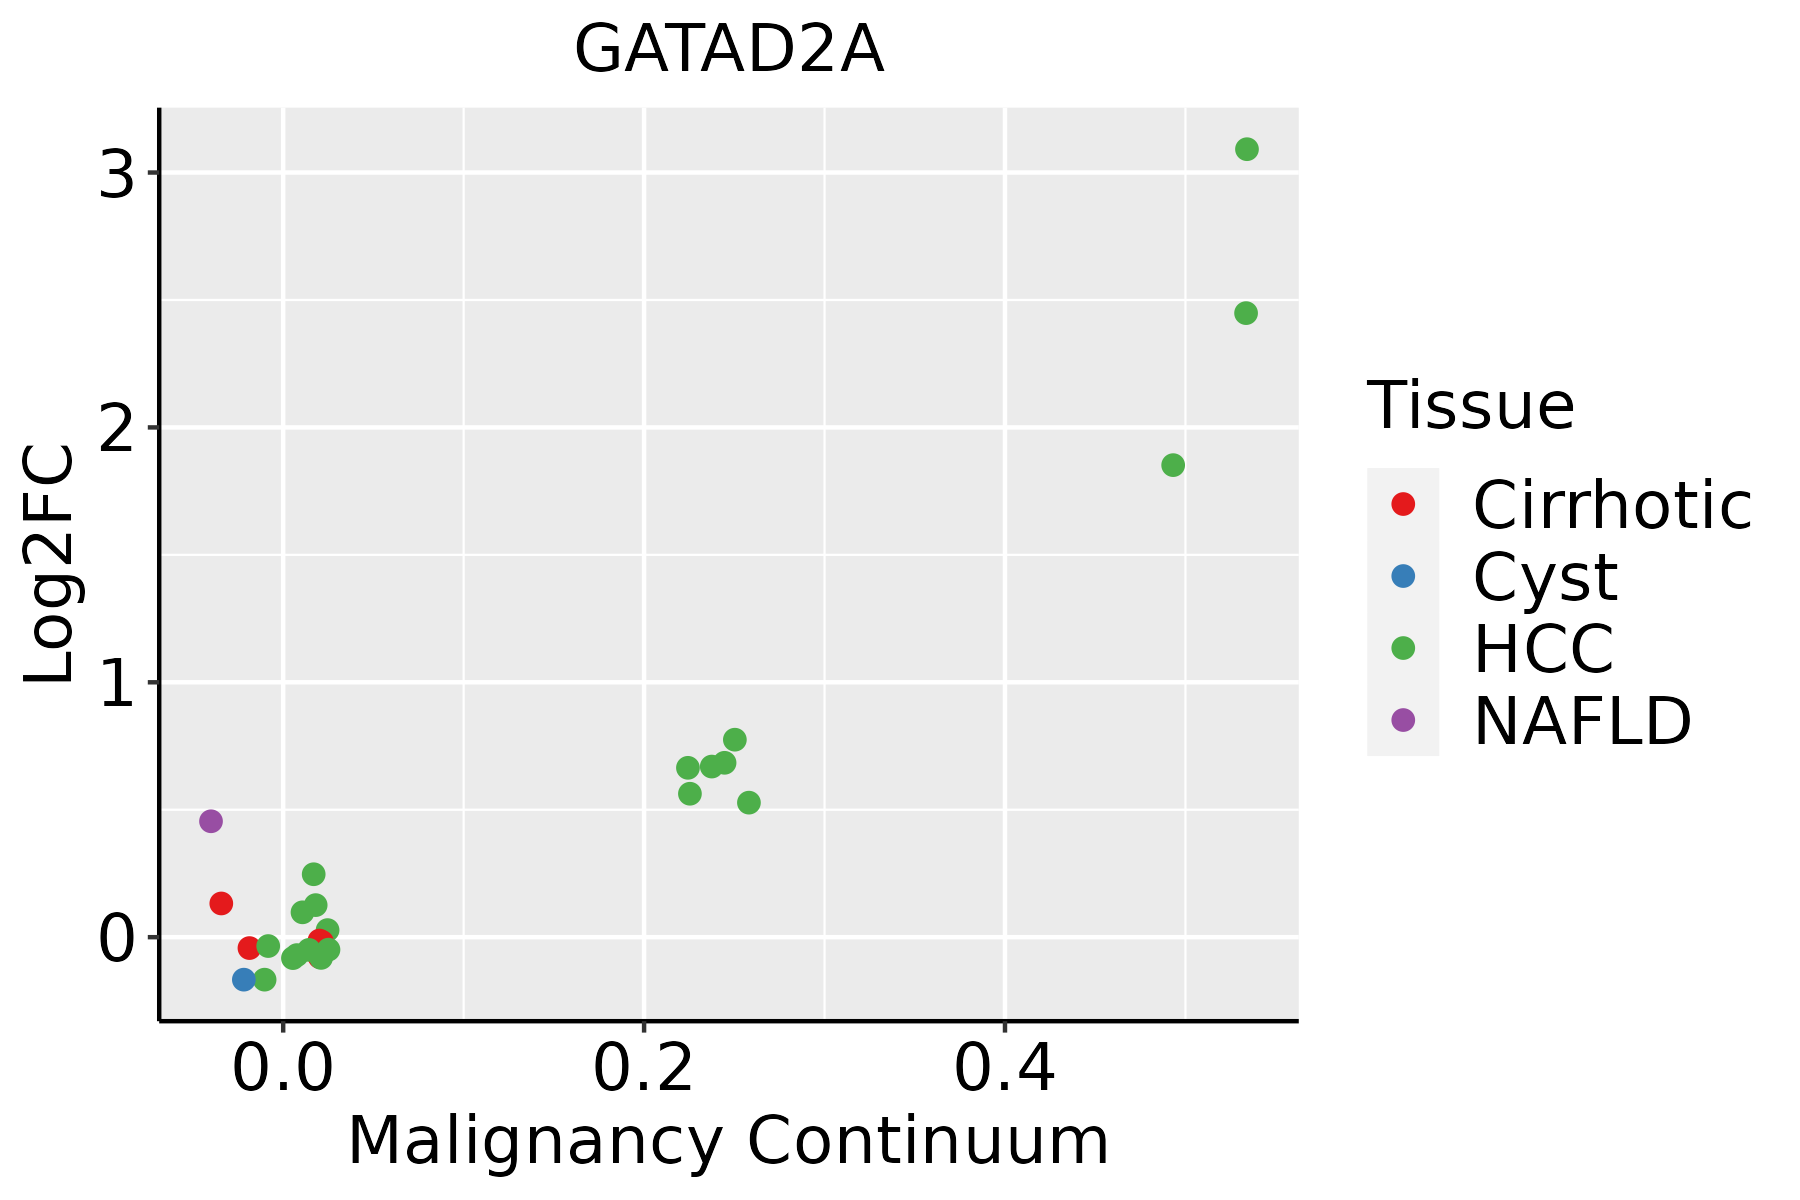 | HCC: Hepatocellular carcinoma |
| NAFLD: Non-alcoholic fatty liver disease | ||
| Oral Cavity | 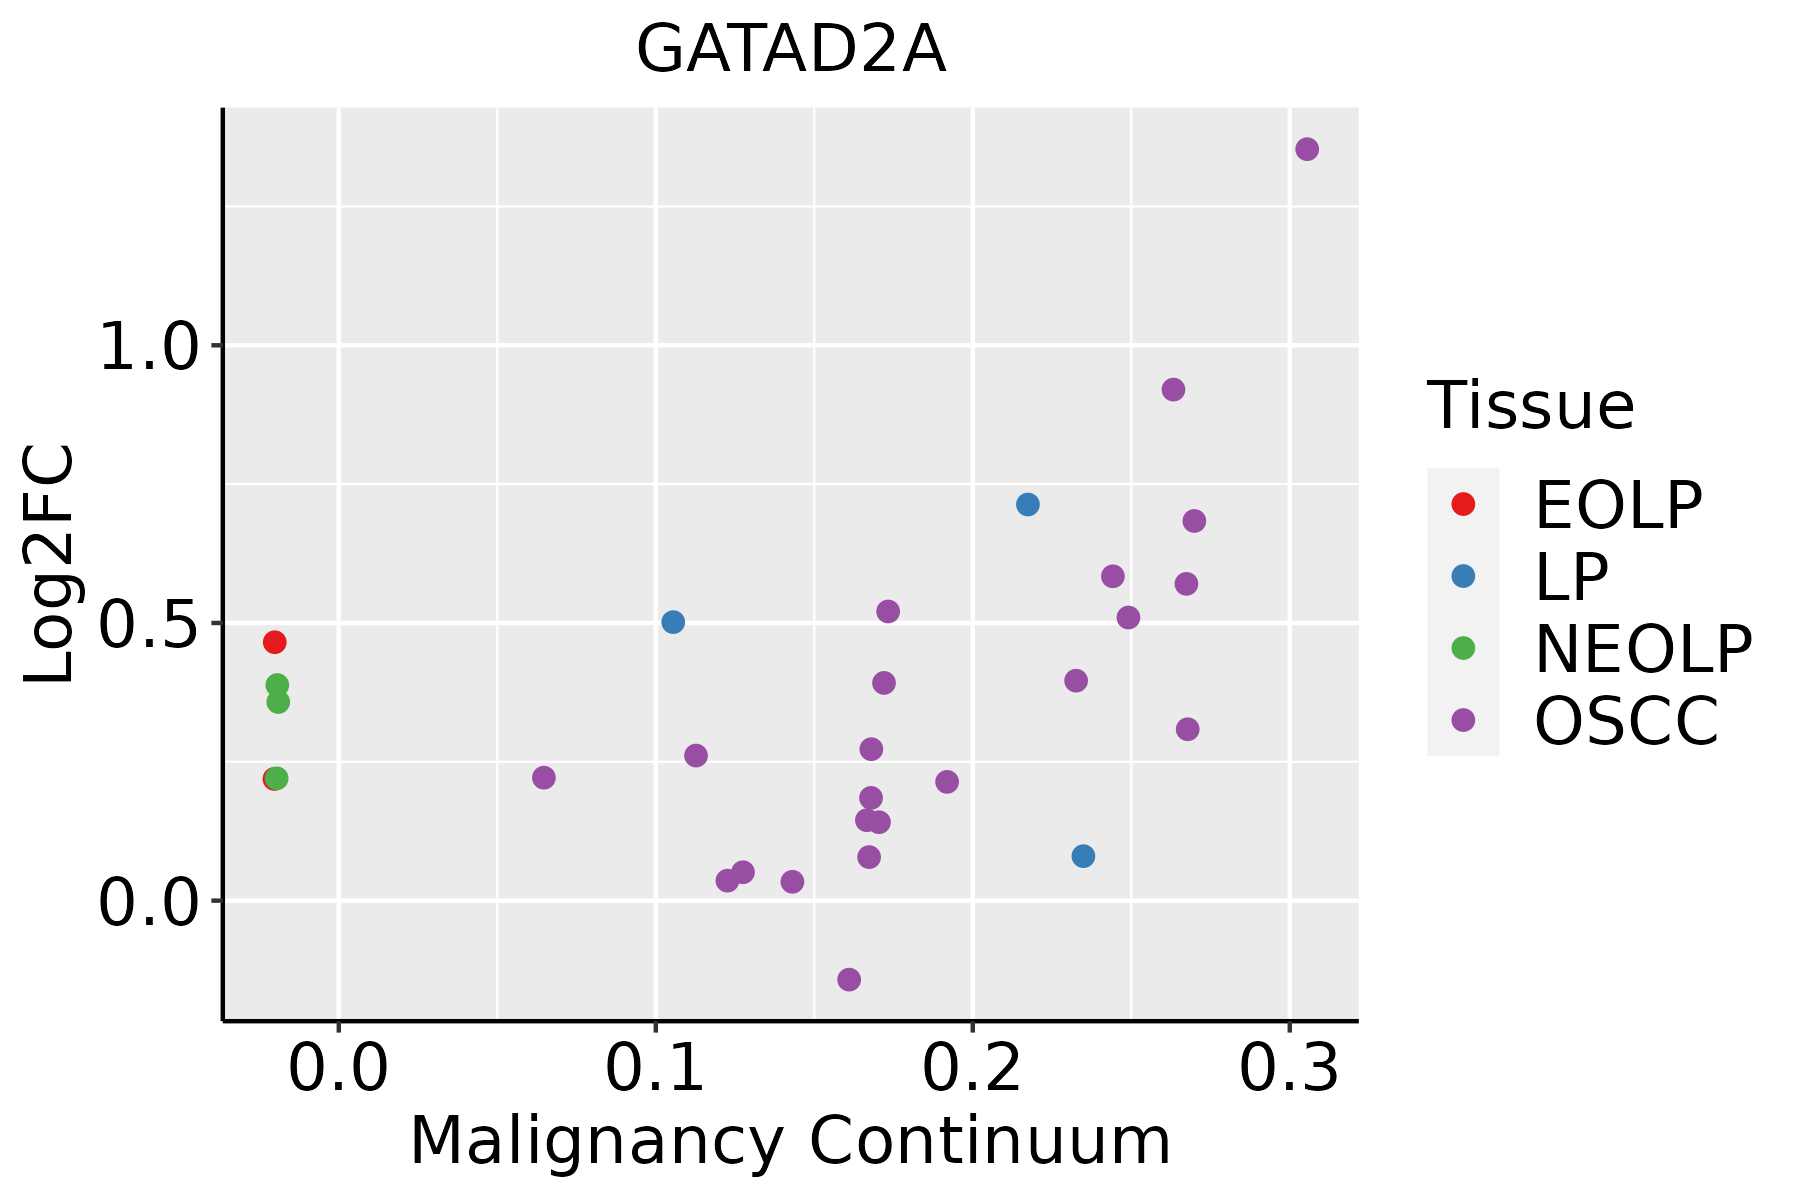 | EOLP: Erosive Oral lichen planus |
| LP: leukoplakia | ||
| NEOLP: Non-erosive oral lichen planus | ||
| OSCC: Oral squamous cell carcinoma | ||
| Prostate |  | BPH: Benign Prostatic Hyperplasia |
| Skin | 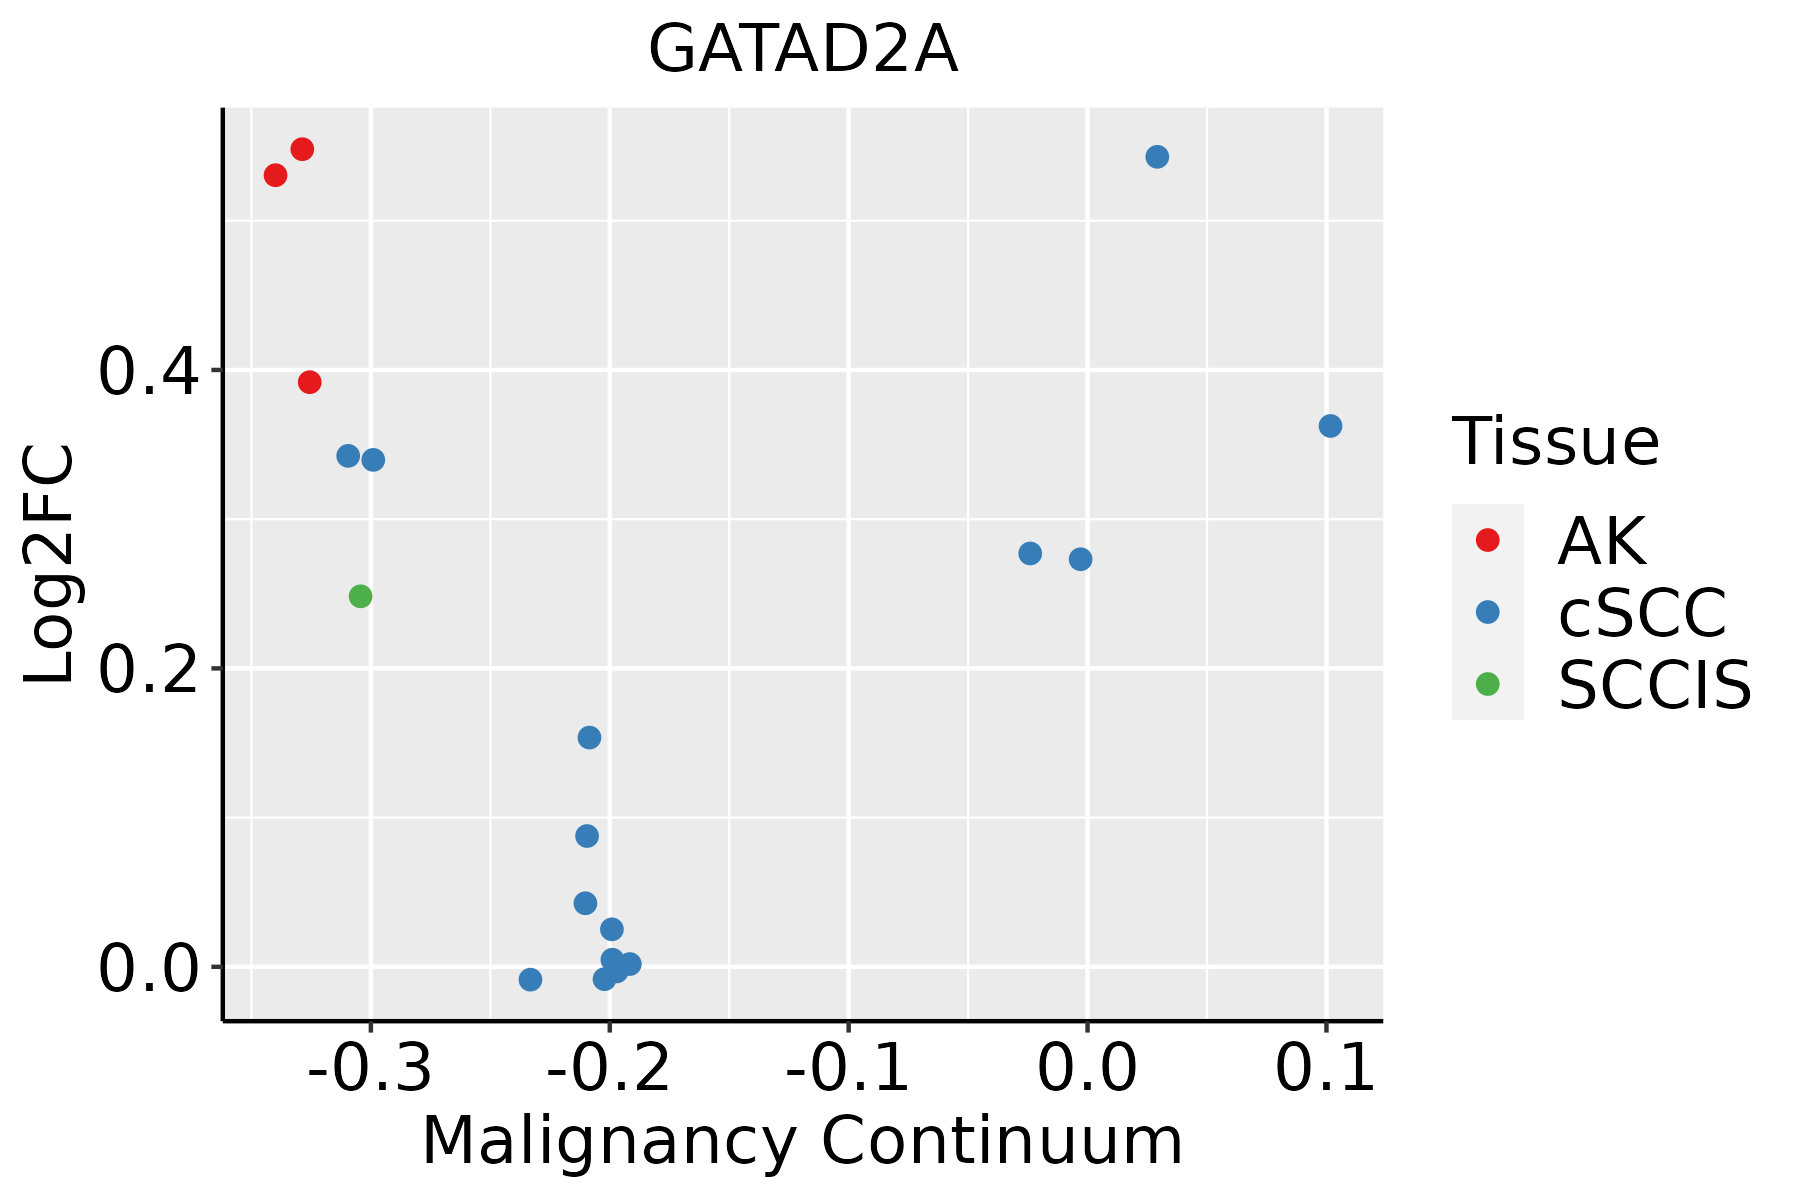 | AK: Actinic keratosis |
| cSCC: Cutaneous squamous cell carcinoma | ||
| SCCIS:squamous cell carcinoma in situ | ||
| Thyroid |  | ATC: Anaplastic thyroid cancer |
| HT: Hashimoto's thyroiditis | ||
| PTC: Papillary thyroid cancer |
| ∗log2FC in expression of this searched gene in stem-like cells from each diseased tissue sample relative to stem-like cells in normal samples in each tissue plotted against the malignancy continuum. Samples are colored based on if they are from different disease stage. |
Top |
Malignant transformation related pathway analysis |
| Find out the enriched GO biological processes and KEGG pathways involved in transition from healthy to precancer to cancer |
| Tissue | Disease Stage | Enriched GO biological Processes |
| Colorectum | AD |  |
| Colorectum | SER |  |
| Colorectum | MSS |  |
| Colorectum | MSI-H |  |
| Colorectum | FAP |  |
| ∗Top 15 enriched GO BP terms are showed in the bar plot of each disease state in each tissue. Each row represents a significant GO biological process which is colored according to the -log10(p.adjust). |
| Page: 1 2 3 4 5 6 7 8 9 |
| GO ID | Tissue | Disease Stage | Description | Gene Ratio | Bg Ratio | pvalue | p.adjust | Count |
| GO:00434143 | Esophagus | ESCC | macromolecule methylation | 199/8552 | 316/18723 | 3.44e-10 | 9.57e-09 | 199 |
| GO:00322592 | Esophagus | ESCC | methylation | 222/8552 | 364/18723 | 2.26e-09 | 5.09e-08 | 222 |
| GO:0006304 | Esophagus | ESCC | DNA modification | 68/8552 | 120/18723 | 9.95e-03 | 3.42e-02 | 68 |
| GO:0043414 | Liver | NAFLD | macromolecule methylation | 47/1882 | 316/18723 | 4.08e-03 | 3.41e-02 | 47 |
| GO:00434141 | Liver | HCC | macromolecule methylation | 183/7958 | 316/18723 | 2.00e-08 | 4.72e-07 | 183 |
| GO:0032259 | Liver | HCC | methylation | 206/7958 | 364/18723 | 3.35e-08 | 7.53e-07 | 206 |
| GO:00434142 | Oral cavity | OSCC | macromolecule methylation | 149/7305 | 316/18723 | 1.82e-03 | 8.60e-03 | 149 |
| GO:00322591 | Oral cavity | OSCC | methylation | 168/7305 | 364/18723 | 3.03e-03 | 1.31e-02 | 168 |
| GO:00434144 | Skin | AK | macromolecule methylation | 48/1910 | 316/18723 | 3.28e-03 | 2.01e-02 | 48 |
| GO:004341411 | Skin | cSCC | macromolecule methylation | 107/4864 | 316/18723 | 1.03e-03 | 6.94e-03 | 107 |
| GO:00322593 | Skin | cSCC | methylation | 120/4864 | 364/18723 | 1.61e-03 | 9.93e-03 | 120 |
| GO:00322594 | Thyroid | PTC | methylation | 146/5968 | 364/18723 | 4.99e-04 | 3.26e-03 | 146 |
| GO:00434145 | Thyroid | PTC | macromolecule methylation | 127/5968 | 316/18723 | 1.02e-03 | 6.07e-03 | 127 |
| GO:004341412 | Thyroid | ATC | macromolecule methylation | 131/6293 | 316/18723 | 2.01e-03 | 9.60e-03 | 131 |
| GO:003225911 | Thyroid | ATC | methylation | 148/6293 | 364/18723 | 2.69e-03 | 1.23e-02 | 148 |
| Page: 1 |
| Pathway ID | Tissue | Disease Stage | Description | Gene Ratio | Bg Ratio | pvalue | p.adjust | qvalue | Count |
| Page: 1 |
Top |
Cell-cell communication analysis |
| Identification of potential cell-cell interactions between two cell types and their ligand-receptor pairs for different disease states |
| Ligand | Receptor | LRpair | Pathway | Tissue | Disease Stage |
| Page: 1 |
Top |
Single-cell gene regulatory network inference analysis |
| Find out the significant the regulons (TFs) and the target genes of each regulon across cell types for different disease states |
| TF | Cell Type | Tissue | Disease Stage | Target Gene | RSS | Regulon Activity |
| ∗The dot plots of a searched regulon are shown for all cell subpopulations in each disease state of each tissue based on the regulon specific score inferred using pySCENIC and by calculating the average expression. |
| Page: 1 |
Top |
Somatic mutation of malignant transformation related genes |
| Annotation of somatic variants for genes involved in malignant transformation |
| Hugo Symbol | Variant Class | Variant Classification | dbSNP RS | HGVSc | HGVSp | HGVSp Short | SWISSPROT | BIOTYPE | SIFT | PolyPhen | Tumor Sample Barcode | Tissue | Histology | Sex | Age | Stage | Therapy Types | Drugs | Outcome |
| GATAD2A | SNV | Missense_Mutation | rs768273089 | c.1738N>A | p.Ala580Thr | p.A580T | Q86YP4 | protein_coding | tolerated(0.19) | benign(0) | TCGA-AN-A0AK-01 | Breast | breast invasive carcinoma | Female | >=65 | I/II | Unknown | Unknown | SD |
| GATAD2A | SNV | Missense_Mutation | novel | c.1844N>T | p.Arg615Leu | p.R615L | Q86YP4 | protein_coding | deleterious(0) | probably_damaging(0.998) | TCGA-C5-A7UE-01 | Cervix | cervical & endocervical cancer | Female | <65 | I/II | Chemotherapy | cisplatin | SD |
| GATAD2A | SNV | Missense_Mutation | novel | c.883G>C | p.Ala295Pro | p.A295P | Q86YP4 | protein_coding | deleterious(0.01) | possibly_damaging(0.9) | TCGA-C5-A7X5-01 | Cervix | cervical & endocervical cancer | Female | >=65 | I/II | Chemotherapy | carboplatin | PD |
| GATAD2A | SNV | Missense_Mutation | c.1724N>A | p.Ala575Asp | p.A575D | Q86YP4 | protein_coding | tolerated(0.28) | benign(0.033) | TCGA-A6-5665-01 | Colorectum | colon adenocarcinoma | Female | >=65 | I/II | Unknown | Unknown | PD | |
| GATAD2A | SNV | Missense_Mutation | c.92N>C | p.Met31Thr | p.M31T | Q86YP4 | protein_coding | deleterious(0.03) | benign(0.281) | TCGA-AA-3713-01 | Colorectum | colon adenocarcinoma | Male | >=65 | III/IV | Chemotherapy | 5-fluorouracil | PR | |
| GATAD2A | SNV | Missense_Mutation | novel | c.509T>C | p.Ile170Thr | p.I170T | Q86YP4 | protein_coding | deleterious(0.02) | probably_damaging(0.997) | TCGA-AA-3984-01 | Colorectum | colon adenocarcinoma | Female | <65 | I/II | Unknown | Unknown | SD |
| GATAD2A | SNV | Missense_Mutation | c.391G>A | p.Glu131Lys | p.E131K | Q86YP4 | protein_coding | deleterious(0.01) | possibly_damaging(0.664) | TCGA-AD-5900-01 | Colorectum | colon adenocarcinoma | Male | >=65 | I/II | Unknown | Unknown | SD | |
| GATAD2A | SNV | Missense_Mutation | novel | c.83N>C | p.Lys28Thr | p.K28T | Q86YP4 | protein_coding | deleterious(0.03) | benign(0.23) | TCGA-AZ-4315-01 | Colorectum | colon adenocarcinoma | Male | <65 | I/II | Unknown | Unknown | SD |
| GATAD2A | SNV | Missense_Mutation | c.25N>T | p.Arg9Trp | p.R9W | Q86YP4 | protein_coding | deleterious(0) | probably_damaging(0.999) | TCGA-AZ-6601-01 | Colorectum | colon adenocarcinoma | Male | >=65 | I/II | Unknown | Unknown | PD | |
| GATAD2A | SNV | Missense_Mutation | novel | c.631N>C | p.Ser211Pro | p.S211P | Q86YP4 | protein_coding | deleterious(0.02) | possibly_damaging(0.68) | TCGA-AZ-6601-01 | Colorectum | colon adenocarcinoma | Male | >=65 | I/II | Unknown | Unknown | PD |
| Page: 1 2 3 4 5 6 7 8 |
Top |
Related drugs of malignant transformation related genes |
| Identification of chemicals and drugs interact with genes involved in malignant transfromation |
| (DGIdb 4.0) |
| Entrez ID | Symbol | Category | Interaction Types | Drug Claim Name | Drug Name | PMIDs |
| Page: 1 |

Copyright 2023-Present -The University of Texas Health Science Center at Houston |