Schematic overview of the cellular and molecular mechanisms involved in the cancer progression, including the proposed cellular and molecular mechanisms in cancer cells trajectory. AT1: alveolar type 1 cells; AT2: alveolar type 2 cells; AAH: atypical adenomatous hyperplasia; AIS: adenocarcinoma in situ; MIA: minimally invasive adenocarcinoma; IA: invasive adenocarcinoma; EMT: epithelial-mesenchymal transition

Home

Download

Statistics

Help

Contact

Center for Computational Systems Medicine
leaf

Gene summary

leaf

Malignant transformation analysis

leaf

Malignant transformation related pathway analysis

leaf

Cell-cell communication analysis

leaf

Single-cell gene regulatory network inference analysis

leaf

Somatic mutation of malignant transformation related genes

leaf

Related drugs of malignant transformation related genes

Gene: FAM3C

Gene summary for FAM3C

check button Gene summary.

Gene informationSpeciesHuman
Gene symbol

FAM3C

Gene ID

10447

Gene nameFAM3 metabolism regulating signaling molecule C
Gene AliasGS3786
Cytomap7q31.31
Gene Typeprotein-coding
GO ID

GO:0005975

UniProtAcc

Q92520


Top

Malignant transformation analysis

check button Identification of the aberrant gene expression in precancerous and cancerous lesions by comparing the gene expression of stem-like cells in diseased tissues with normal stem cells
check button Malignant transformation involving gene list.
Entrez IDSymbolReplicatesSpeciesOrganTissueAdj P-valueLog2FCMalignancy
10447FAM3CC09HumanOral cavityOSCC4.42e-471.66e+000.1431
10447FAM3CLN22HumanOral cavityOSCC8.65e-047.79e-010.1733
10447FAM3CLN46HumanOral cavityOSCC1.21e-044.20e-010.1666
10447FAM3CLP15HumanOral cavityLP9.69e-092.21e+000.2174
10447FAM3CLP17HumanOral cavityLP7.69e-061.23e+000.2349
10447FAM3CSYSMH1HumanOral cavityOSCC1.14e-651.63e+000.1127
10447FAM3CSYSMH2HumanOral cavityOSCC9.42e-117.52e-010.2326
10447FAM3CSYSMH3HumanOral cavityOSCC7.07e-218.34e-010.2442
10447FAM3CSYSMH6HumanOral cavityOSCC2.94e-095.54e-010.1275
10447FAM3CGSM5252126_BPH283PrGF_ViaHumanProstateBPH4.01e-03-3.99e-02-0.1771
10447FAM3CGSM5252128_BPH327PrGF_ViaHumanProstateBPH1.03e-05-3.27e-01-0.1688
10447FAM3CGSM5252132_BPH389PrGFHumanProstateBPH7.94e-032.15e-01-0.2247
10447FAM3CGSM5252133_BPH389PrSFHumanProstateBPH8.87e-086.36e-01-0.2027
10447FAM3CGSM5252135_BPH511PrPUr_Fcol_3GEXHumanProstateBPH1.76e-077.42e-01-0.1833
10447FAM3CGSM5252136_BPH556PrGA1_FcolHumanProstateBPH8.41e-08-3.78e-01-0.23
10447FAM3CGSM5252137_BPH556PrGA2_FcolHumanProstateBPH1.26e-05-3.02e-01-0.23
10447FAM3C047563_1562-all-cellsHumanProstateBPH9.68e-22-4.02e-010.0791
10447FAM3C052095_1628-all-cellsHumanProstateBPH3.29e-04-3.18e-010.1032
10447FAM3C052099_1652-all-cellsHumanProstateBPH2.06e-02-2.23e-010.1038
10447FAM3CDong_P1HumanProstateTumor1.32e-23-5.73e-020.035
Page: 1 2 3 4 5 6 7 8 9 

check button Transcriptomic changes along malignancy continuum.
TissueExpression DynamicsAbbreviation
EsophagusThe image shows the transcriptomic changes along malignancy continuum.log2FC in expression of this searched gene in stem-like cells from each diseased tissue sample relative to stem-like cells in normal samples in each tissue plotted against the malignancy continuum. Samples are colored based on if they are from different disease stage.
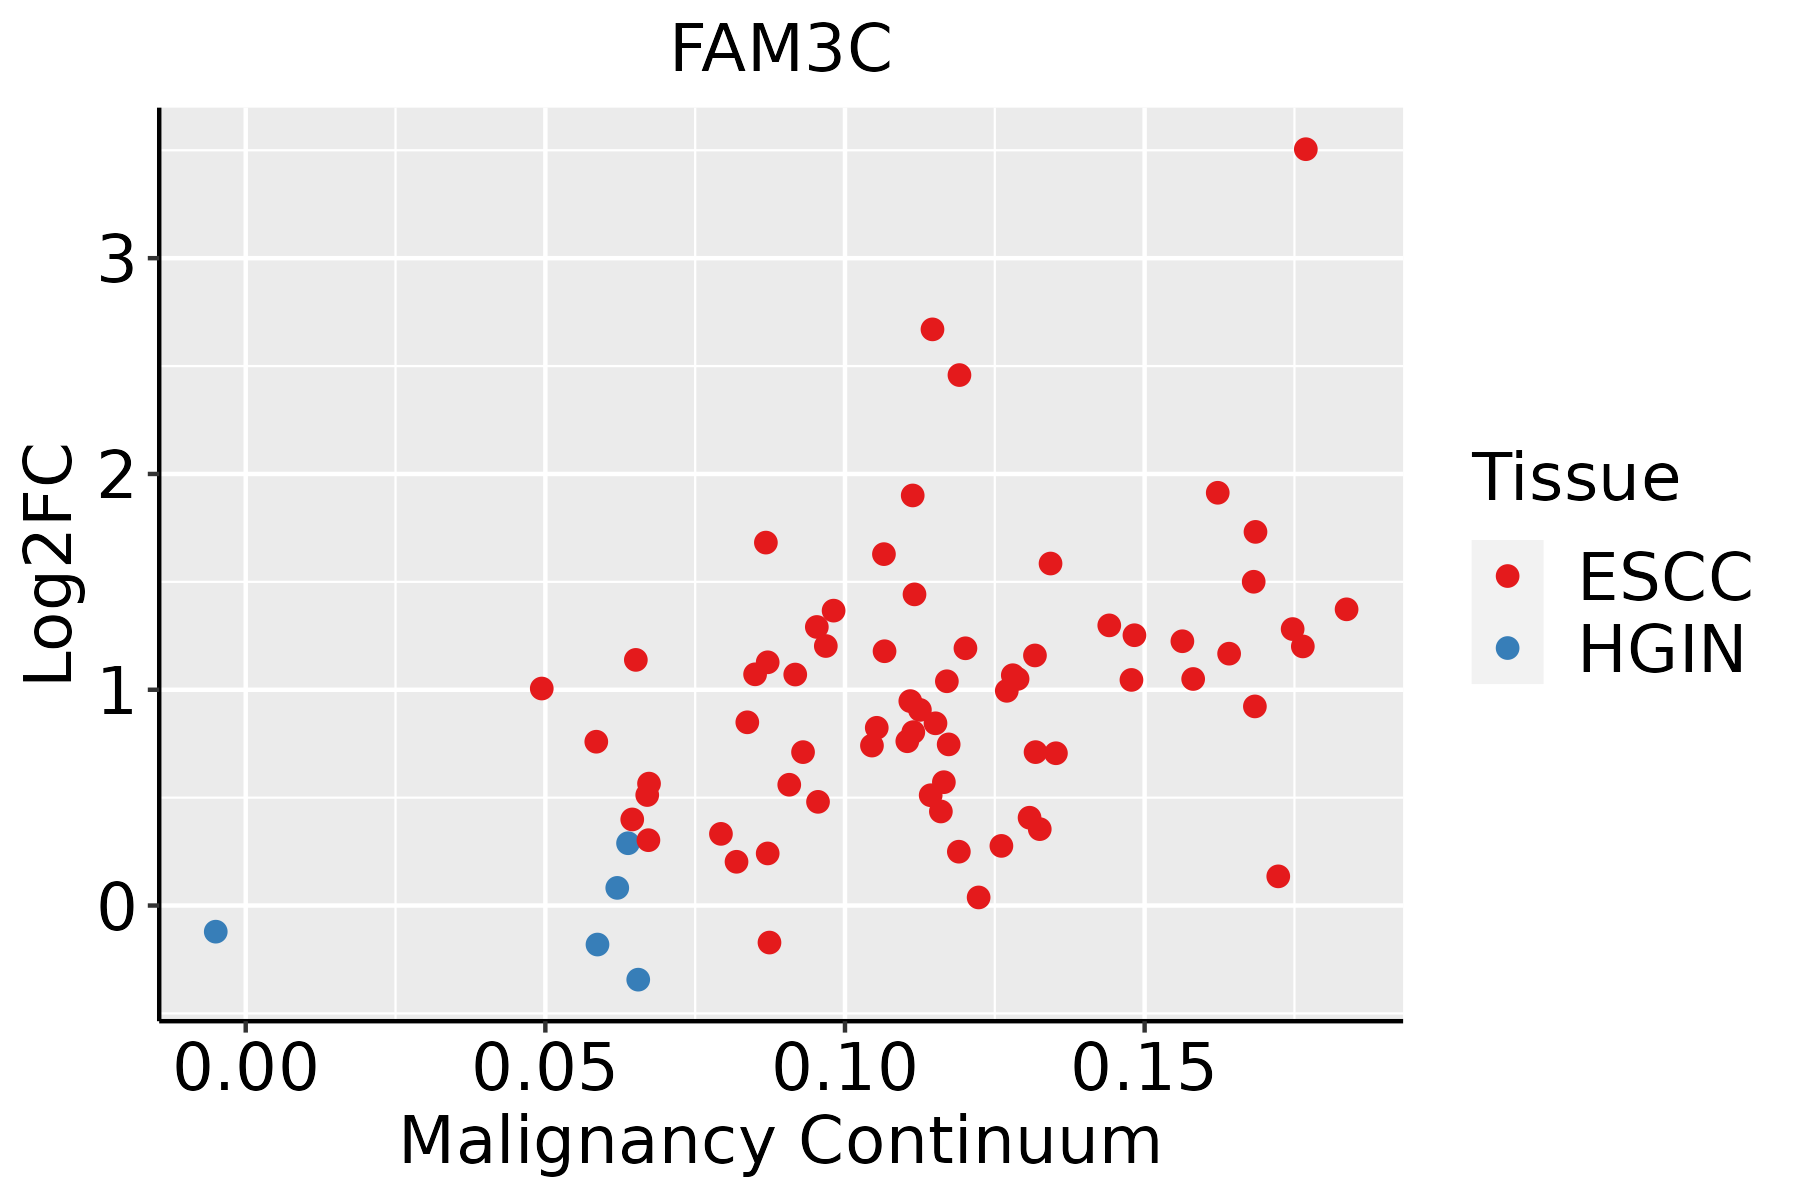
ESCC: Esophageal squamous cell carcinoma
HGIN: High-grade intraepithelial neoplasias
LGIN: Low-grade intraepithelial neoplasias
GCThe image shows the transcriptomic changes along malignancy continuum.log2FC in expression of this searched gene in stem-like cells from each diseased tissue sample relative to stem-like cells in normal samples in each tissue plotted against the malignancy continuum. Samples are colored based on if they are from different disease stage.
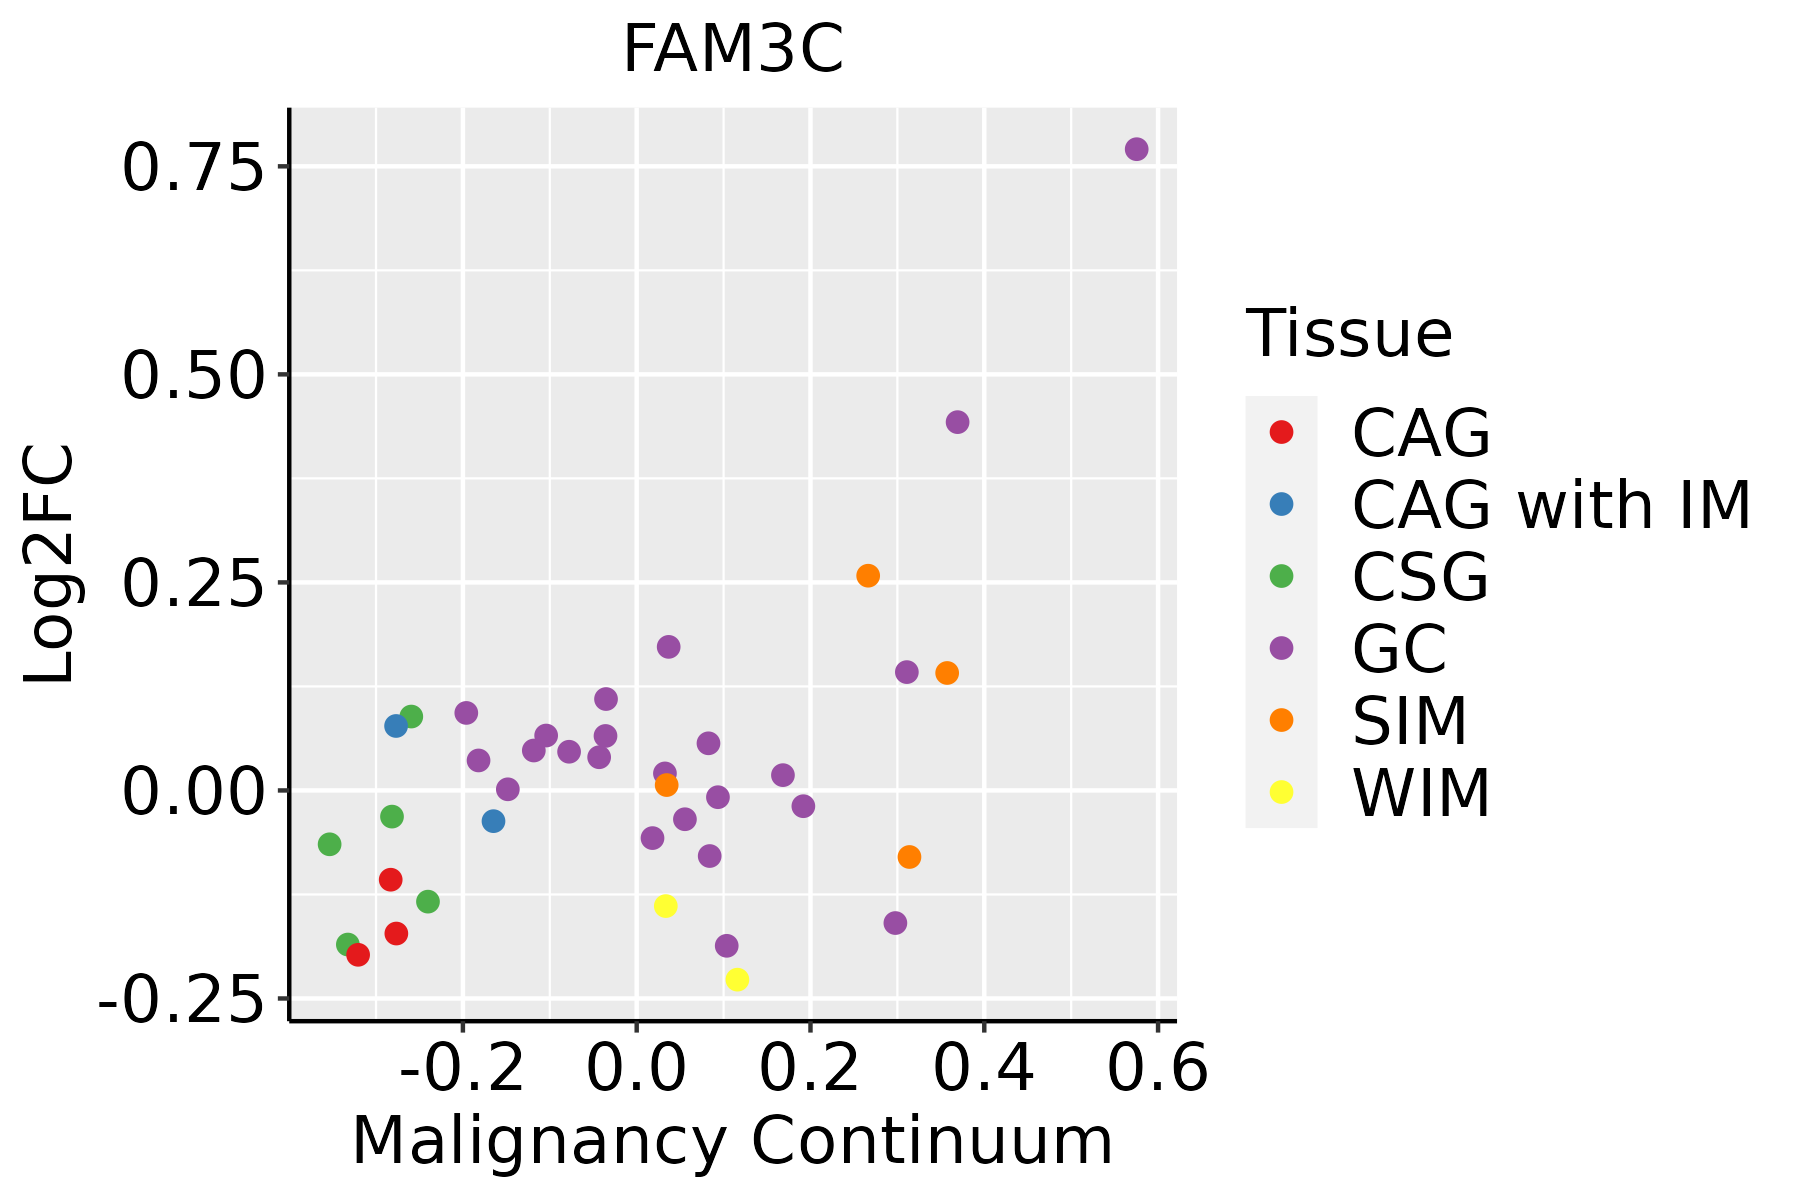
CAG: Chronic atrophic gastritis
CAG with IM: Chronic atrophic gastritis with intestinal metaplasia
CSG: Chronic superficial gastritis
GC: Gastric cancer
SIM: Severe intestinal metaplasia
WIM: Wild intestinal metaplasia
LiverThe image shows the transcriptomic changes along malignancy continuum.log2FC in expression of this searched gene in stem-like cells from each diseased tissue sample relative to stem-like cells in normal samples in each tissue plotted against the malignancy continuum. Samples are colored based on if they are from different disease stage.
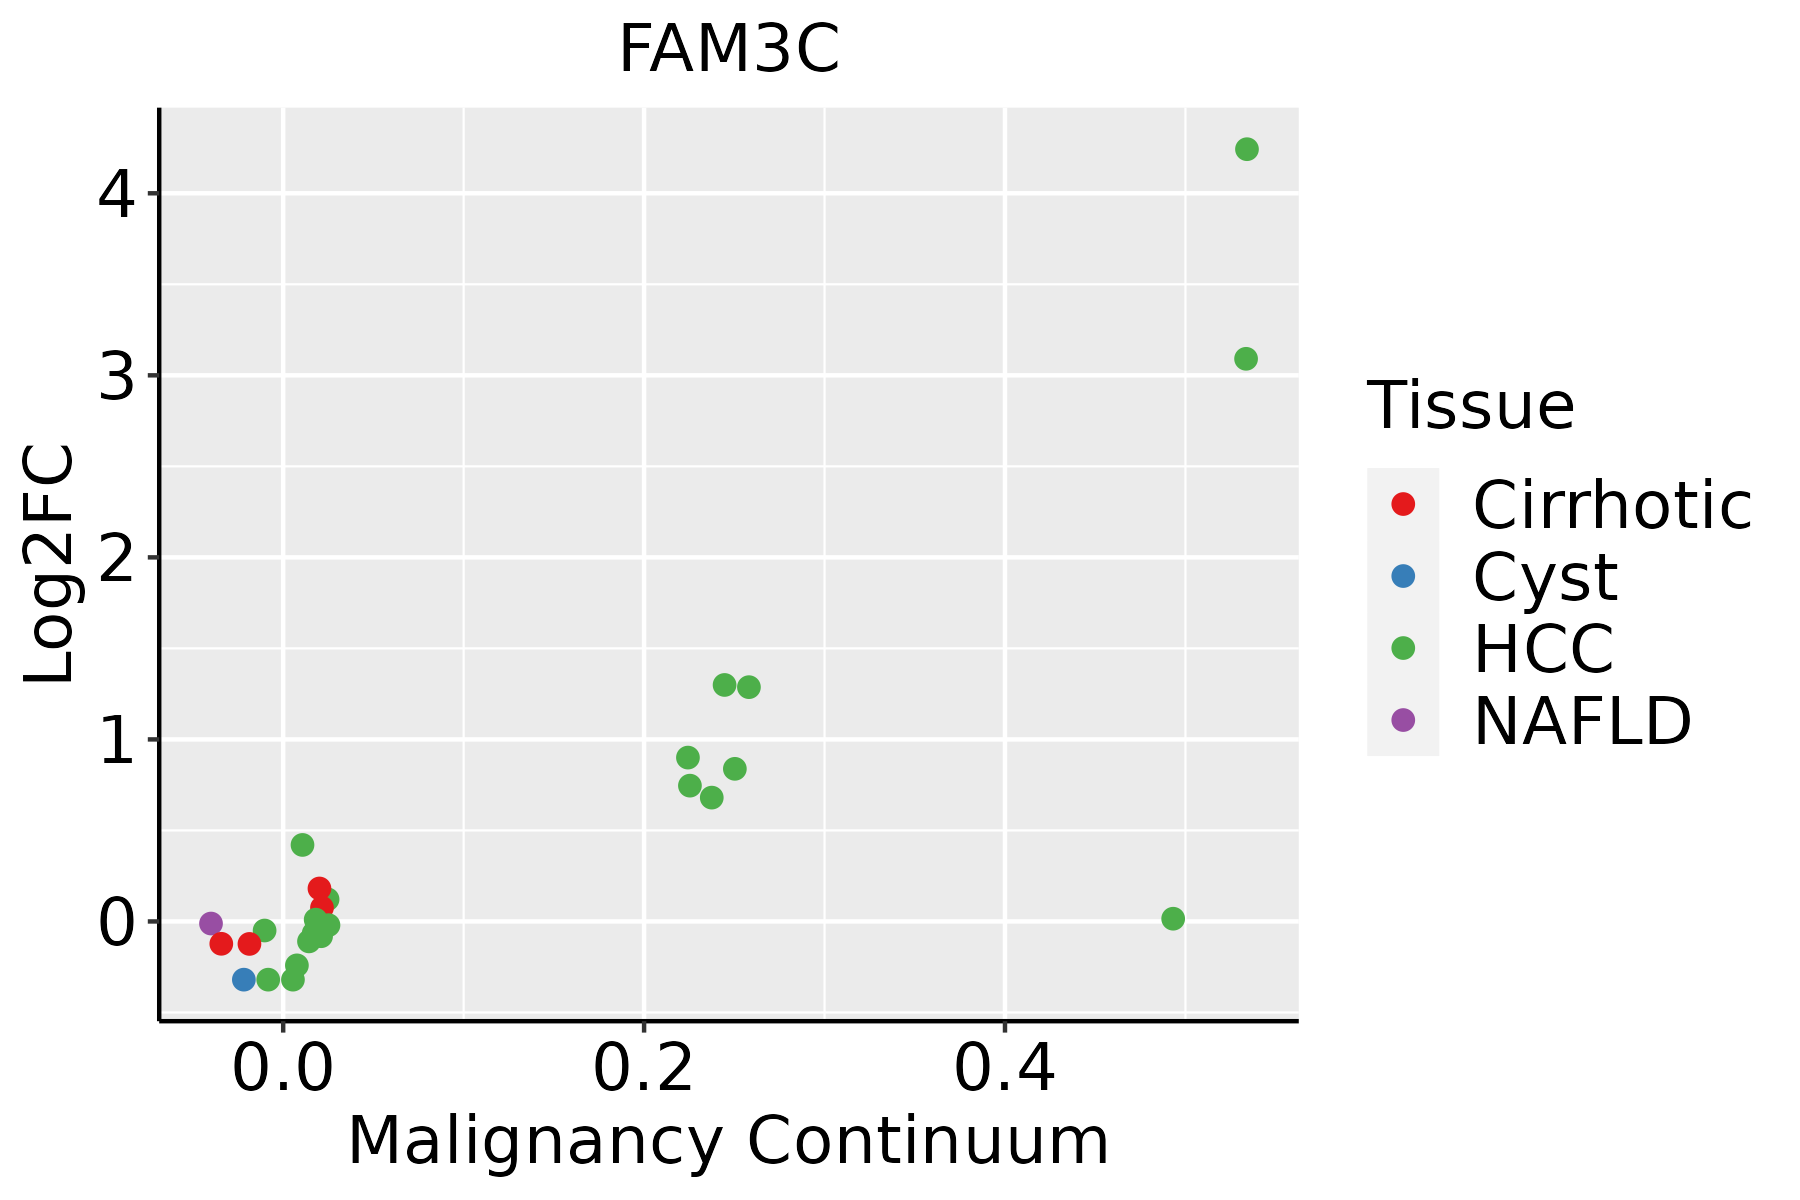
HCC: Hepatocellular carcinoma
NAFLD: Non-alcoholic fatty liver disease
LungThe image shows the transcriptomic changes along malignancy continuum.log2FC in expression of this searched gene in stem-like cells from each diseased tissue sample relative to stem-like cells in normal samples in each tissue plotted against the malignancy continuum. Samples are colored based on if they are from different disease stage.
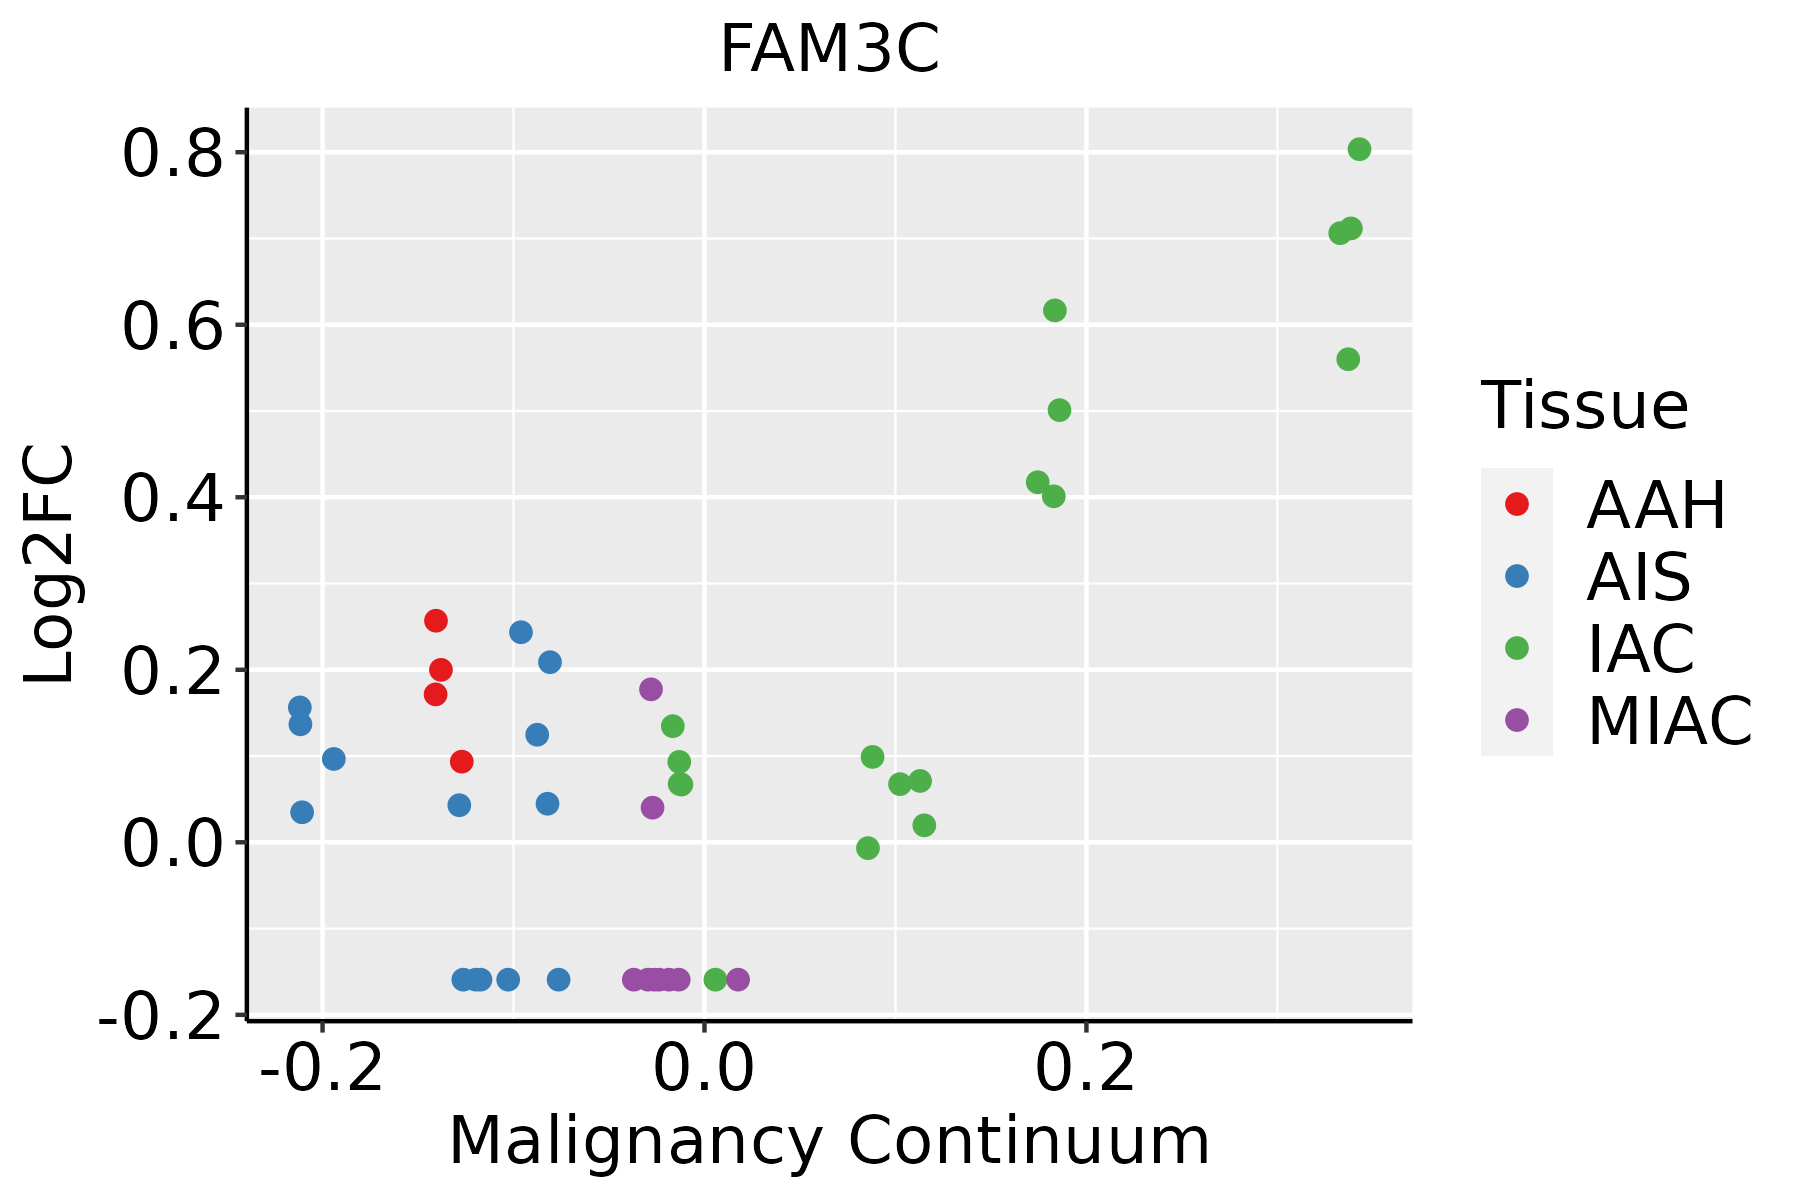
AAH: Atypical adenomatous hyperplasia
AIS: Adenocarcinoma in situ
IAC: Invasive lung adenocarcinoma
MIA: Minimally invasive adenocarcinoma
Oral CavityThe image shows the transcriptomic changes along malignancy continuum.log2FC in expression of this searched gene in stem-like cells from each diseased tissue sample relative to stem-like cells in normal samples in each tissue plotted against the malignancy continuum. Samples are colored based on if they are from different disease stage.
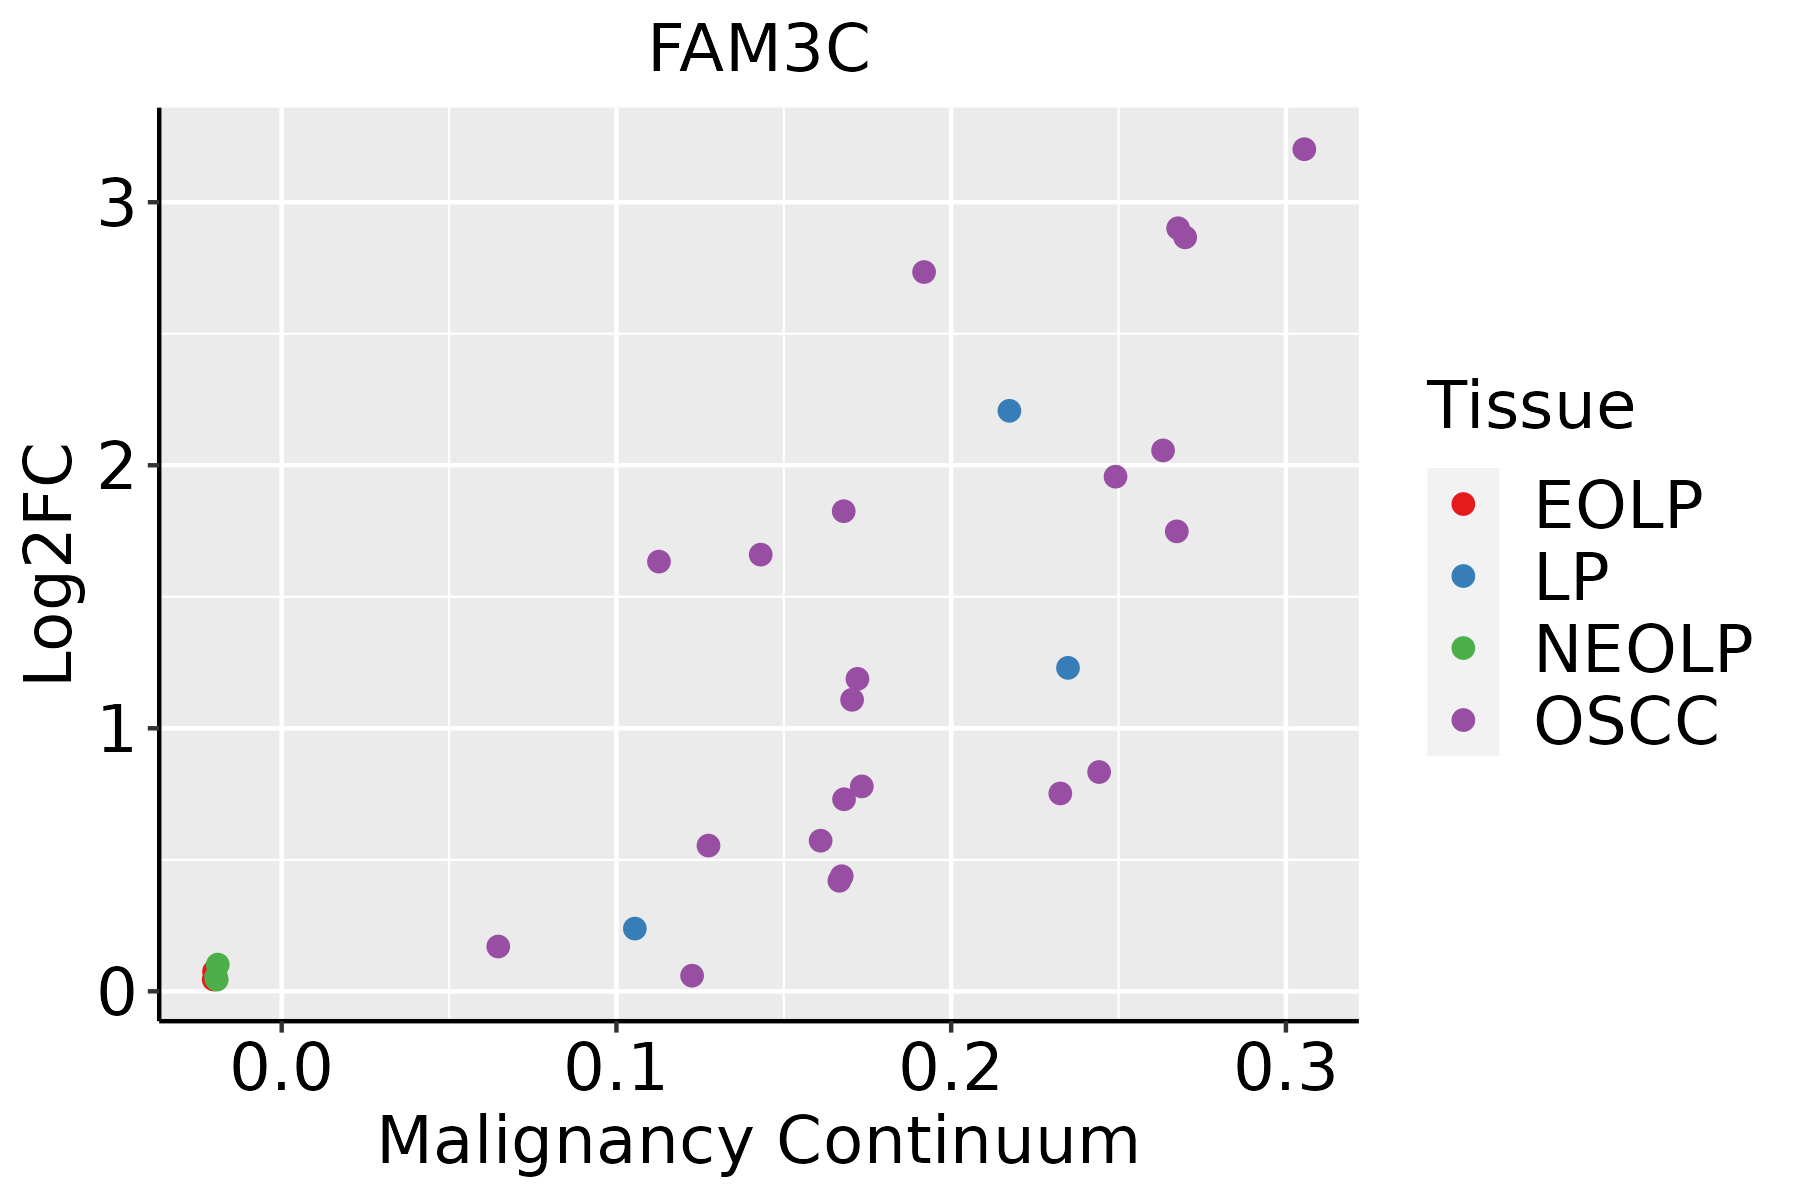
EOLP: Erosive Oral lichen planus
LP: leukoplakia
NEOLP: Non-erosive oral lichen planus
OSCC: Oral squamous cell carcinoma
ProstateThe image shows the transcriptomic changes along malignancy continuum.log2FC in expression of this searched gene in stem-like cells from each diseased tissue sample relative to stem-like cells in normal samples in each tissue plotted against the malignancy continuum. Samples are colored based on if they are from different disease stage.
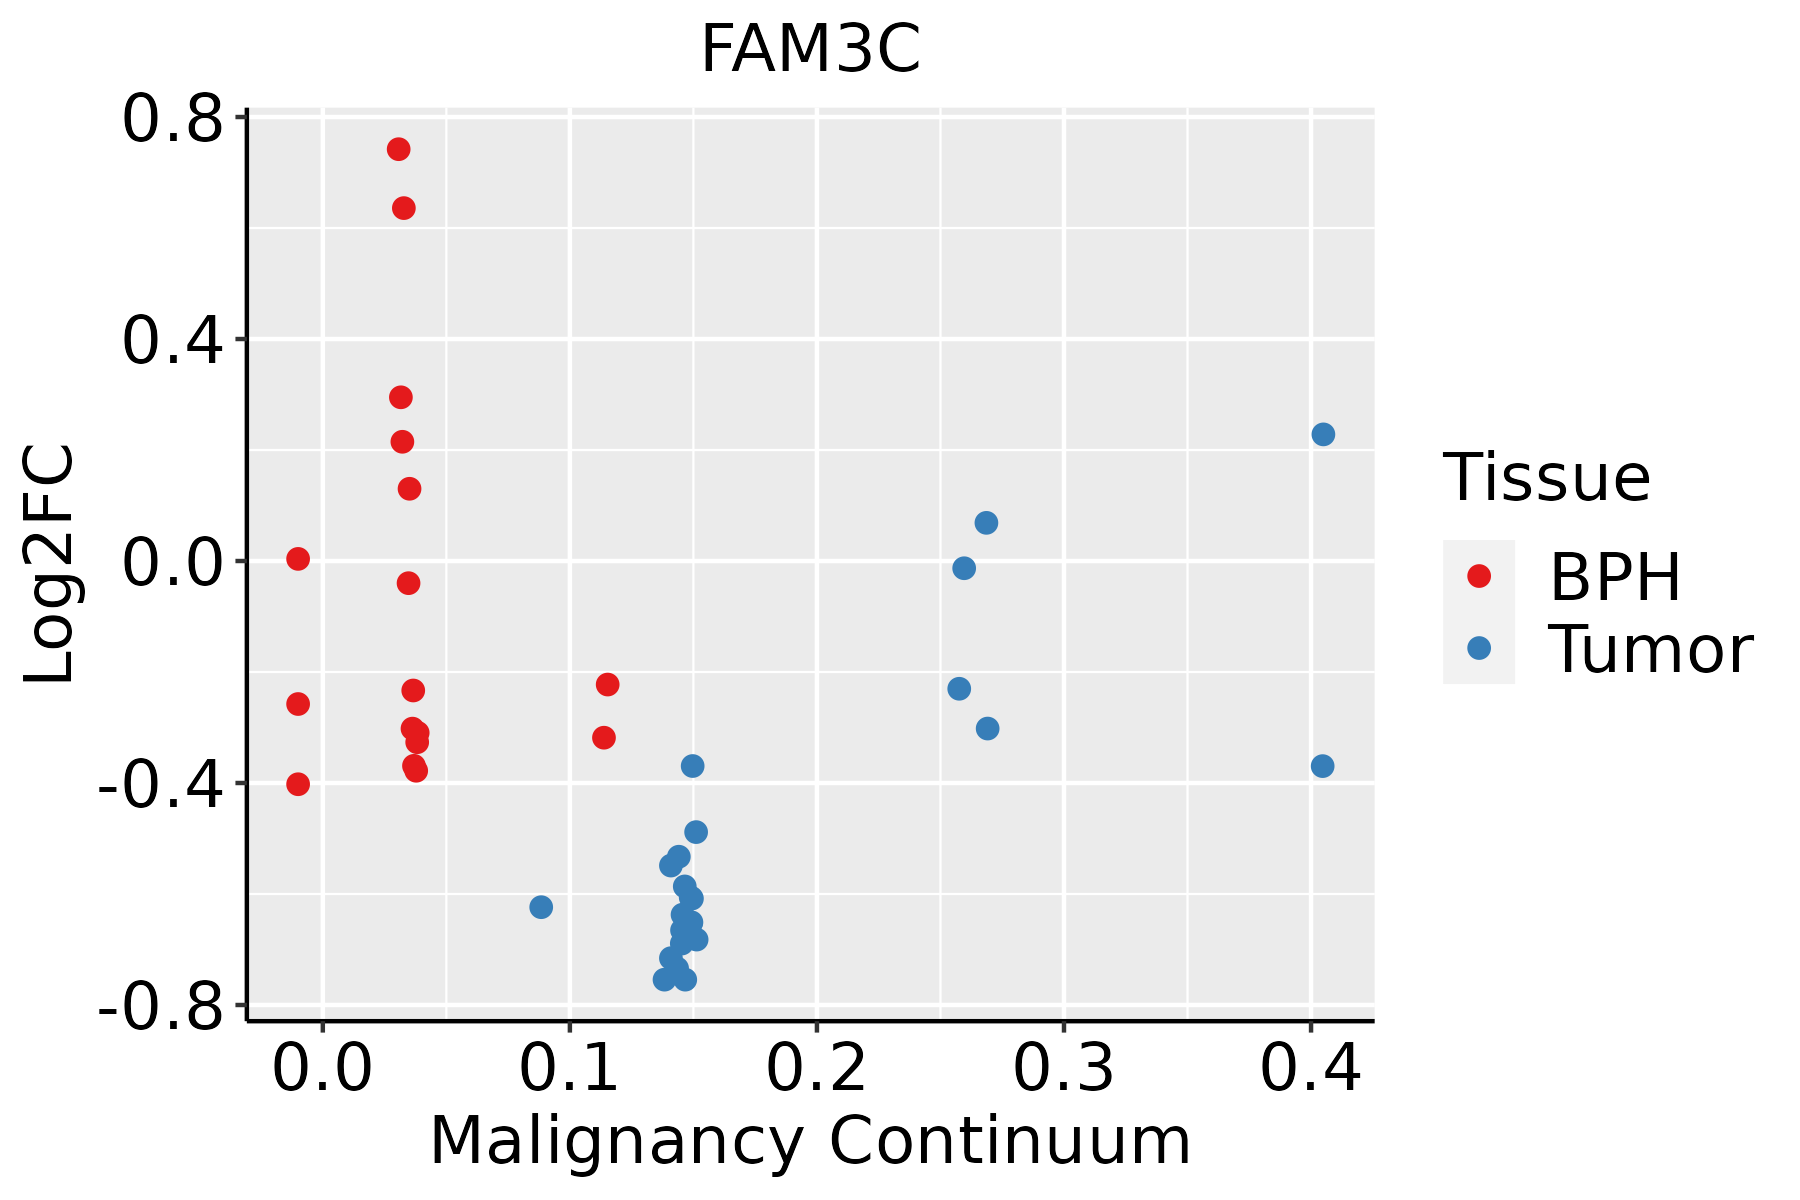
BPH: Benign Prostatic Hyperplasia
SkinThe image shows the transcriptomic changes along malignancy continuum.log2FC in expression of this searched gene in stem-like cells from each diseased tissue sample relative to stem-like cells in normal samples in each tissue plotted against the malignancy continuum. Samples are colored based on if they are from different disease stage.
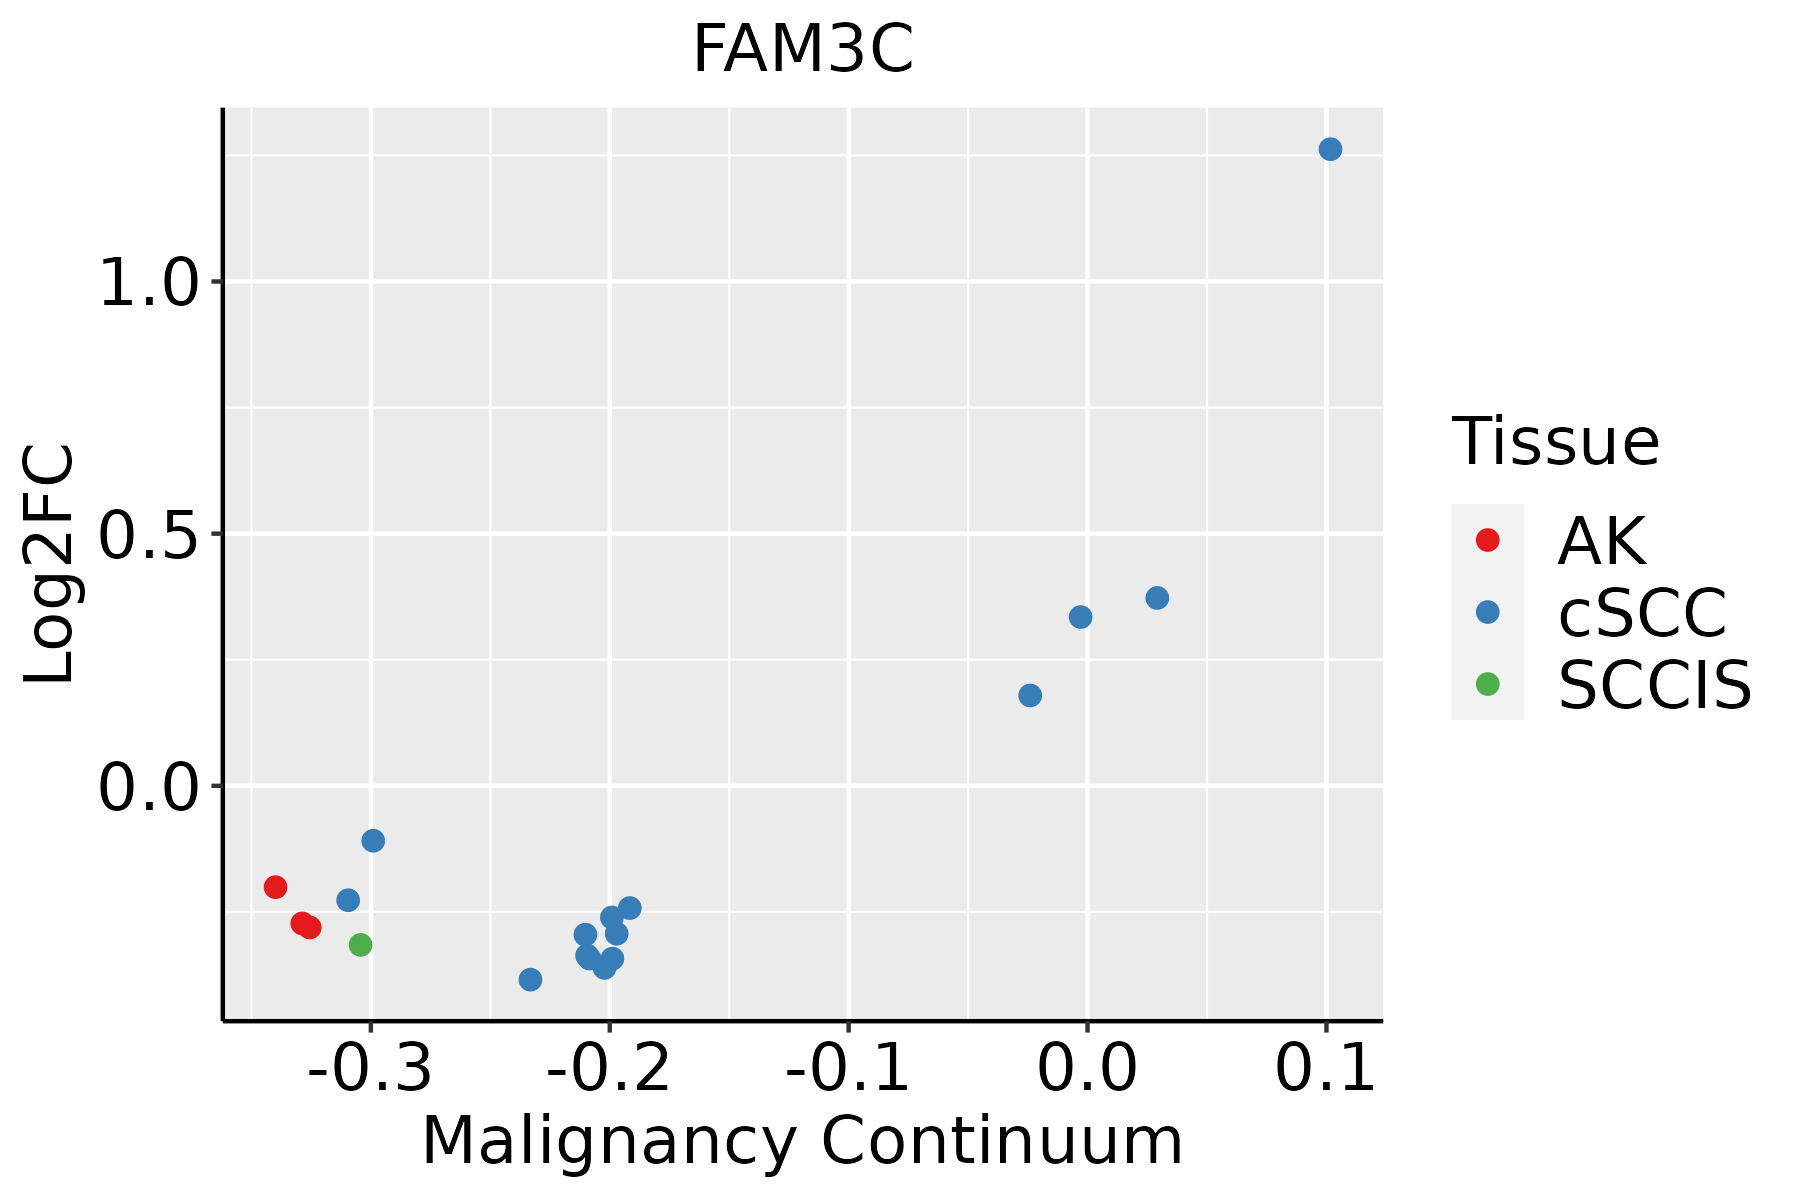
AK: Actinic keratosis
cSCC: Cutaneous squamous cell carcinoma
SCCIS:squamous cell carcinoma in situ
ThyroidThe image shows the transcriptomic changes along malignancy continuum.log2FC in expression of this searched gene in stem-like cells from each diseased tissue sample relative to stem-like cells in normal samples in each tissue plotted against the malignancy continuum. Samples are colored based on if they are from different disease stage.ATC: Anaplastic thyroid cancer
HT: Hashimoto's thyroiditis
PTC: Papillary thyroid cancer
∗log2FC in expression of this searched gene in stem-like cells from each diseased tissue sample relative to stem-like cells in normal samples in each tissue plotted against the malignancy continuum. Samples are colored based on if they are from different disease stage.

Top

Malignant transformation related pathway analysis

check buttonFind out the enriched GO biological processes and KEGG pathways involved in transition from healthy to precancer to cancer
check button Figure of enriched GO biological processes.
TissueDisease StageEnriched GO biological Processes
ColorectumADGO analysis - Figure of enriched GO biological processes: Top 15 enriched GO BP terms are showed in the bar plot of each disease state in each tissue. Each row represents a significant GO biological process which is colored according to the -log10(p.adjust).
ColorectumSERGO analysis - Figure of enriched GO biological processes: Top 15 enriched GO BP terms are showed in the bar plot of each disease state in each tissue. Each row represents a significant GO biological process which is colored according to the -log10(p.adjust).
ColorectumMSSGO analysis - Figure of enriched GO biological processes: Top 15 enriched GO BP terms are showed in the bar plot of each disease state in each tissue. Each row represents a significant GO biological process which is colored according to the -log10(p.adjust).
ColorectumMSI-HGO analysis - Figure of enriched GO biological processes: Top 15 enriched GO BP terms are showed in the bar plot of each disease state in each tissue. Each row represents a significant GO biological process which is colored according to the -log10(p.adjust).
ColorectumFAPGO analysis - Figure of enriched GO biological processes: Top 15 enriched GO BP terms are showed in the bar plot of each disease state in each tissue. Each row represents a significant GO biological process which is colored according to the -log10(p.adjust).
∗Top 15 enriched GO BP terms are showed in the bar plot of each disease state in each tissue. Each row represents a significant GO biological process which is colored according to the -log10(p.adjust).
Page: 1 2 3 4 5 6 7 8 9 

check button Enriched GO biological processes.
GO IDTissueDisease StageDescriptionGene RatioBg Ratiopvaluep.adjustCount
GO:00059969EsophagusESCCmonosaccharide metabolic process159/8552257/187231.11e-071.81e-06159
GO:00193189EsophagusESCChexose metabolic process147/8552237/187232.63e-073.94e-06147
GO:00060069EsophagusESCCglucose metabolic process119/8552196/187231.51e-051.36e-04119
GO:00442626EsophagusESCCcellular carbohydrate metabolic process160/8552283/187231.43e-049.66e-04160
GO:00160514EsophagusESCCcarbohydrate biosynthetic process117/8552202/187232.96e-041.79e-03117
GO:00620129EsophagusESCCregulation of small molecule metabolic process184/8552334/187233.11e-041.85e-03184
GO:00463643EsophagusESCCmonosaccharide biosynthetic process52/855282/187239.03e-044.61e-0352
GO:00109065EsophagusESCCregulation of glucose metabolic process71/8552119/187231.46e-036.92e-0371
GO:00193193EsophagusESCChexose biosynthetic process49/855278/187231.69e-037.81e-0349
GO:00061096EsophagusESCCregulation of carbohydrate metabolic process101/8552178/187231.89e-038.52e-03101
GO:00106755EsophagusESCCregulation of cellular carbohydrate metabolic process83/8552146/187234.24e-031.69e-0283
GO:00060943EsophagusESCCgluconeogenesis46/855275/187234.54e-031.78e-0246
GO:000599612LiverCirrhoticmonosaccharide metabolic process104/4634257/187231.74e-086.32e-07104
GO:001931812LiverCirrhotichexose metabolic process97/4634237/187232.67e-089.16e-0797
GO:000600611LiverCirrhoticglucose metabolic process82/4634196/187231.01e-072.93e-0682
GO:006201212LiverCirrhoticregulation of small molecule metabolic process124/4634334/187232.74e-076.79e-06124
GO:000610911LiverCirrhoticregulation of carbohydrate metabolic process70/4634178/187231.14e-051.62e-0470
GO:00463641LiverCirrhoticmonosaccharide biosynthetic process37/463482/187234.52e-055.30e-0437
GO:004426211LiverCirrhoticcellular carbohydrate metabolic process97/4634283/187231.89e-041.76e-0397
GO:00160511LiverCirrhoticcarbohydrate biosynthetic process73/4634202/187231.91e-041.77e-0373
Page: 1 2 3 4 5 

check button Enriched KEGG pathways.
Pathway IDTissueDisease StageDescriptionGene RatioBg Ratiopvaluep.adjustqvalueCount
Page: 1 

Top

Cell-cell communication analysis

check buttonIdentification of potential cell-cell interactions between two cell types and their ligand-receptor pairs for different disease states
LigandReceptorLRpairPathwayTissueDisease Stage
Page: 1 

Top

Single-cell gene regulatory network inference analysis

check buttonFind out the significant the regulons (TFs) and the target genes of each regulon across cell types for different disease states
TFCell TypeTissueDisease StageTarget GeneRSSRegulon Activity
∗The dot plots of a searched regulon are shown for all cell subpopulations in each disease state of each tissue based on the regulon specific score inferred using pySCENIC and by calculating the average expression.
Page: 1 

Top

Somatic mutation of malignant transformation related genes

check buttonAnnotation of somatic variants for genes involved in malignant transformation
Hugo SymbolVariant ClassVariant ClassificationdbSNP RSHGVScHGVSpHGVSp ShortSWISSPROTBIOTYPESIFTPolyPhenTumor Sample BarcodeTissueHistologySexAgeStageTherapy TypesDrugsOutcome
FAM3CSNVMissense_Mutationnovelc.667C>Tp.Pro223Serp.P223SQ92520protein_codingdeleterious(0.02)probably_damaging(0.976)TCGA-A7-A3IZ-01Breastbreast invasive carcinomaFemale<65I/IIChemotherapycytoxanSD
FAM3CSNVMissense_Mutationc.117N>Gp.Phe39Leup.F39LQ92520protein_codingtolerated(0.39)benign(0.003)TCGA-BH-A0BG-01Breastbreast invasive carcinomaFemale>=65I/IIUnknownUnknownSD
FAM3CSNVMissense_Mutationnovelc.164G>Tp.Arg55Ilep.R55IQ92520protein_codingdeleterious(0)benign(0.288)TCGA-2W-A8YY-01Cervixcervical & endocervical cancerFemale<65I/IIChemotherapycisplatinCR
FAM3CSNVMissense_Mutationnovelc.71C>Ap.Ser24Tyrp.S24YQ92520protein_codingtolerated(0.91)benign(0.162)TCGA-2W-A8YY-01Cervixcervical & endocervical cancerFemale<65I/IIChemotherapycisplatinCR
FAM3CSNVMissense_Mutationnovelc.451G>Ap.Asp151Asnp.D151NQ92520protein_codingdeleterious(0)probably_damaging(0.999)TCGA-F5-6814-01Colorectumrectum adenocarcinomaMale<65I/IIUnknownUnknownSD
FAM3CSNVMissense_Mutationnovelc.411G>Tp.Lys137Asnp.K137NQ92520protein_codingdeleterious(0.03)benign(0.042)TCGA-A5-A0G1-01Endometriumuterine corpus endometrioid carcinomaFemale>=65I/IIUnknownUnknownSD
FAM3CSNVMissense_Mutationnovelc.509G>Tp.Ser170Ilep.S170IQ92520protein_codingdeleterious(0)probably_damaging(0.999)TCGA-A5-A0G2-01Endometriumuterine corpus endometrioid carcinomaFemale<65III/IVUnknownUnknownSD
FAM3CSNVMissense_Mutationrs772971347c.488G>Ap.Arg163Glnp.R163QQ92520protein_codingtolerated(0.12)benign(0.006)TCGA-AP-A051-01Endometriumuterine corpus endometrioid carcinomaFemale>=65I/IIUnknownUnknownSD
FAM3CSNVMissense_Mutationc.291N>Tp.Lys97Asnp.K97NQ92520protein_codingdeleterious(0.03)benign(0.251)TCGA-AP-A059-01Endometriumuterine corpus endometrioid carcinomaFemale>=65I/IIUnknownUnknownSD
FAM3CSNVMissense_Mutationc.88A>Cp.Lys30Glnp.K30QQ92520protein_codingtolerated(0.53)benign(0.444)TCGA-AX-A0J0-01Endometriumuterine corpus endometrioid carcinomaFemale<65I/IIUnknownUnknownSD
Page: 1 2 3 

Top

Related drugs of malignant transformation related genes

check buttonIdentification of chemicals and drugs interact with genes involved in malignant transfromation
(DGIdb 4.0)
Entrez IDSymbolCategoryInteraction TypesDrug Claim NameDrug NamePMIDs
Page: 1