
|
|||||
|
 | |
| |
| |
| |
| |
| |
|
Gene: EIF3H |
Gene summary for EIF3H |
| Gene information | Species | Human | Gene symbol | EIF3H | Gene ID | 8667 |
| Gene name | eukaryotic translation initiation factor 3 subunit H | |
| Gene Alias | EIF3S3 | |
| Cytomap | 8q23.3-q24.11 | |
| Gene Type | protein-coding | GO ID | GO:0001732 | UniProtAcc | O15372 |
Top |
Malignant transformation analysis |
| Identification of the aberrant gene expression in precancerous and cancerous lesions by comparing the gene expression of stem-like cells in diseased tissues with normal stem cells |
| Entrez ID | Symbol | Replicates | Species | Organ | Tissue | Adj P-value | Log2FC | Malignancy |
| 8667 | EIF3H | P5T-E | Human | Esophagus | ESCC | 6.87e-50 | 1.55e+00 | 0.1327 |
| 8667 | EIF3H | P8T-E | Human | Esophagus | ESCC | 2.83e-32 | 9.07e-01 | 0.0889 |
| 8667 | EIF3H | P9T-E | Human | Esophagus | ESCC | 1.03e-35 | 1.60e+00 | 0.1131 |
| 8667 | EIF3H | P10T-E | Human | Esophagus | ESCC | 5.44e-70 | 1.74e+00 | 0.116 |
| 8667 | EIF3H | P11T-E | Human | Esophagus | ESCC | 1.19e-18 | 1.11e+00 | 0.1426 |
| 8667 | EIF3H | P12T-E | Human | Esophagus | ESCC | 5.00e-64 | 1.89e+00 | 0.1122 |
| 8667 | EIF3H | P15T-E | Human | Esophagus | ESCC | 2.36e-74 | 2.43e+00 | 0.1149 |
| 8667 | EIF3H | P16T-E | Human | Esophagus | ESCC | 4.75e-68 | 2.27e+00 | 0.1153 |
| 8667 | EIF3H | P17T-E | Human | Esophagus | ESCC | 4.94e-21 | 1.55e+00 | 0.1278 |
| 8667 | EIF3H | P19T-E | Human | Esophagus | ESCC | 5.71e-08 | 1.56e+00 | 0.1662 |
| 8667 | EIF3H | P20T-E | Human | Esophagus | ESCC | 4.42e-28 | 1.31e+00 | 0.1124 |
| 8667 | EIF3H | P21T-E | Human | Esophagus | ESCC | 9.42e-84 | 2.49e+00 | 0.1617 |
| 8667 | EIF3H | P22T-E | Human | Esophagus | ESCC | 4.19e-87 | 1.85e+00 | 0.1236 |
| 8667 | EIF3H | P23T-E | Human | Esophagus | ESCC | 3.39e-56 | 2.16e+00 | 0.108 |
| 8667 | EIF3H | P24T-E | Human | Esophagus | ESCC | 9.55e-48 | 1.54e+00 | 0.1287 |
| 8667 | EIF3H | P26T-E | Human | Esophagus | ESCC | 7.36e-110 | 2.80e+00 | 0.1276 |
| 8667 | EIF3H | P27T-E | Human | Esophagus | ESCC | 5.39e-59 | 1.83e+00 | 0.1055 |
| 8667 | EIF3H | P28T-E | Human | Esophagus | ESCC | 1.46e-53 | 2.03e+00 | 0.1149 |
| 8667 | EIF3H | P30T-E | Human | Esophagus | ESCC | 3.00e-52 | 2.57e+00 | 0.137 |
| 8667 | EIF3H | P31T-E | Human | Esophagus | ESCC | 3.22e-98 | 2.62e+00 | 0.1251 |
| Page: 1 2 3 4 5 6 7 8 9 10 11 12 13 |
| Tissue | Expression Dynamics | Abbreviation |
| Breast |  | IDC: Invasive ductal carcinoma |
| DCIS: Ductal carcinoma in situ | ||
| Precancer(BRCA1-mut): Precancerous lesion from BRCA1 mutation carriers | ||
| Colorectum (GSE201348) |  | FAP: Familial adenomatous polyposis |
| CRC: Colorectal cancer | ||
| Colorectum (HTA11) |  | AD: Adenomas |
| SER: Sessile serrated lesions | ||
| MSI-H: Microsatellite-high colorectal cancer | ||
| MSS: Microsatellite stable colorectal cancer | ||
| Endometrium | 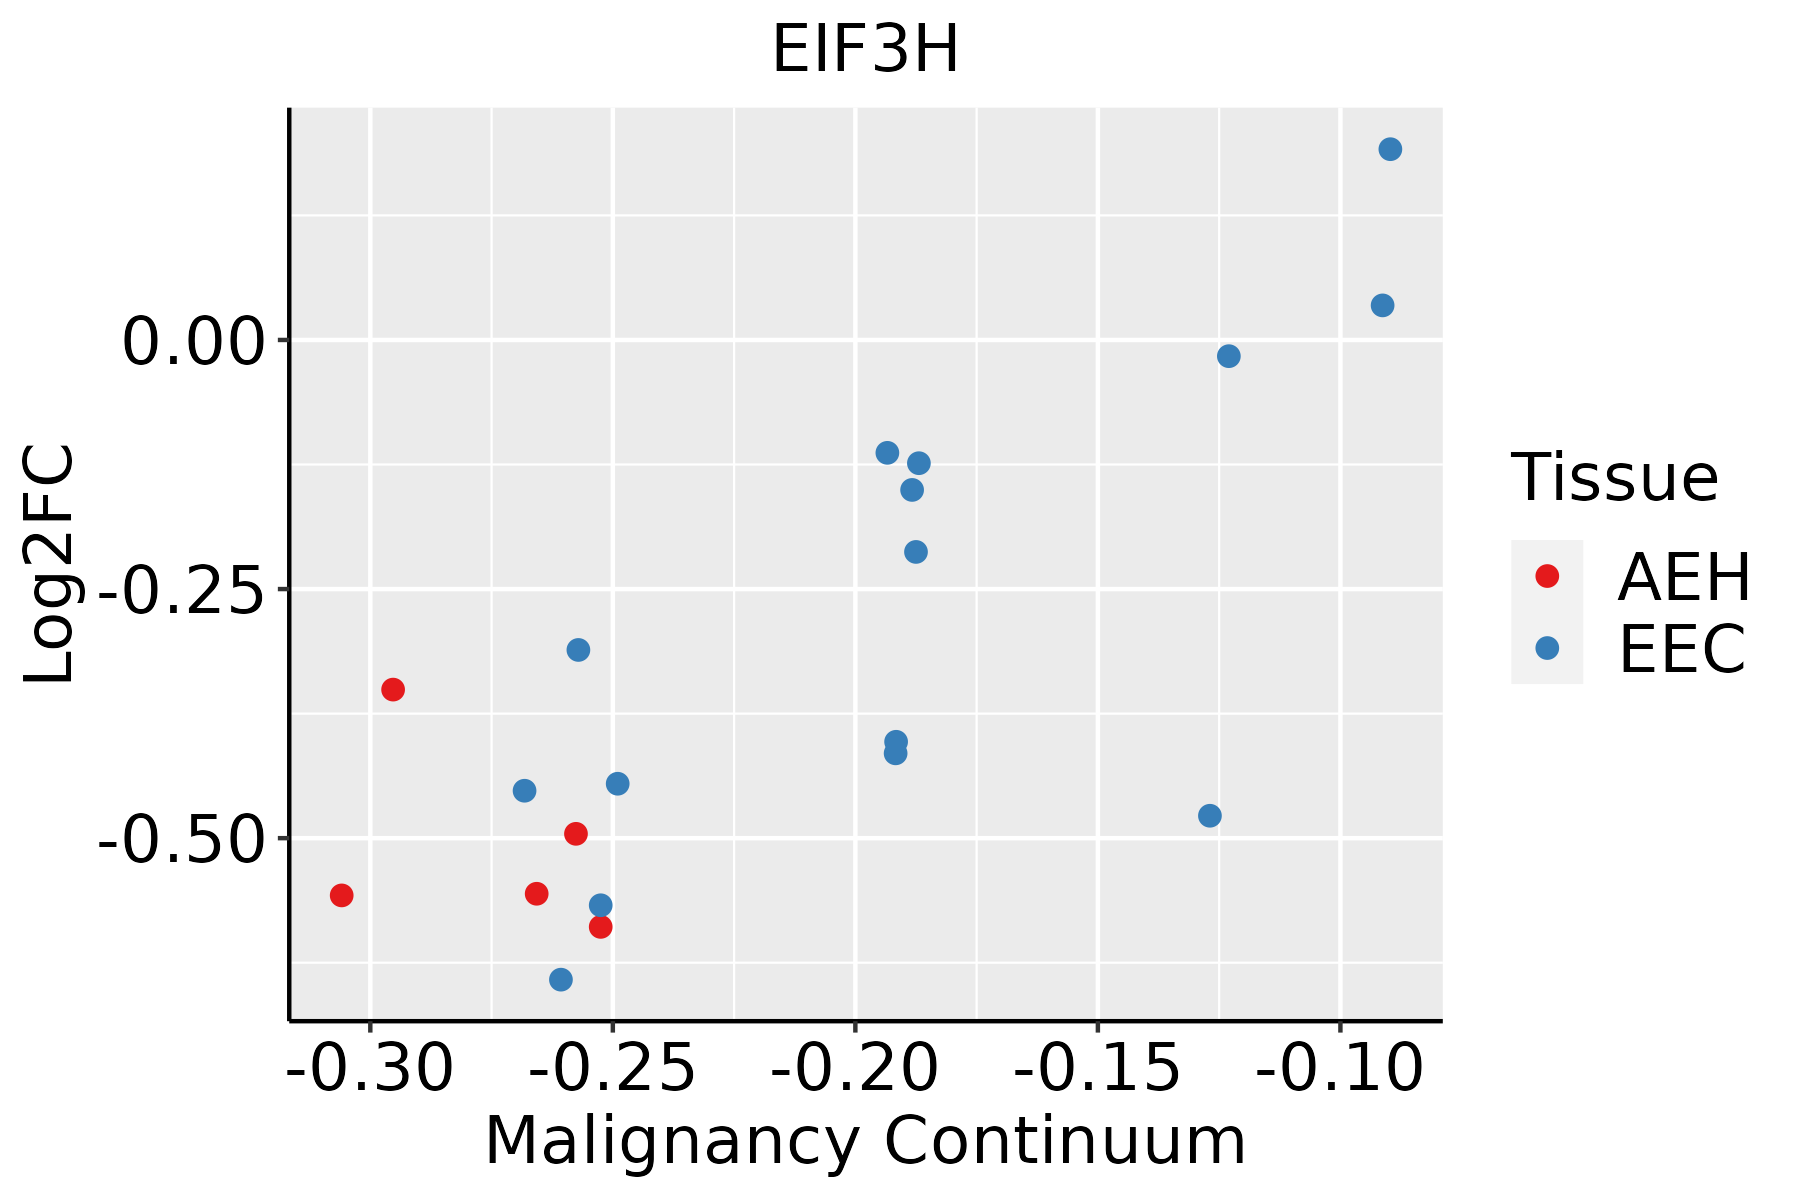 | AEH: Atypical endometrial hyperplasia |
| EEC: Endometrioid Cancer | ||
| Esophagus | 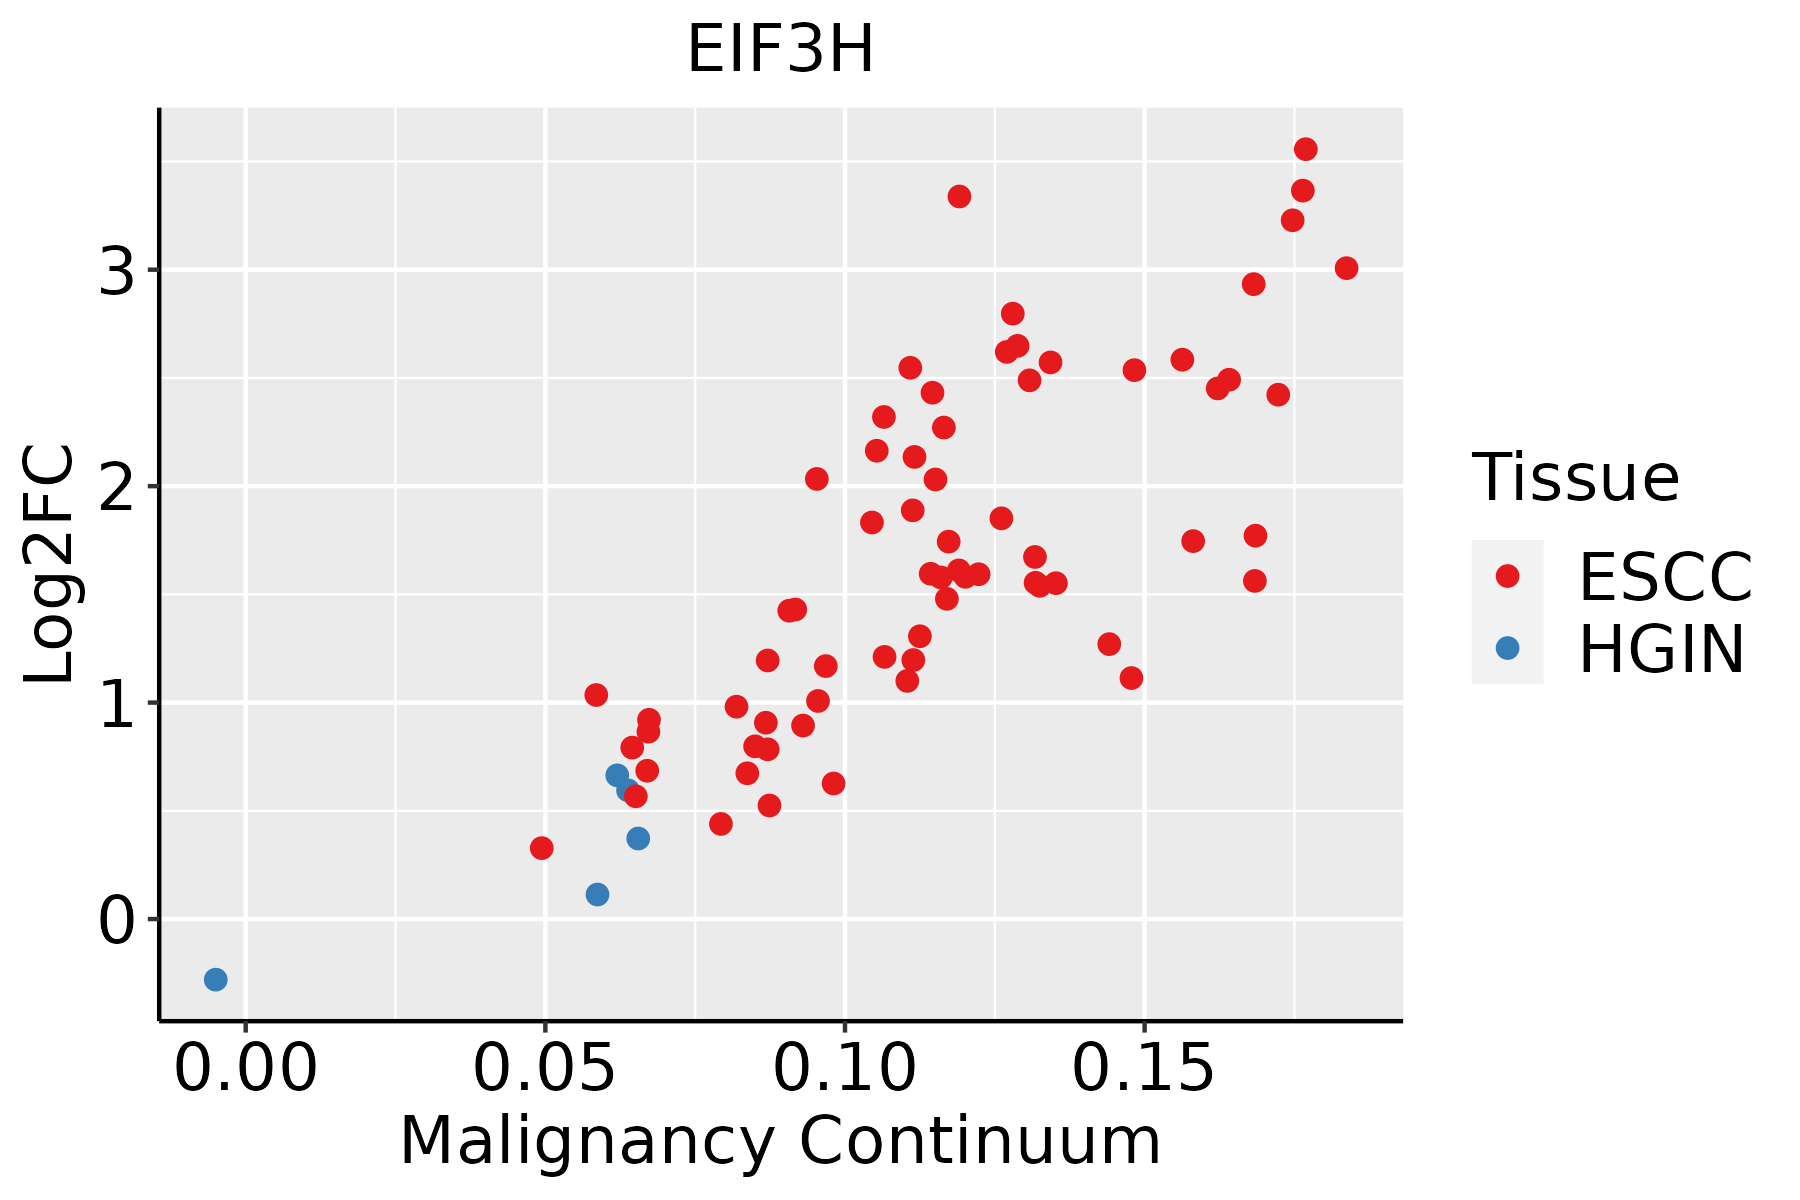 | ESCC: Esophageal squamous cell carcinoma |
| HGIN: High-grade intraepithelial neoplasias | ||
| LGIN: Low-grade intraepithelial neoplasias | ||
| Liver | 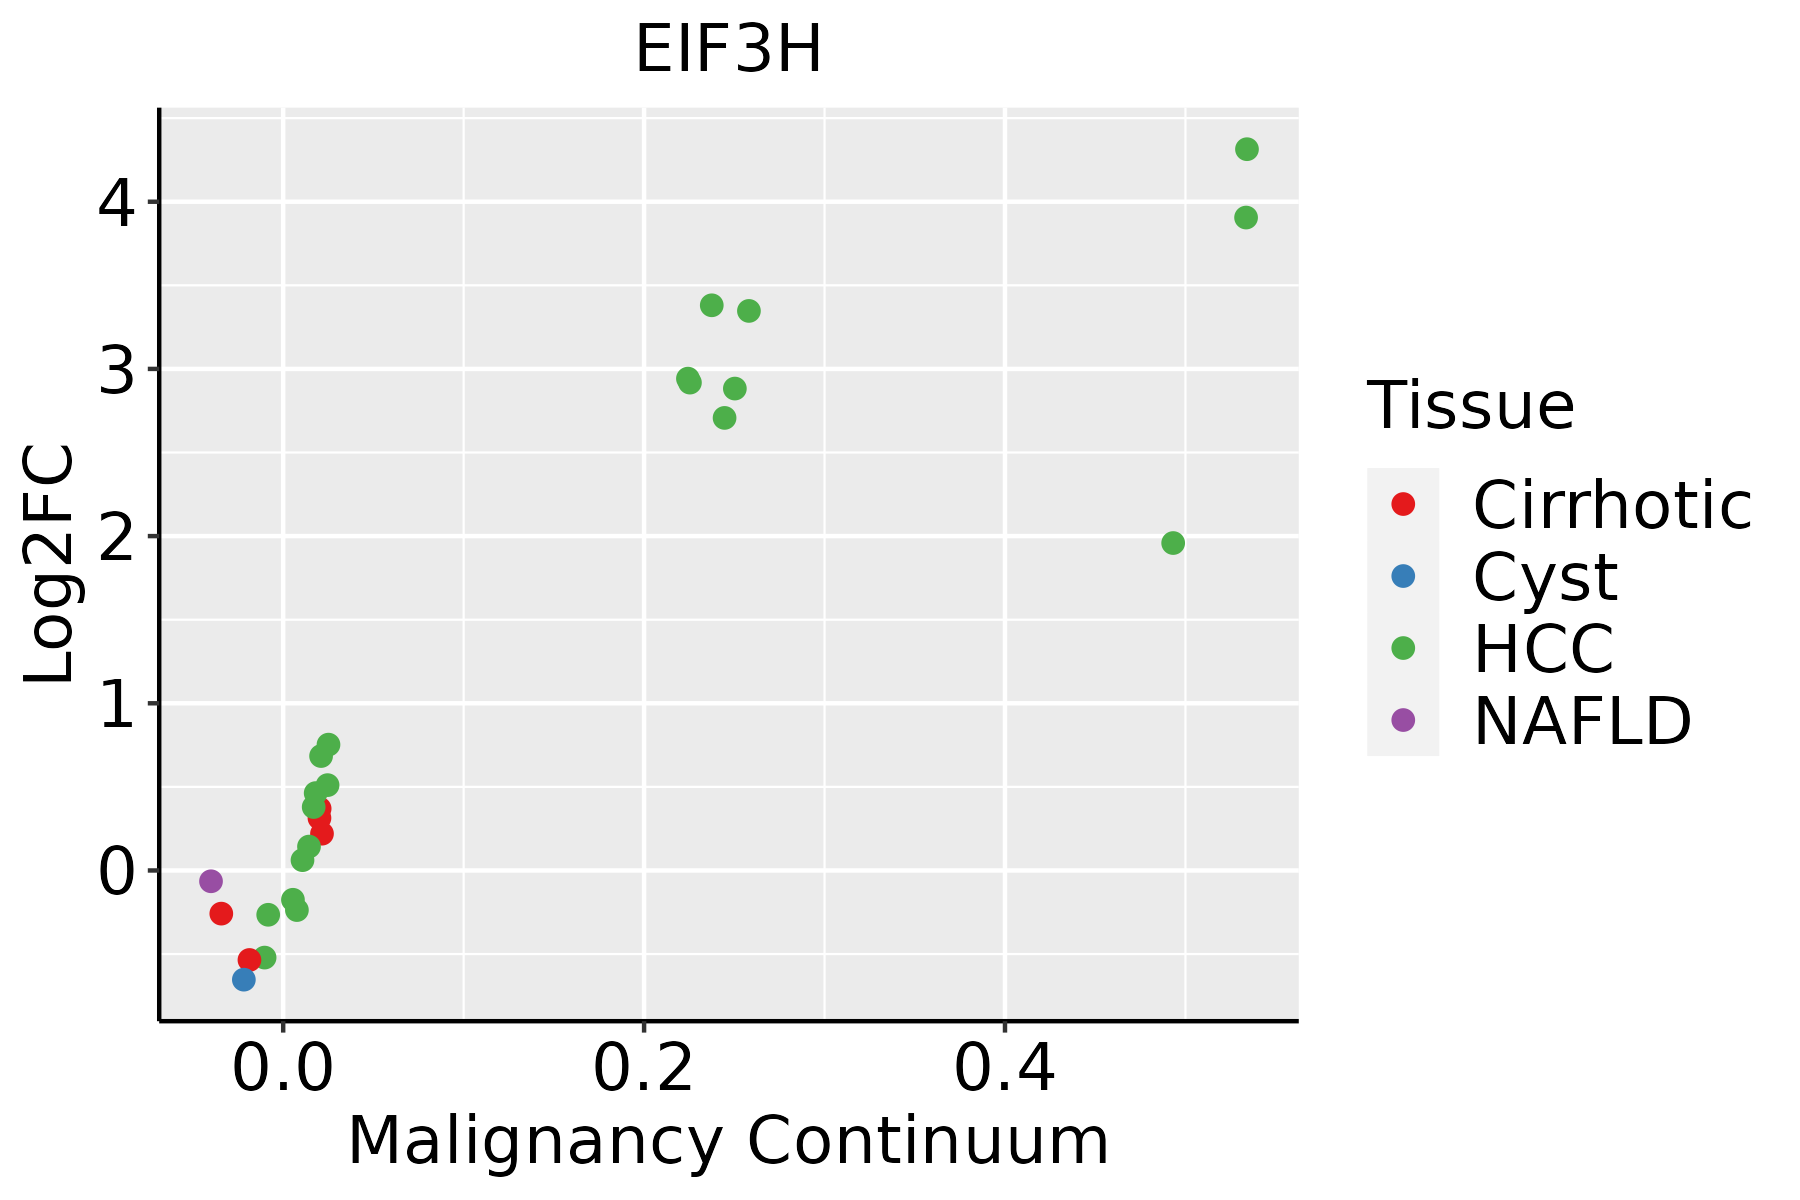 | HCC: Hepatocellular carcinoma |
| NAFLD: Non-alcoholic fatty liver disease | ||
| Oral Cavity | 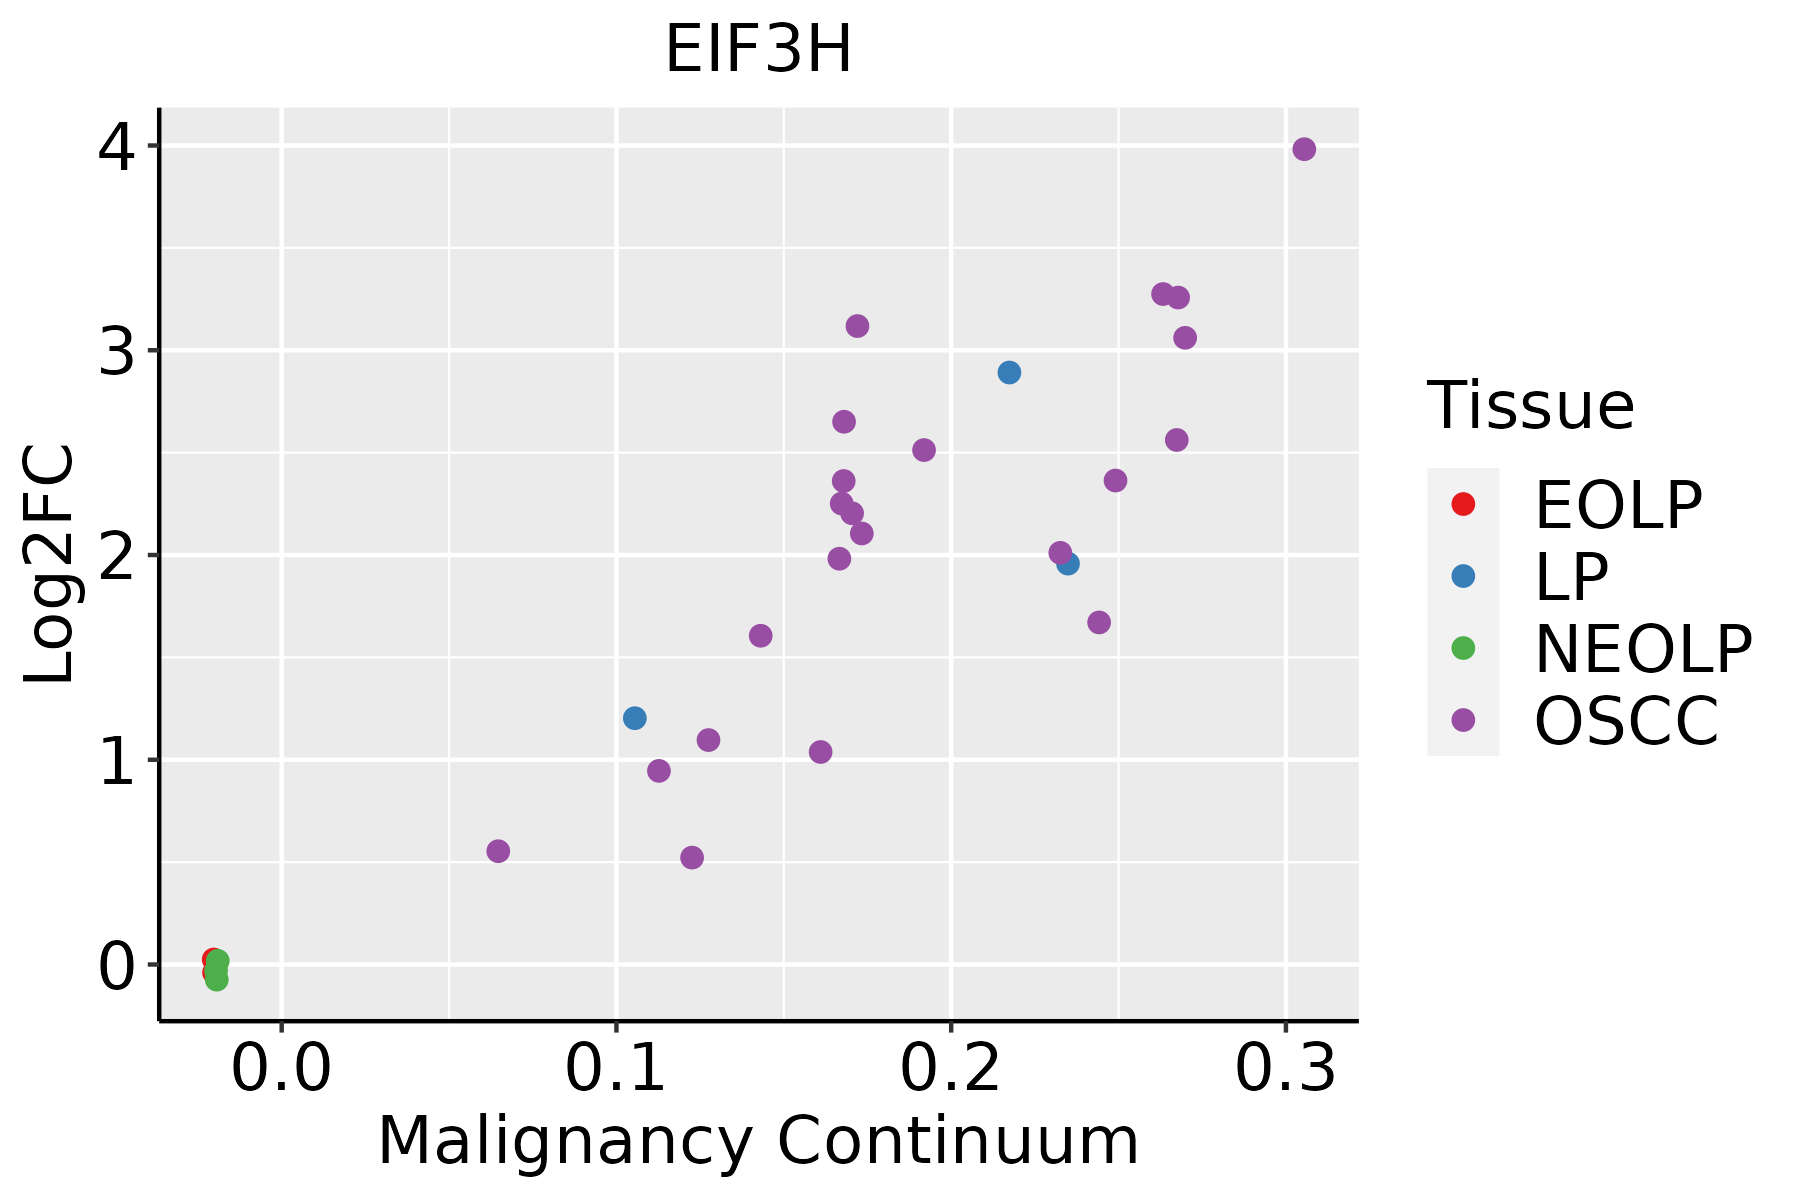 | EOLP: Erosive Oral lichen planus |
| LP: leukoplakia | ||
| NEOLP: Non-erosive oral lichen planus | ||
| OSCC: Oral squamous cell carcinoma | ||
| Prostate | 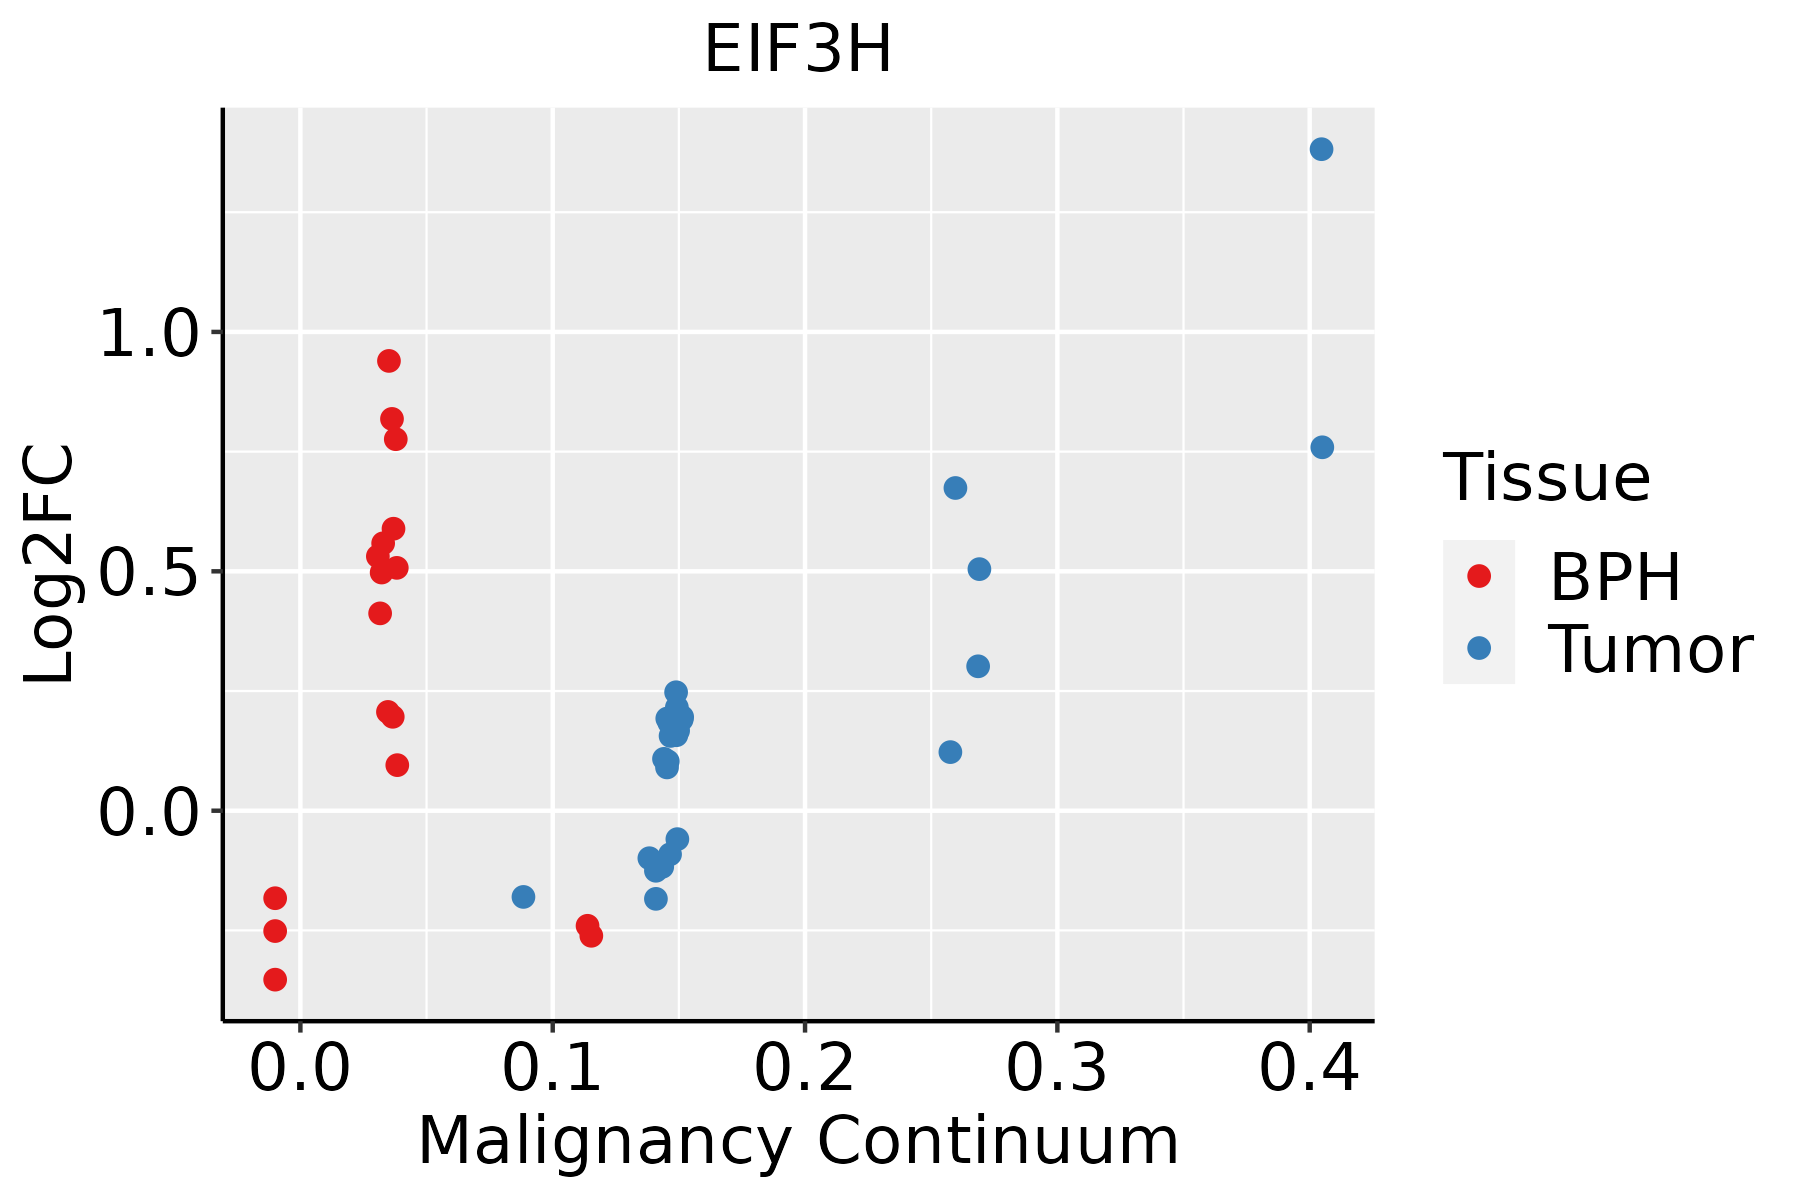 | BPH: Benign Prostatic Hyperplasia |
| Skin | 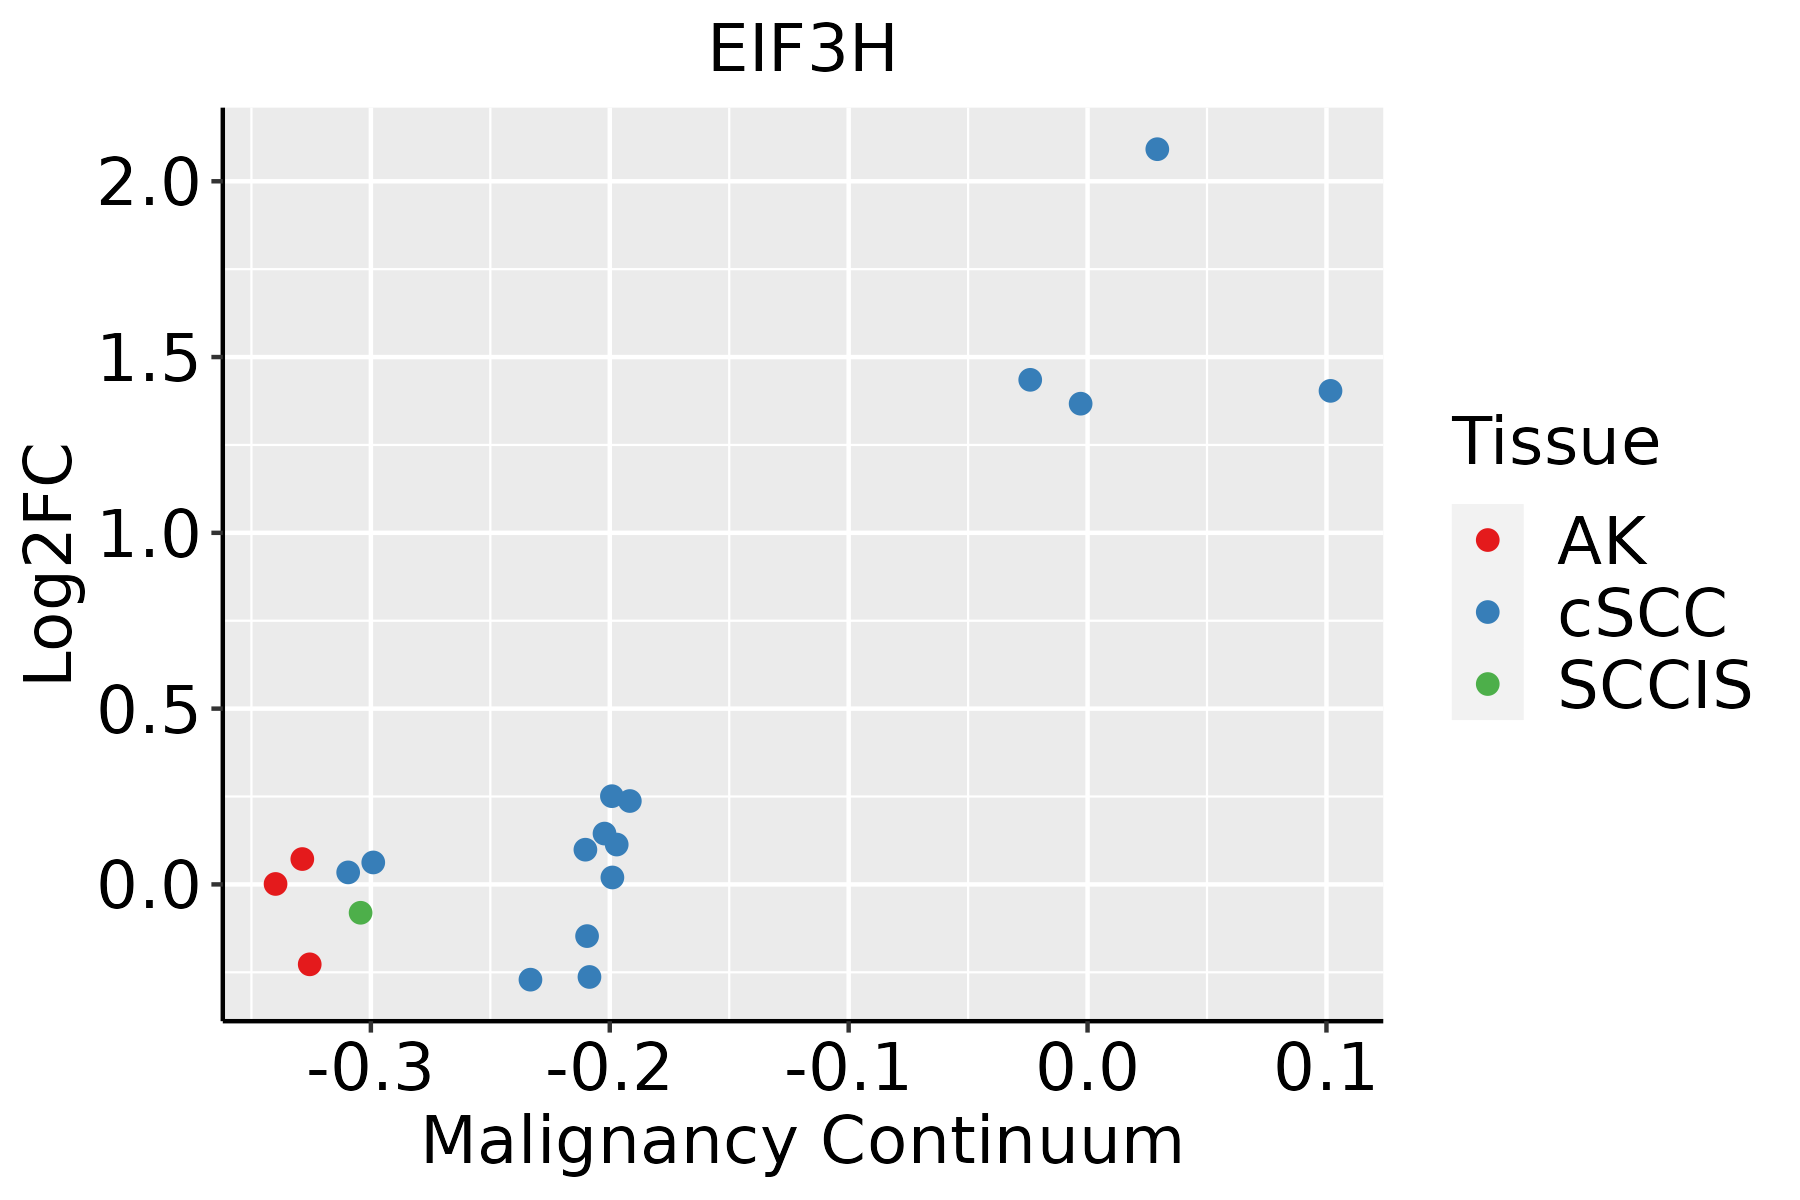 | AK: Actinic keratosis |
| cSCC: Cutaneous squamous cell carcinoma | ||
| SCCIS:squamous cell carcinoma in situ | ||
| Thyroid | 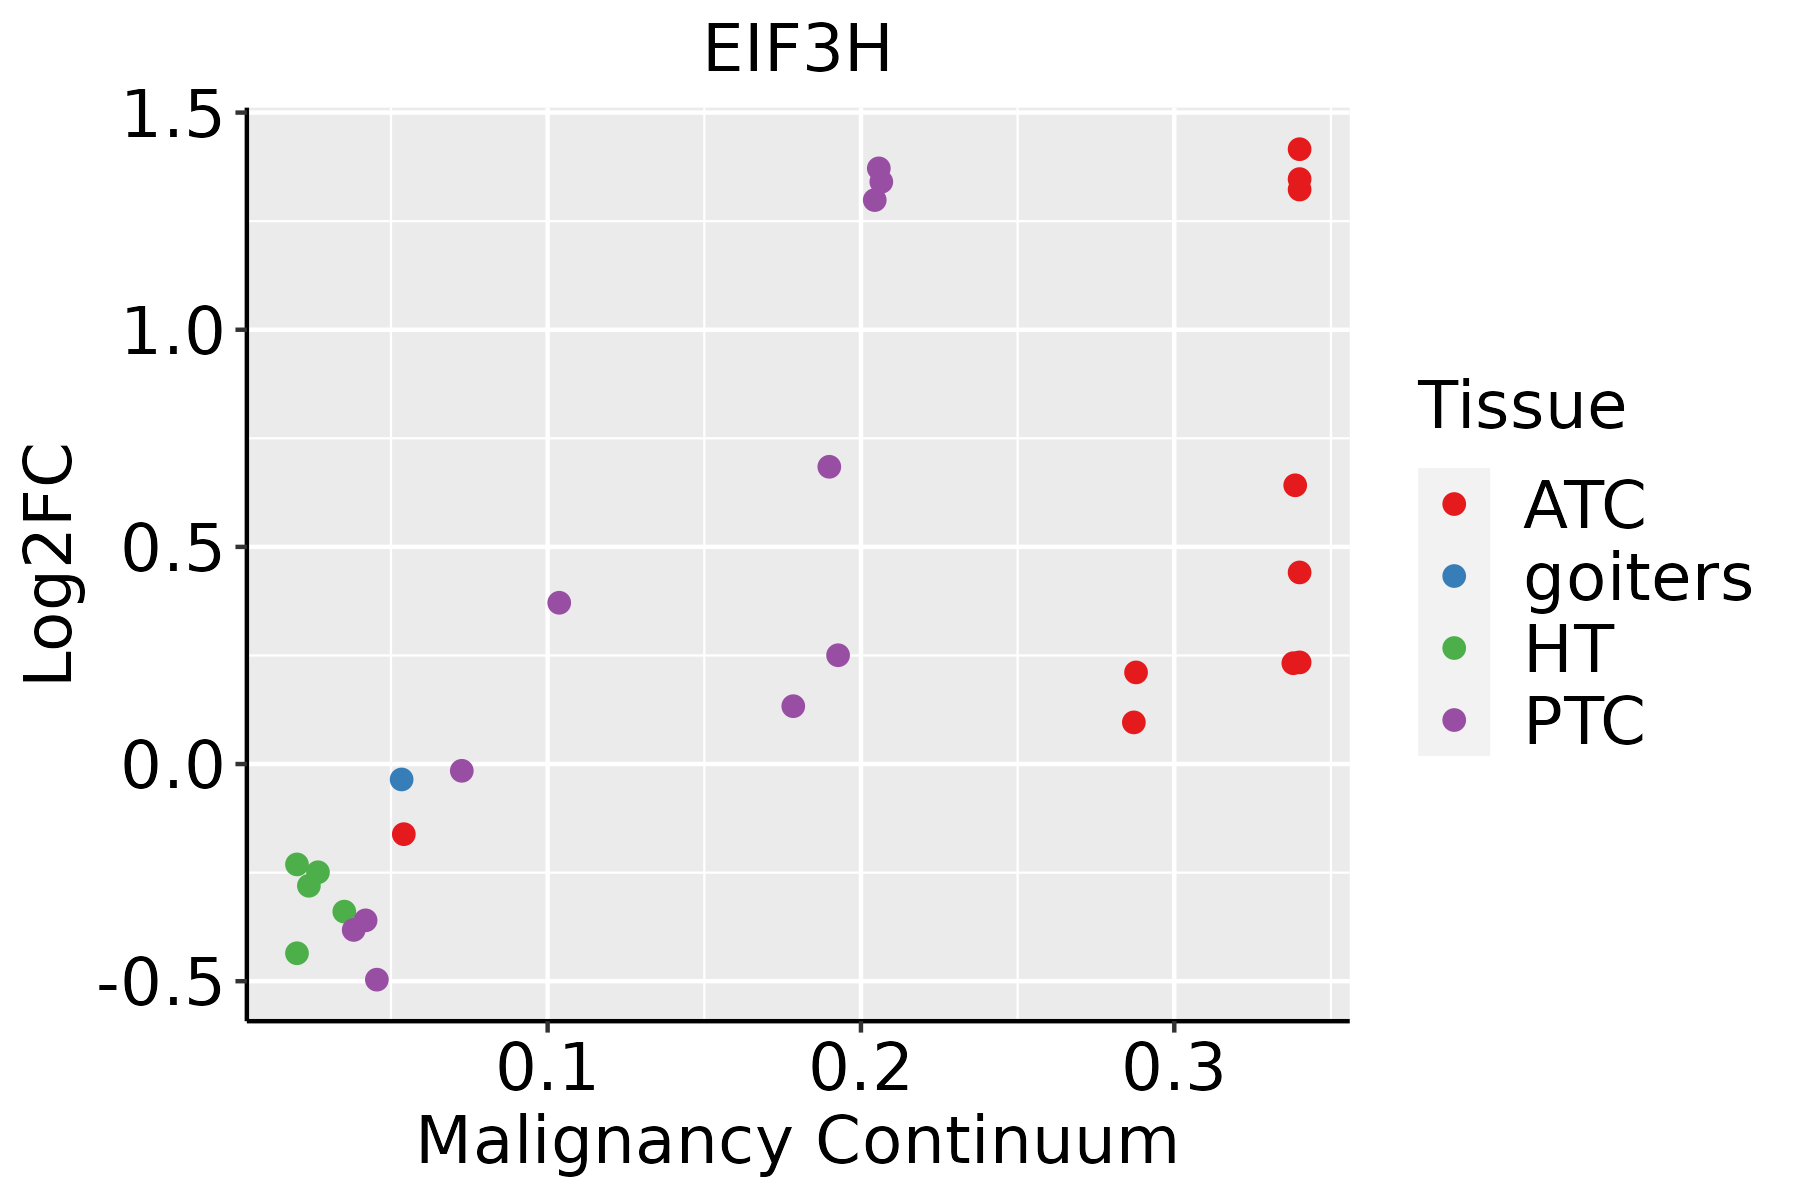 | ATC: Anaplastic thyroid cancer |
| HT: Hashimoto's thyroiditis | ||
| PTC: Papillary thyroid cancer |
| ∗log2FC in expression of this searched gene in stem-like cells from each diseased tissue sample relative to stem-like cells in normal samples in each tissue plotted against the malignancy continuum. Samples are colored based on if they are from different disease stage. |
Top |
Malignant transformation related pathway analysis |
| Find out the enriched GO biological processes and KEGG pathways involved in transition from healthy to precancer to cancer |
| Tissue | Disease Stage | Enriched GO biological Processes |
| Colorectum | AD |  |
| Colorectum | SER |  |
| Colorectum | MSS |  |
| Colorectum | MSI-H |  |
| Colorectum | FAP |  |
| ∗Top 15 enriched GO BP terms are showed in the bar plot of each disease state in each tissue. Each row represents a significant GO biological process which is colored according to the -log10(p.adjust). |
| Page: 1 2 3 4 5 6 7 8 9 |
| GO ID | Tissue | Disease Stage | Description | Gene Ratio | Bg Ratio | pvalue | p.adjust | Count |
| GO:000218114 | Breast | IDC | cytoplasmic translation | 82/1434 | 148/18723 | 2.60e-52 | 1.48e-48 | 82 |
| GO:004586114 | Breast | IDC | negative regulation of proteolysis | 70/1434 | 351/18723 | 8.21e-14 | 2.22e-11 | 70 |
| GO:002261314 | Breast | IDC | ribonucleoprotein complex biogenesis | 83/1434 | 463/18723 | 2.01e-13 | 5.20e-11 | 83 |
| GO:007182614 | Breast | IDC | ribonucleoprotein complex subunit organization | 52/1434 | 227/18723 | 5.18e-13 | 1.21e-10 | 52 |
| GO:002261814 | Breast | IDC | ribonucleoprotein complex assembly | 51/1434 | 220/18723 | 5.32e-13 | 1.21e-10 | 51 |
| GO:000641313 | Breast | IDC | translational initiation | 31/1434 | 118/18723 | 7.29e-10 | 7.52e-08 | 31 |
| GO:000641714 | Breast | IDC | regulation of translation | 74/1434 | 468/18723 | 1.67e-09 | 1.53e-07 | 74 |
| GO:001049814 | Breast | IDC | proteasomal protein catabolic process | 75/1434 | 490/18723 | 5.59e-09 | 4.41e-07 | 75 |
| GO:004217614 | Breast | IDC | regulation of protein catabolic process | 63/1434 | 391/18723 | 1.32e-08 | 9.61e-07 | 63 |
| GO:190336214 | Breast | IDC | regulation of cellular protein catabolic process | 46/1434 | 255/18723 | 4.00e-08 | 2.68e-06 | 46 |
| GO:190305014 | Breast | IDC | regulation of proteolysis involved in cellular protein catabolic process | 41/1434 | 221/18723 | 9.77e-08 | 5.84e-06 | 41 |
| GO:000644613 | Breast | IDC | regulation of translational initiation | 20/1434 | 79/18723 | 1.40e-06 | 6.00e-05 | 20 |
| GO:000218313 | Breast | IDC | cytoplasmic translational initiation | 12/1434 | 34/18723 | 4.35e-06 | 1.53e-04 | 12 |
| GO:006113614 | Breast | IDC | regulation of proteasomal protein catabolic process | 33/1434 | 187/18723 | 5.24e-06 | 1.75e-04 | 33 |
| GO:200005814 | Breast | IDC | regulation of ubiquitin-dependent protein catabolic process | 30/1434 | 164/18723 | 6.62e-06 | 2.05e-04 | 30 |
| GO:000173213 | Breast | IDC | formation of cytoplasmic translation initiation complex | 8/1434 | 16/18723 | 8.56e-06 | 2.47e-04 | 8 |
| GO:004316114 | Breast | IDC | proteasome-mediated ubiquitin-dependent protein catabolic process | 57/1434 | 412/18723 | 9.55e-06 | 2.68e-04 | 57 |
| GO:003243414 | Breast | IDC | regulation of proteasomal ubiquitin-dependent protein catabolic process | 24/1434 | 134/18723 | 7.59e-05 | 1.50e-03 | 24 |
| GO:003133014 | Breast | IDC | negative regulation of cellular catabolic process | 37/1434 | 262/18723 | 2.20e-04 | 3.52e-03 | 37 |
| GO:190336313 | Breast | IDC | negative regulation of cellular protein catabolic process | 15/1434 | 75/18723 | 4.86e-04 | 6.42e-03 | 15 |
| Page: 1 2 3 4 5 6 7 8 9 10 11 12 13 14 15 16 17 18 19 20 21 22 23 24 25 26 27 28 29 30 31 32 33 34 |
| Pathway ID | Tissue | Disease Stage | Description | Gene Ratio | Bg Ratio | pvalue | p.adjust | qvalue | Count |
| hsa051629 | Esophagus | ESCC | Measles | 90/4205 | 139/8465 | 2.16e-04 | 7.87e-04 | 4.03e-04 | 90 |
| hsa0516213 | Esophagus | ESCC | Measles | 90/4205 | 139/8465 | 2.16e-04 | 7.87e-04 | 4.03e-04 | 90 |
| hsa051628 | Oral cavity | OSCC | Measles | 90/3704 | 139/8465 | 4.10e-07 | 2.50e-06 | 1.27e-06 | 90 |
| hsa0516212 | Oral cavity | OSCC | Measles | 90/3704 | 139/8465 | 4.10e-07 | 2.50e-06 | 1.27e-06 | 90 |
| hsa0516221 | Oral cavity | LP | Measles | 59/2418 | 139/8465 | 2.90e-04 | 1.60e-03 | 1.03e-03 | 59 |
| hsa0516231 | Oral cavity | LP | Measles | 59/2418 | 139/8465 | 2.90e-04 | 1.60e-03 | 1.03e-03 | 59 |
| hsa0516241 | Oral cavity | EOLP | Measles | 42/1218 | 139/8465 | 1.11e-06 | 9.96e-06 | 5.87e-06 | 42 |
| hsa051625 | Oral cavity | EOLP | Measles | 42/1218 | 139/8465 | 1.11e-06 | 9.96e-06 | 5.87e-06 | 42 |
| hsa051626 | Oral cavity | NEOLP | Measles | 35/1112 | 139/8465 | 8.30e-05 | 6.14e-04 | 3.86e-04 | 35 |
| hsa051627 | Oral cavity | NEOLP | Measles | 35/1112 | 139/8465 | 8.30e-05 | 6.14e-04 | 3.86e-04 | 35 |
| hsa051624 | Prostate | BPH | Measles | 42/1718 | 139/8465 | 3.35e-03 | 1.23e-02 | 7.61e-03 | 42 |
| hsa0516211 | Prostate | BPH | Measles | 42/1718 | 139/8465 | 3.35e-03 | 1.23e-02 | 7.61e-03 | 42 |
| hsa051622 | Prostate | Tumor | Measles | 44/1791 | 139/8465 | 2.33e-03 | 8.85e-03 | 5.49e-03 | 44 |
| hsa051623 | Prostate | Tumor | Measles | 44/1791 | 139/8465 | 2.33e-03 | 8.85e-03 | 5.49e-03 | 44 |
| Page: 1 |
Top |
Cell-cell communication analysis |
| Identification of potential cell-cell interactions between two cell types and their ligand-receptor pairs for different disease states |
| Ligand | Receptor | LRpair | Pathway | Tissue | Disease Stage |
| Page: 1 |
Top |
Single-cell gene regulatory network inference analysis |
| Find out the significant the regulons (TFs) and the target genes of each regulon across cell types for different disease states |
| TF | Cell Type | Tissue | Disease Stage | Target Gene | RSS | Regulon Activity |
| ∗The dot plots of a searched regulon are shown for all cell subpopulations in each disease state of each tissue based on the regulon specific score inferred using pySCENIC and by calculating the average expression. |
| Page: 1 |
Top |
Somatic mutation of malignant transformation related genes |
| Annotation of somatic variants for genes involved in malignant transformation |
| Hugo Symbol | Variant Class | Variant Classification | dbSNP RS | HGVSc | HGVSp | HGVSp Short | SWISSPROT | BIOTYPE | SIFT | PolyPhen | Tumor Sample Barcode | Tissue | Histology | Sex | Age | Stage | Therapy Types | Drugs | Outcome |
| EIF3H | SNV | Missense_Mutation | rs765673805 | c.947N>T | p.Ser316Leu | p.S316L | O15372 | protein_coding | deleterious(0.02) | benign(0.062) | TCGA-2W-A8YY-01 | Cervix | cervical & endocervical cancer | Female | <65 | I/II | Chemotherapy | cisplatin | CR |
| EIF3H | SNV | Missense_Mutation | c.685N>A | p.Glu229Lys | p.E229K | O15372 | protein_coding | tolerated(0.27) | benign(0.095) | TCGA-EA-A50E-01 | Cervix | cervical & endocervical cancer | Female | <65 | I/II | Unknown | Unknown | PD | |
| EIF3H | SNV | Missense_Mutation | novel | c.150N>G | p.Ile50Met | p.I50M | O15372 | protein_coding | deleterious(0) | probably_damaging(0.981) | TCGA-HM-A4S6-01 | Cervix | cervical & endocervical cancer | Female | <65 | III/IV | Chemotherapy | cisplatin | CR |
| EIF3H | SNV | Missense_Mutation | c.101N>T | p.Ser34Leu | p.S34L | O15372 | protein_coding | tolerated(0.05) | benign(0.034) | TCGA-IR-A3LA-01 | Cervix | cervical & endocervical cancer | Female | <65 | I/II | Chemotherapy | cisplatin | CR | |
| EIF3H | SNV | Missense_Mutation | rs776462055 | c.550C>A | p.Pro184Thr | p.P184T | O15372 | protein_coding | tolerated(0.22) | benign(0.039) | TCGA-AA-3845-01 | Colorectum | colon adenocarcinoma | Female | >=65 | I/II | Unknown | Unknown | PD |
| EIF3H | SNV | Missense_Mutation | novel | c.766N>A | p.Asp256Asn | p.D256N | O15372 | protein_coding | deleterious(0) | benign(0.042) | TCGA-AA-3984-01 | Colorectum | colon adenocarcinoma | Female | <65 | I/II | Unknown | Unknown | SD |
| EIF3H | SNV | Missense_Mutation | novel | c.7N>C | p.Ser3Pro | p.S3P | O15372 | protein_coding | deleterious_low_confidence(0.01) | benign(0.027) | TCGA-AA-A01R-01 | Colorectum | colon adenocarcinoma | Male | <65 | III/IV | Chemotherapy | 5-fluorouracil | PD |
| EIF3H | SNV | Missense_Mutation | c.85N>T | p.Gly29Cys | p.G29C | O15372 | protein_coding | deleterious(0.02) | probably_damaging(0.979) | TCGA-D5-6928-01 | Colorectum | colon adenocarcinoma | Male | >=65 | I/II | Unknown | Unknown | SD | |
| EIF3H | SNV | Missense_Mutation | c.314N>A | p.Arg105Gln | p.R105Q | O15372 | protein_coding | deleterious(0.03) | benign(0.266) | TCGA-AG-A002-01 | Colorectum | rectum adenocarcinoma | Male | <65 | I/II | Unknown | Unknown | SD | |
| EIF3H | SNV | Missense_Mutation | rs367787019 | c.340N>T | p.His114Tyr | p.H114Y | O15372 | protein_coding | deleterious(0) | probably_damaging(0.998) | TCGA-AG-A023-01 | Colorectum | rectum adenocarcinoma | Female | <65 | III/IV | Unknown | Unknown | PD |
| Page: 1 2 3 4 |
Top |
Related drugs of malignant transformation related genes |
| Identification of chemicals and drugs interact with genes involved in malignant transfromation |
| (DGIdb 4.0) |
| Entrez ID | Symbol | Category | Interaction Types | Drug Claim Name | Drug Name | PMIDs |
| Page: 1 |

Copyright 2023-Present -The University of Texas Health Science Center at Houston |