
|
|||||
|
 | |
| |
| |
| |
| |
| |
|
Gene: DSTN |
Gene summary for DSTN |
| Gene information | Species | Human | Gene symbol | DSTN | Gene ID | 11034 |
| Gene name | destrin, actin depolymerizing factor | |
| Gene Alias | ACTDP | |
| Cytomap | 20p12.1 | |
| Gene Type | protein-coding | GO ID | GO:0006928 | UniProtAcc | P60981 |
Top |
Malignant transformation analysis |
| Identification of the aberrant gene expression in precancerous and cancerous lesions by comparing the gene expression of stem-like cells in diseased tissues with normal stem cells |
| Entrez ID | Symbol | Replicates | Species | Organ | Tissue | Adj P-value | Log2FC | Malignancy |
| 11034 | DSTN | P5T-E | Human | Esophagus | ESCC | 2.15e-63 | 1.83e+00 | 0.1327 |
| 11034 | DSTN | P8T-E | Human | Esophagus | ESCC | 1.50e-37 | 1.31e+00 | 0.0889 |
| 11034 | DSTN | P9T-E | Human | Esophagus | ESCC | 8.13e-39 | 1.65e+00 | 0.1131 |
| 11034 | DSTN | P10T-E | Human | Esophagus | ESCC | 5.96e-58 | 1.68e+00 | 0.116 |
| 11034 | DSTN | P11T-E | Human | Esophagus | ESCC | 3.34e-16 | 1.33e+00 | 0.1426 |
| 11034 | DSTN | P12T-E | Human | Esophagus | ESCC | 9.60e-59 | 1.77e+00 | 0.1122 |
| 11034 | DSTN | P15T-E | Human | Esophagus | ESCC | 3.87e-49 | 1.82e+00 | 0.1149 |
| 11034 | DSTN | P16T-E | Human | Esophagus | ESCC | 3.06e-38 | 1.24e+00 | 0.1153 |
| 11034 | DSTN | P17T-E | Human | Esophagus | ESCC | 1.86e-24 | 2.28e+00 | 0.1278 |
| 11034 | DSTN | P19T-E | Human | Esophagus | ESCC | 3.92e-10 | 1.99e+00 | 0.1662 |
| 11034 | DSTN | P20T-E | Human | Esophagus | ESCC | 4.63e-48 | 1.67e+00 | 0.1124 |
| 11034 | DSTN | P21T-E | Human | Esophagus | ESCC | 2.65e-82 | 3.19e+00 | 0.1617 |
| 11034 | DSTN | P22T-E | Human | Esophagus | ESCC | 4.23e-65 | 1.64e+00 | 0.1236 |
| 11034 | DSTN | P23T-E | Human | Esophagus | ESCC | 2.19e-67 | 2.81e+00 | 0.108 |
| 11034 | DSTN | P24T-E | Human | Esophagus | ESCC | 2.93e-48 | 1.77e+00 | 0.1287 |
| 11034 | DSTN | P26T-E | Human | Esophagus | ESCC | 2.10e-97 | 2.65e+00 | 0.1276 |
| 11034 | DSTN | P27T-E | Human | Esophagus | ESCC | 5.62e-20 | 8.41e-01 | 0.1055 |
| 11034 | DSTN | P28T-E | Human | Esophagus | ESCC | 1.32e-54 | 1.65e+00 | 0.1149 |
| 11034 | DSTN | P30T-E | Human | Esophagus | ESCC | 4.43e-50 | 2.35e+00 | 0.137 |
| 11034 | DSTN | P31T-E | Human | Esophagus | ESCC | 3.01e-74 | 2.35e+00 | 0.1251 |
| Page: 1 2 3 4 5 6 7 8 9 10 11 12 13 14 |
| Tissue | Expression Dynamics | Abbreviation |
| Breast |  | IDC: Invasive ductal carcinoma |
| DCIS: Ductal carcinoma in situ | ||
| Precancer(BRCA1-mut): Precancerous lesion from BRCA1 mutation carriers | ||
| Colorectum (GSE201348) |  | FAP: Familial adenomatous polyposis |
| CRC: Colorectal cancer | ||
| Colorectum (HTA11) | 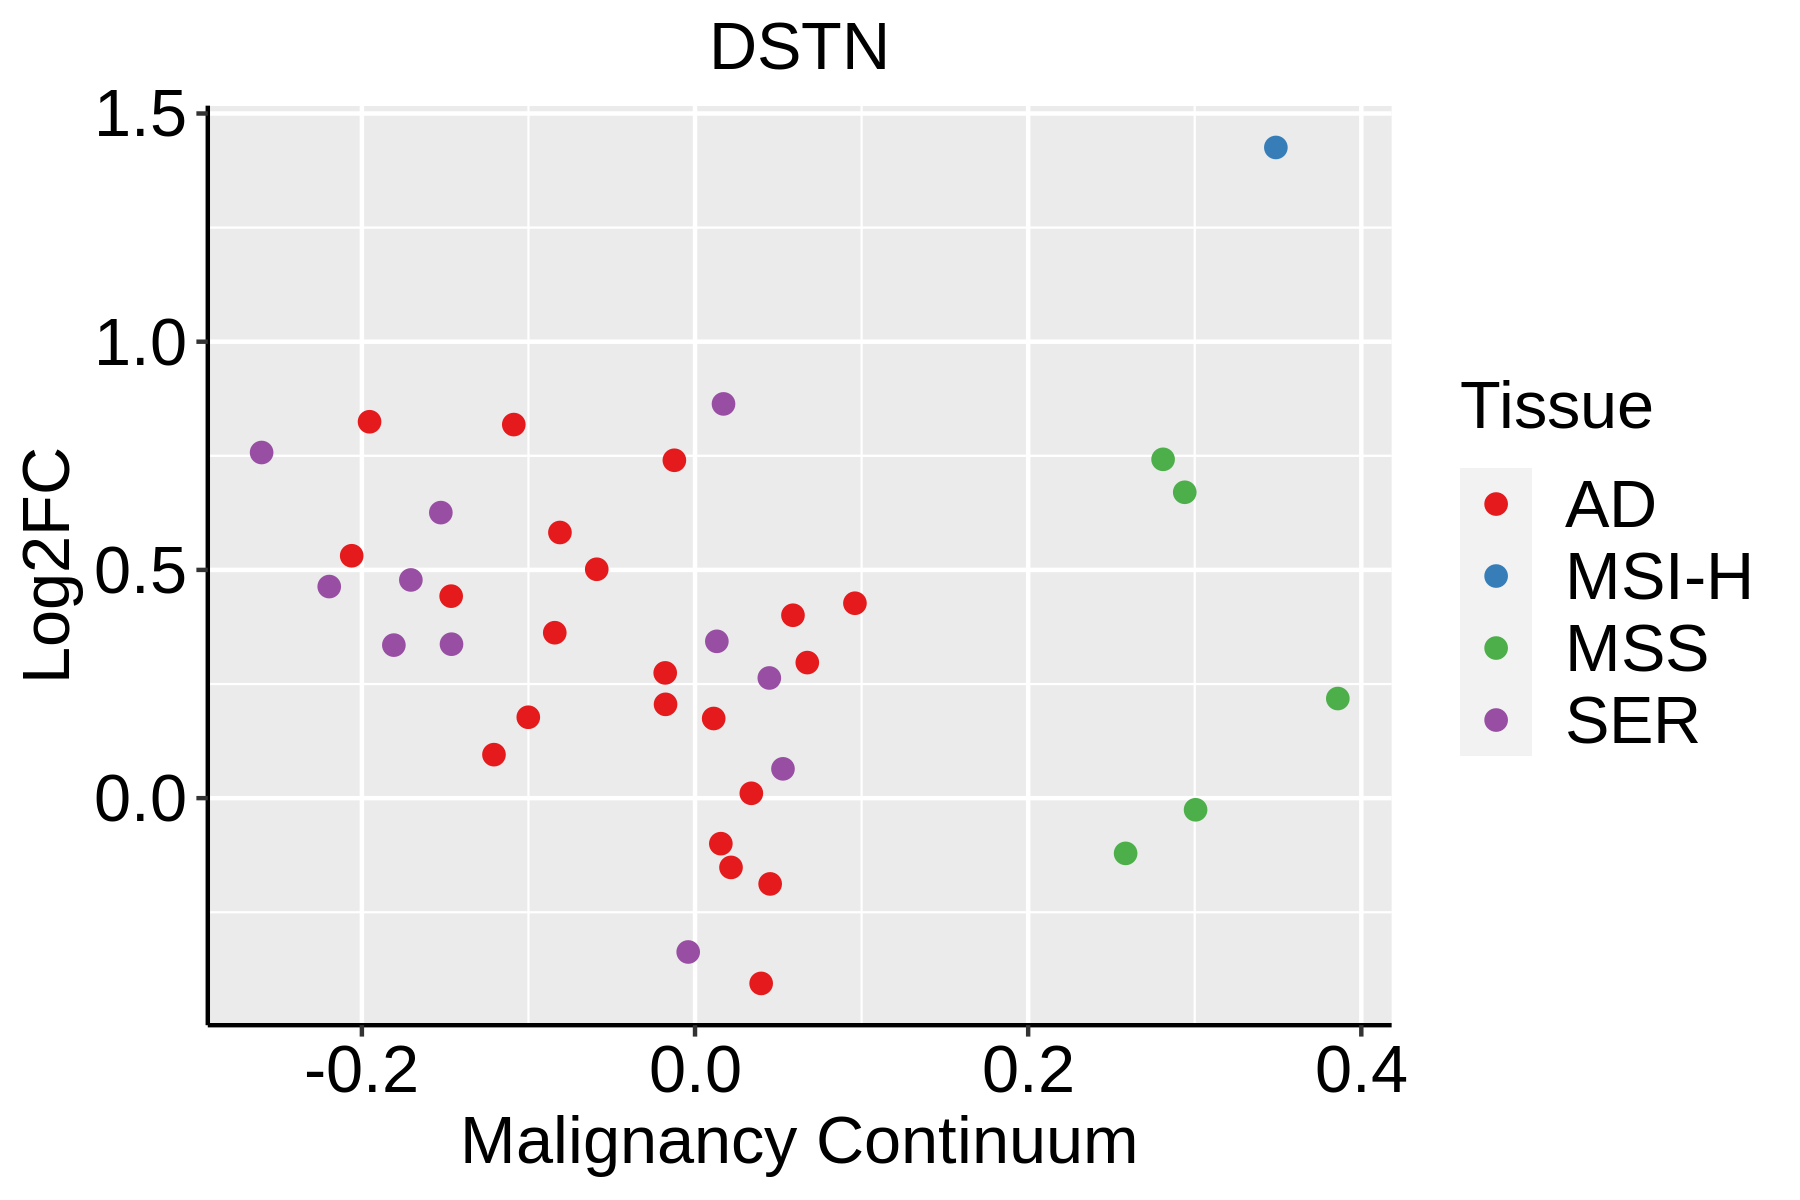 | AD: Adenomas |
| SER: Sessile serrated lesions | ||
| MSI-H: Microsatellite-high colorectal cancer | ||
| MSS: Microsatellite stable colorectal cancer | ||
| Endometrium | 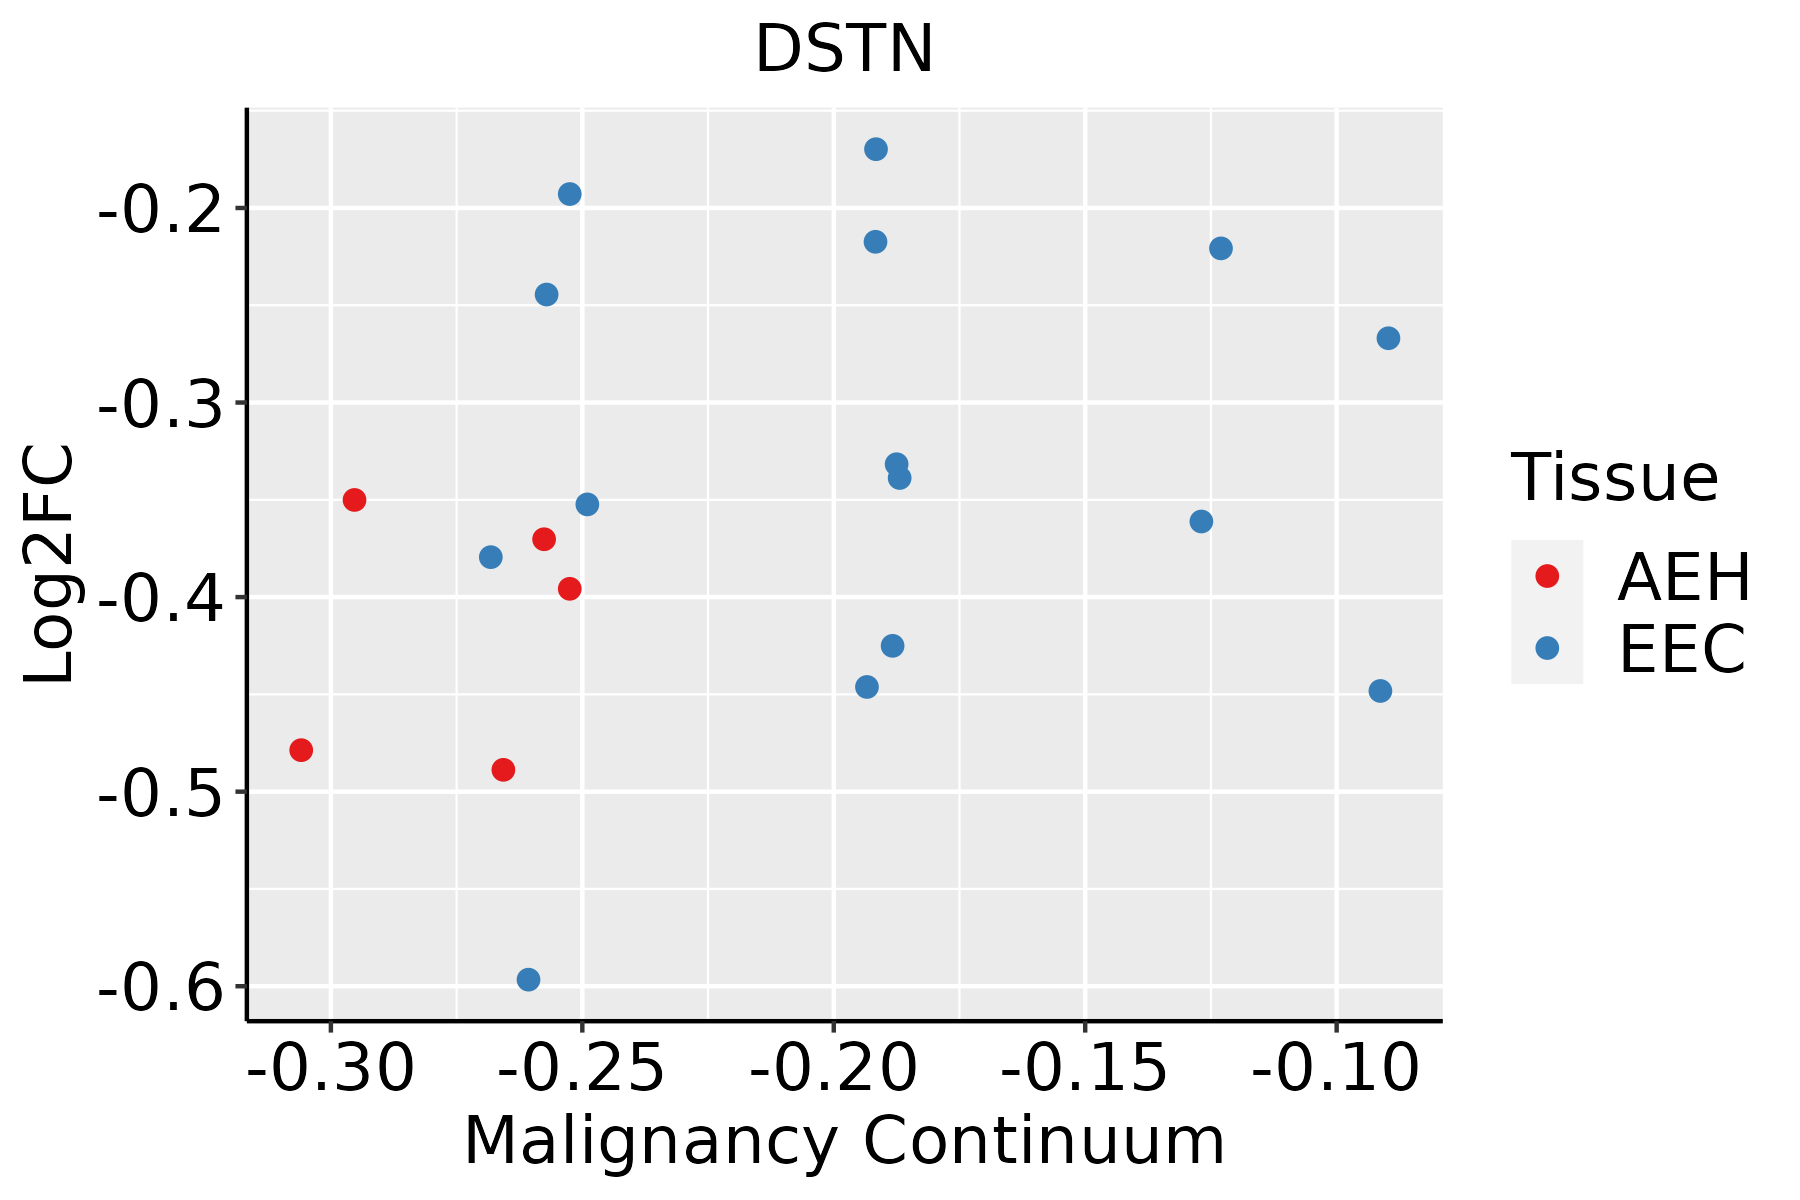 | AEH: Atypical endometrial hyperplasia |
| EEC: Endometrioid Cancer | ||
| Esophagus | 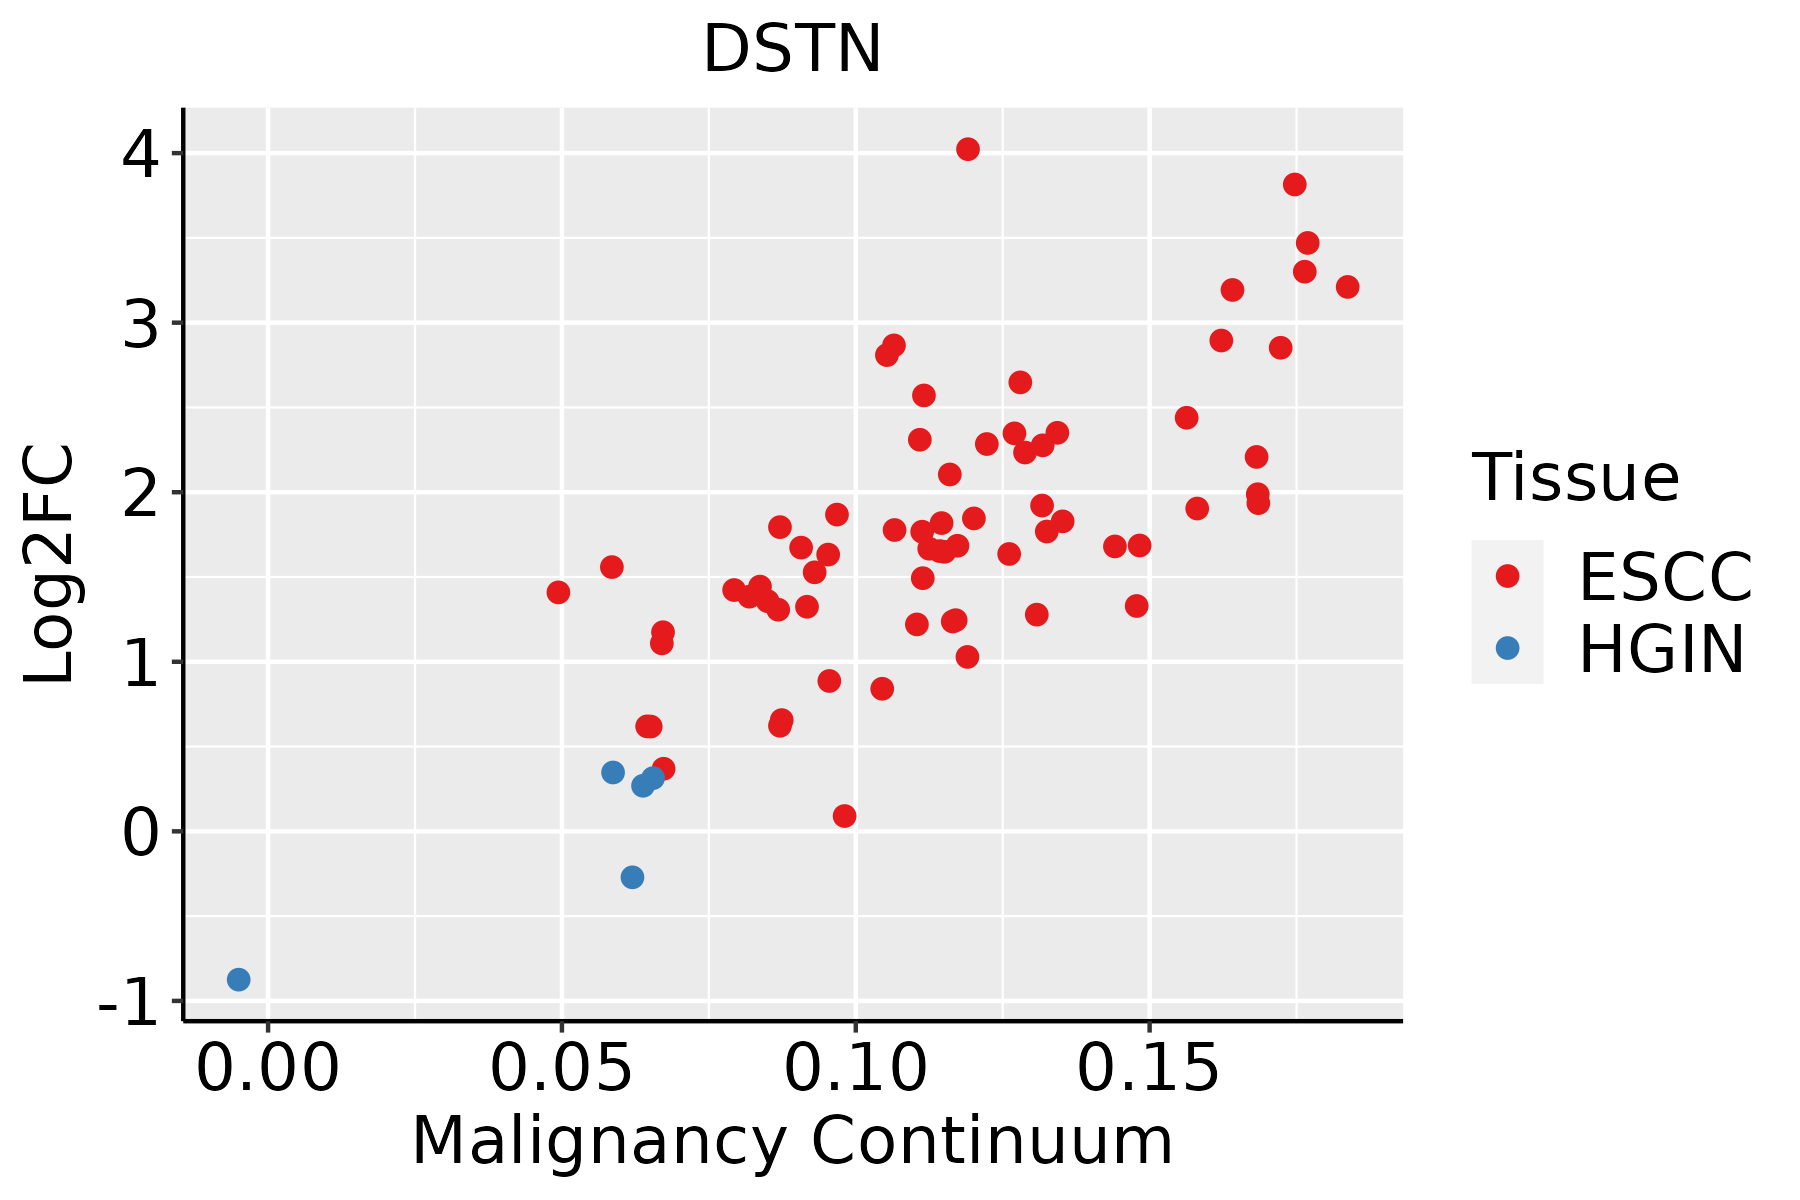 | ESCC: Esophageal squamous cell carcinoma |
| HGIN: High-grade intraepithelial neoplasias | ||
| LGIN: Low-grade intraepithelial neoplasias | ||
| Liver | 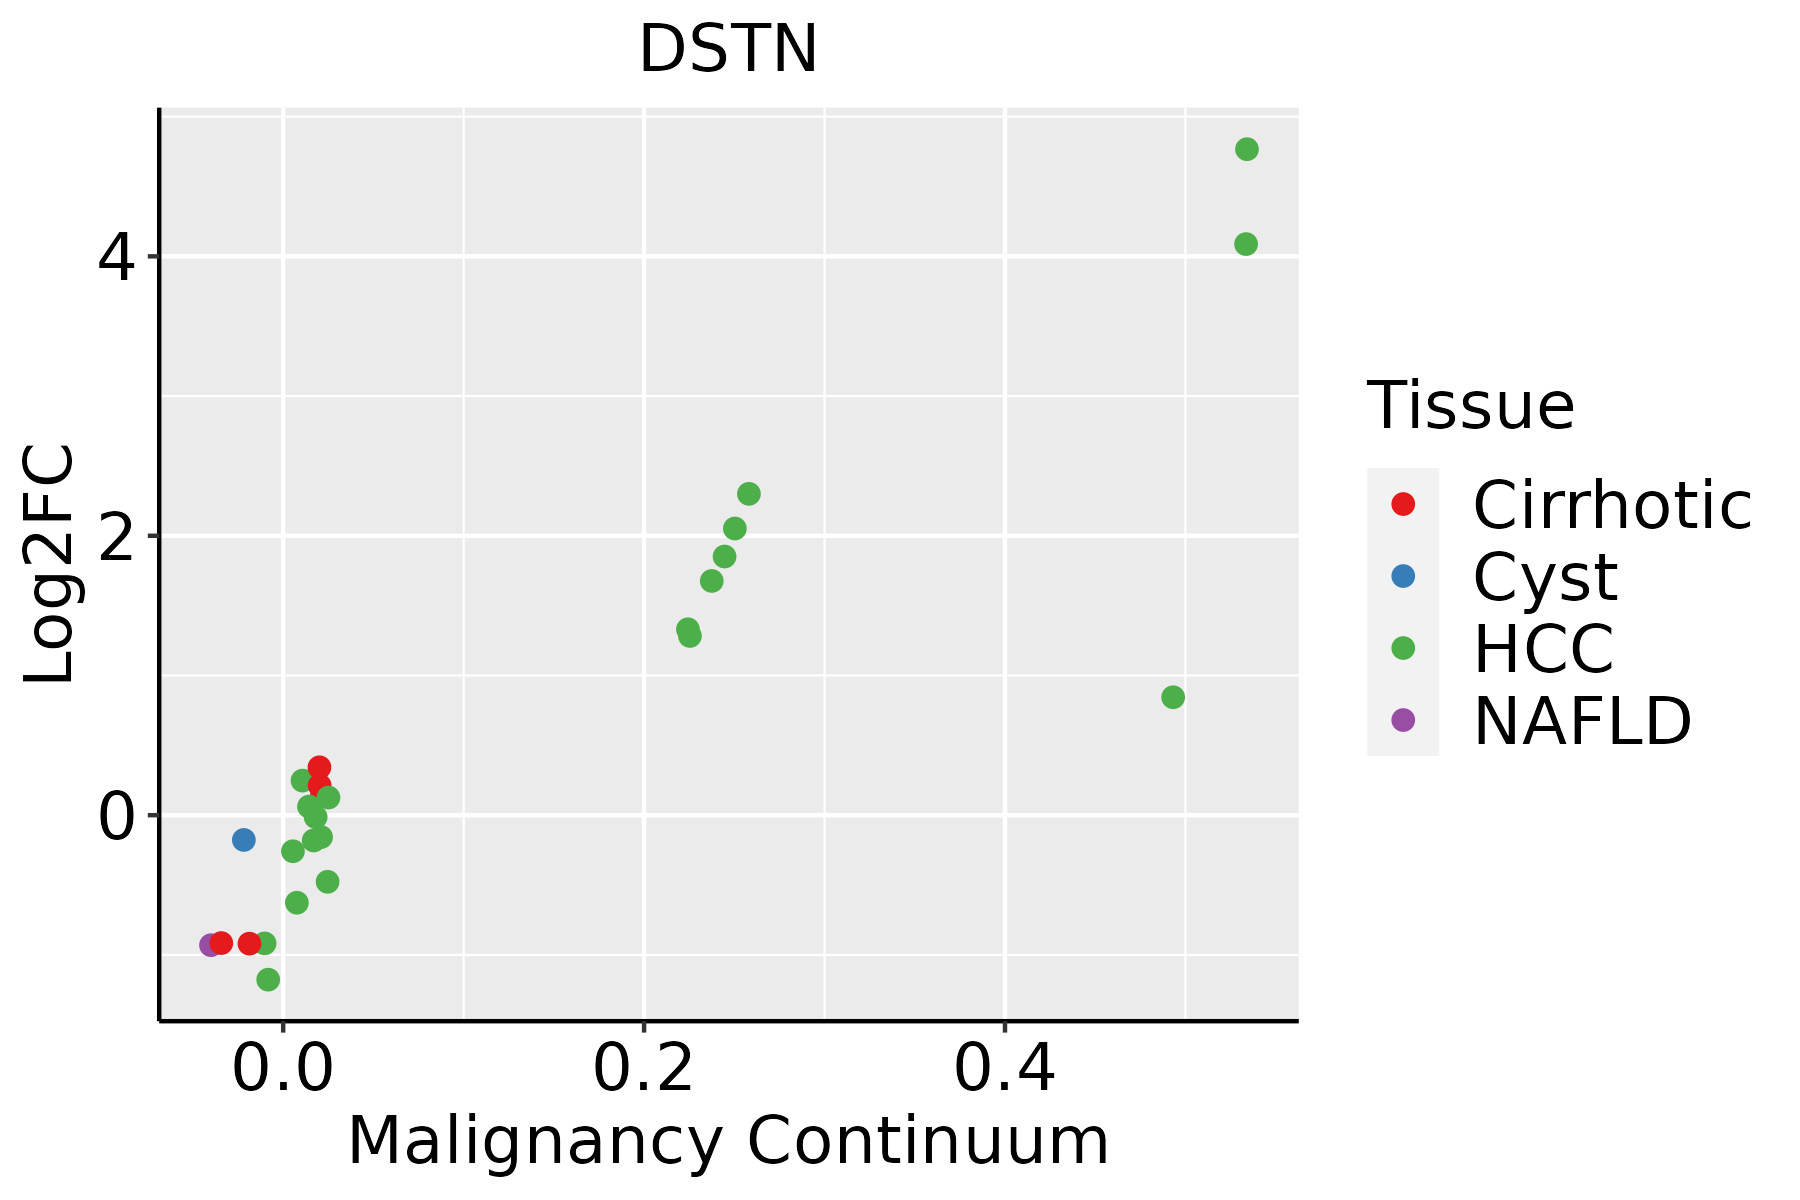 | HCC: Hepatocellular carcinoma |
| NAFLD: Non-alcoholic fatty liver disease | ||
| Oral Cavity | 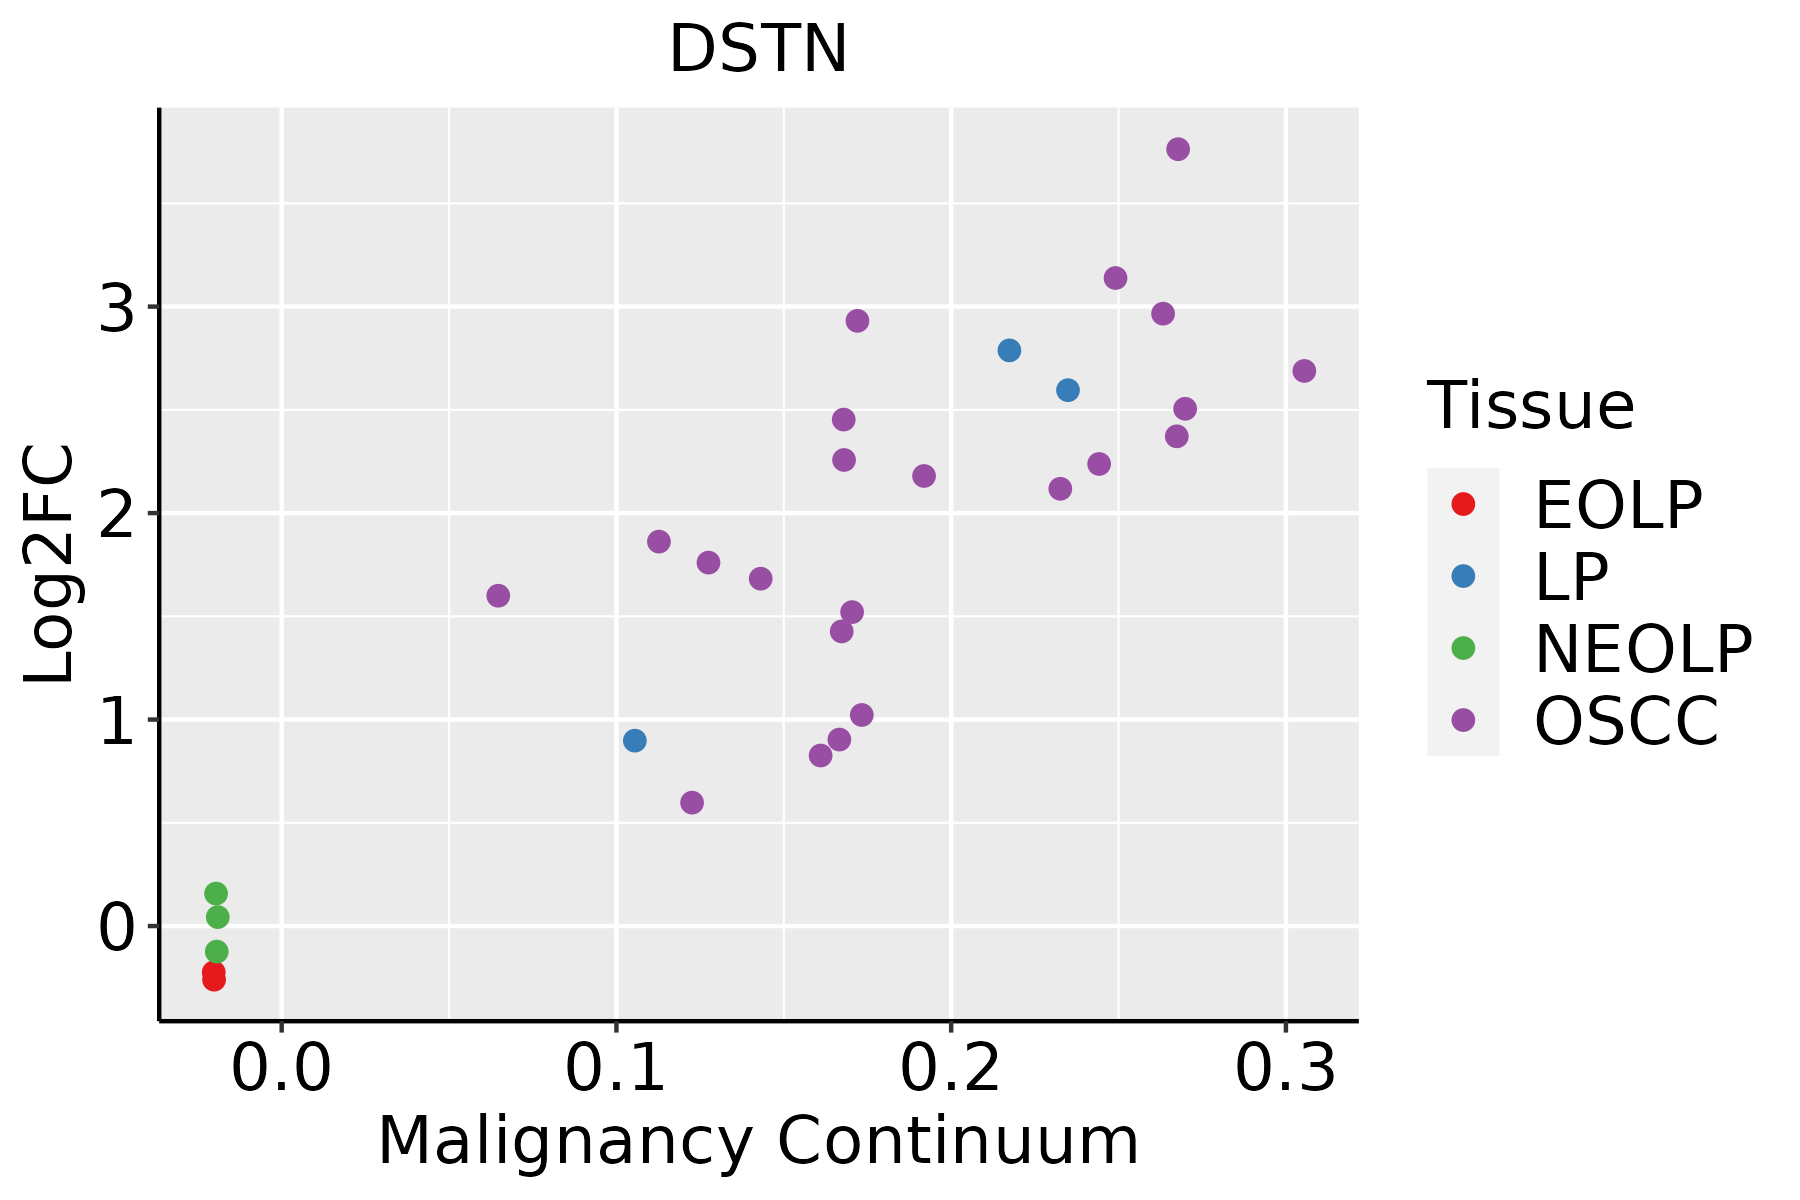 | EOLP: Erosive Oral lichen planus |
| LP: leukoplakia | ||
| NEOLP: Non-erosive oral lichen planus | ||
| OSCC: Oral squamous cell carcinoma | ||
| Prostate | 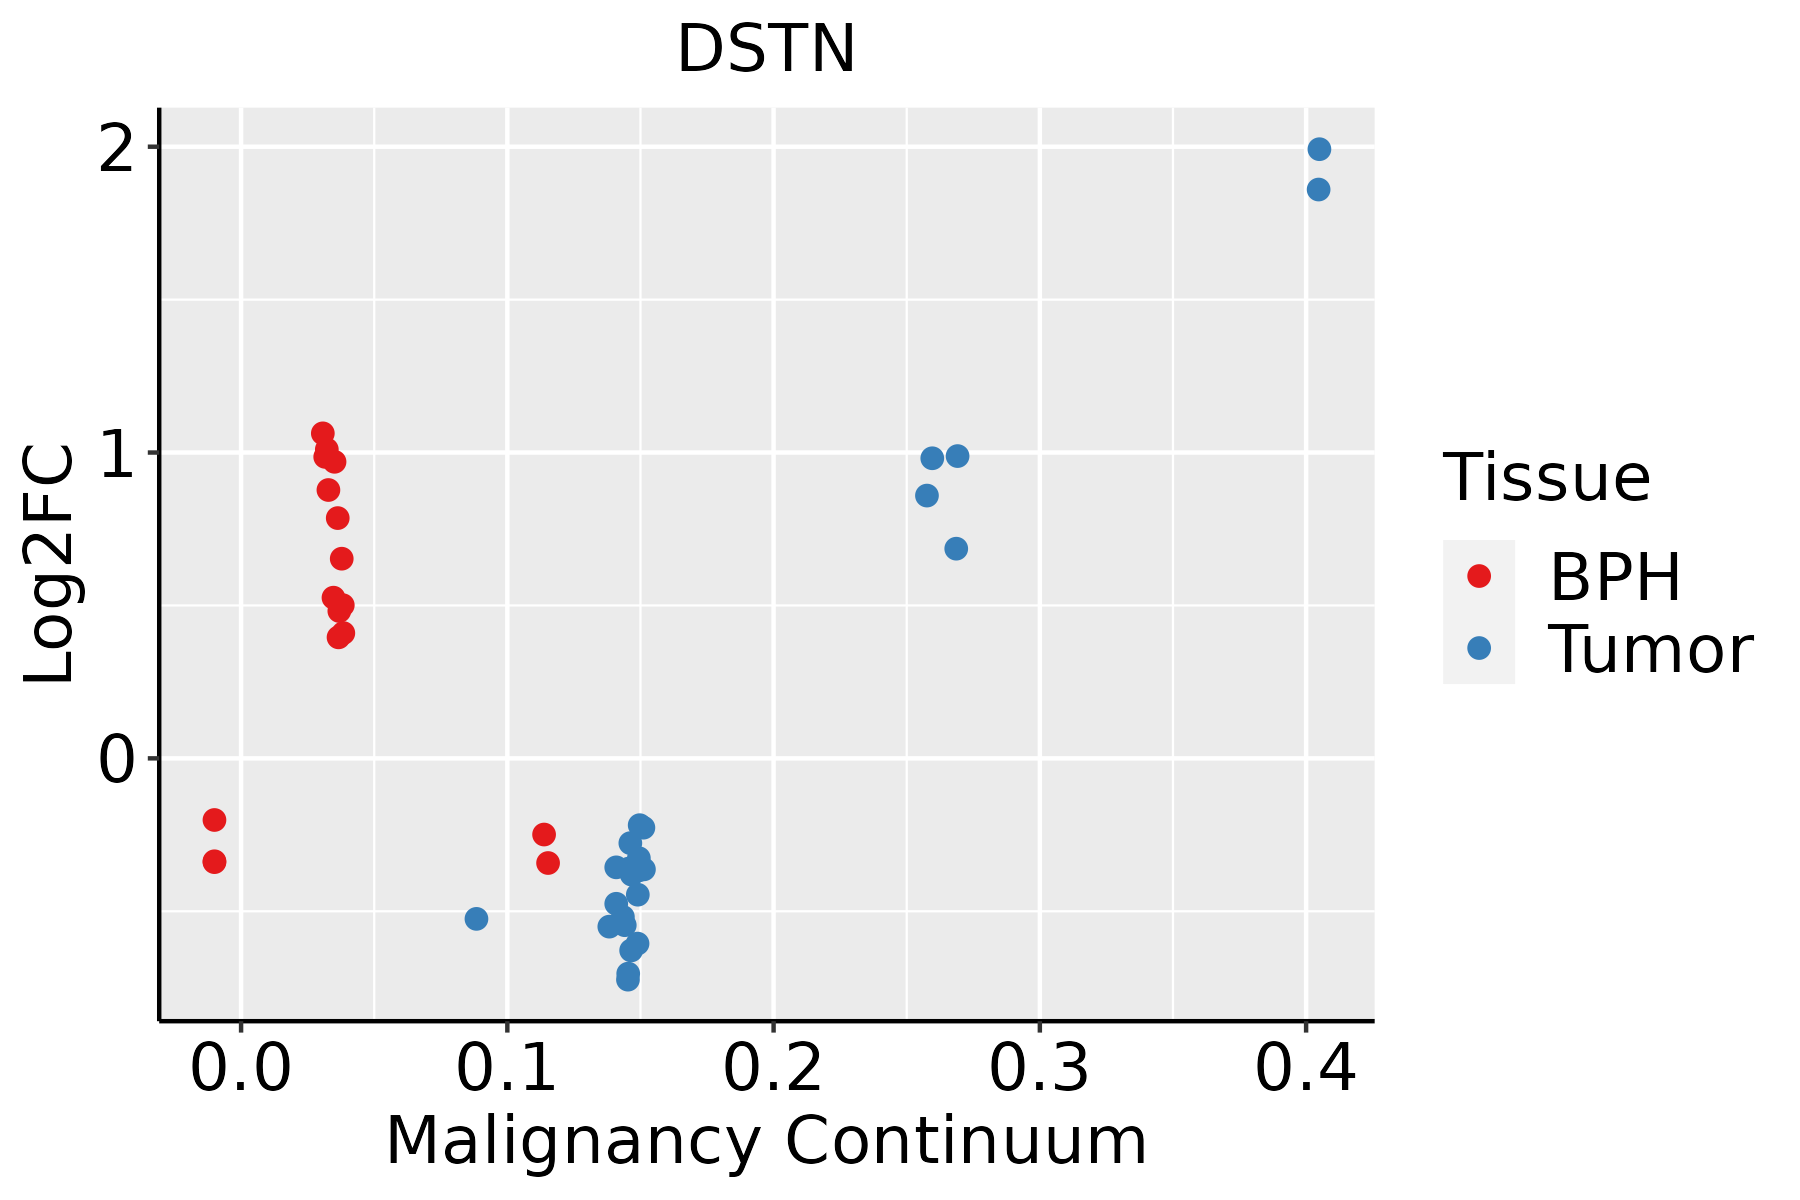 | BPH: Benign Prostatic Hyperplasia |
| Skin | 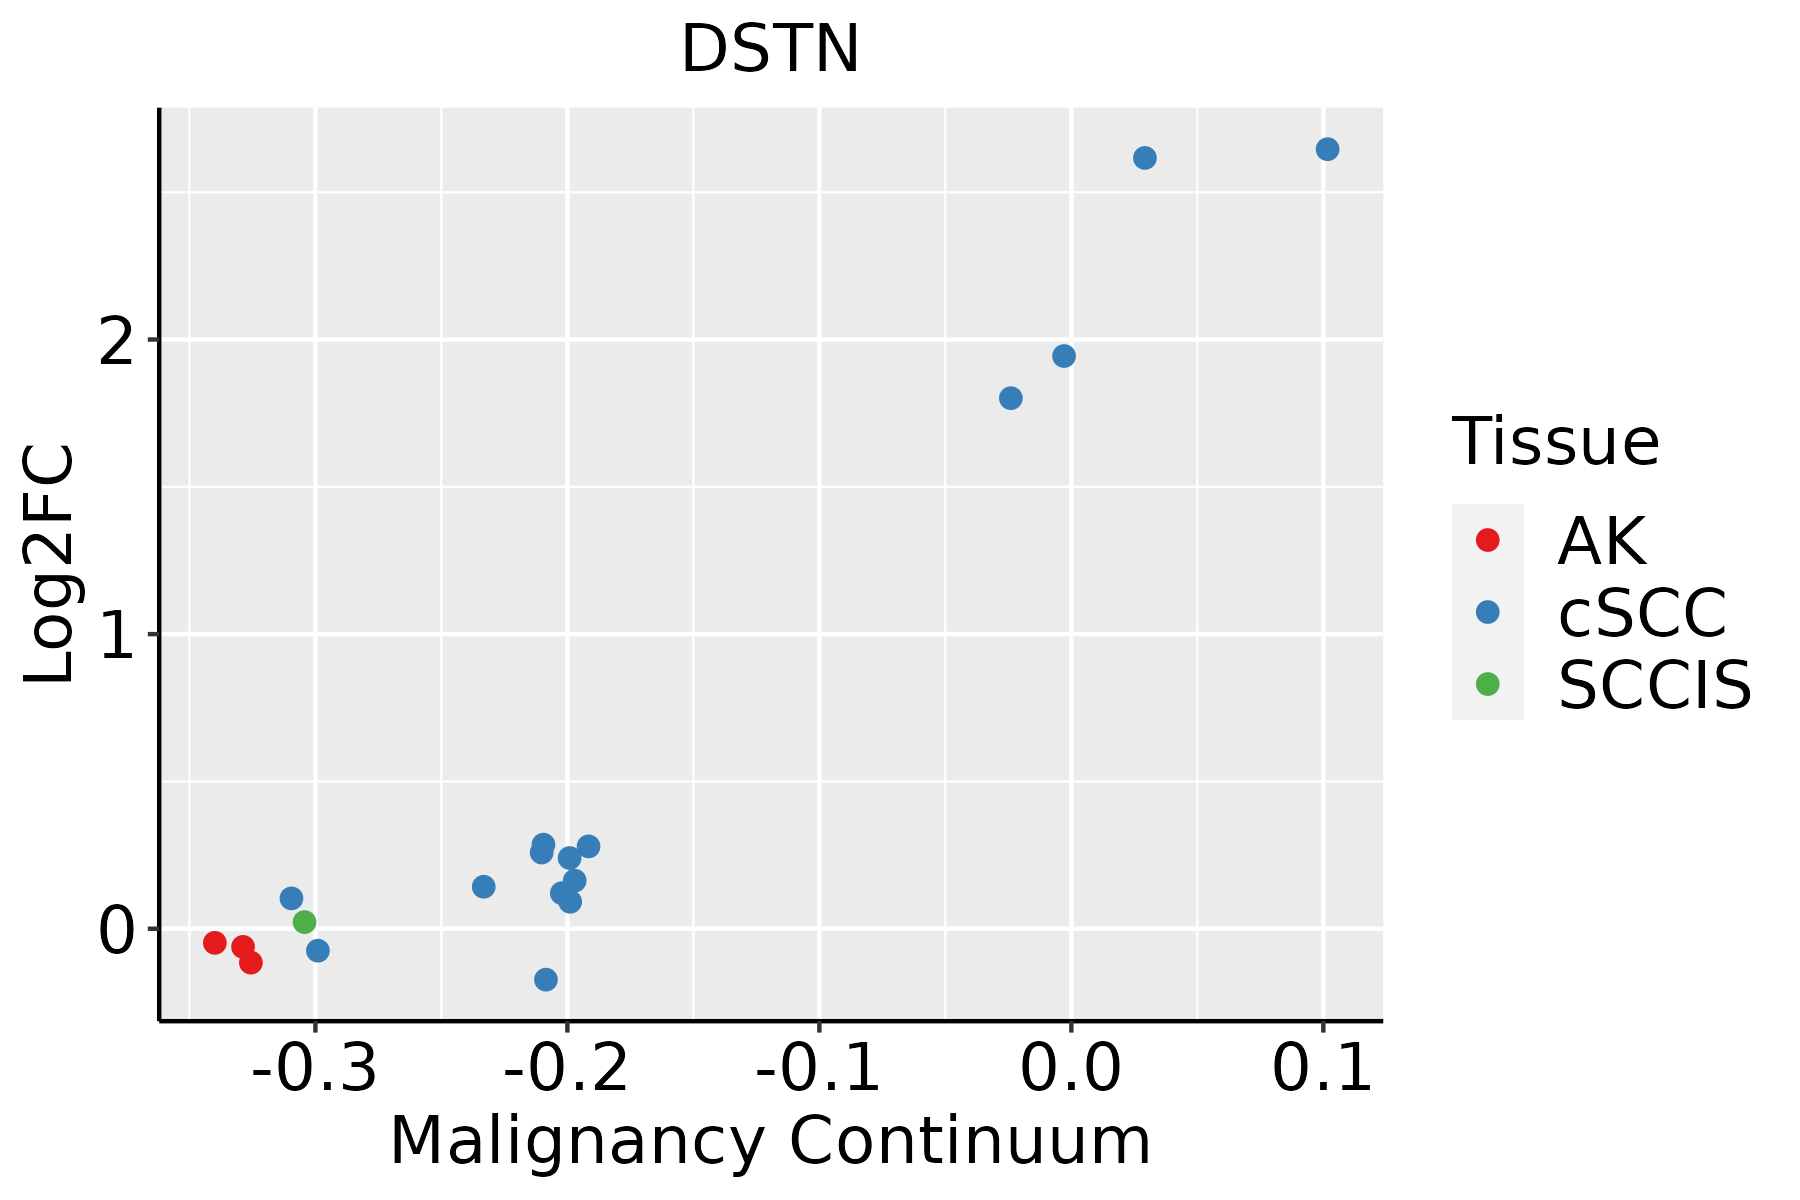 | AK: Actinic keratosis |
| cSCC: Cutaneous squamous cell carcinoma | ||
| SCCIS:squamous cell carcinoma in situ | ||
| Thyroid |  | ATC: Anaplastic thyroid cancer |
| HT: Hashimoto's thyroiditis | ||
| PTC: Papillary thyroid cancer |
| ∗log2FC in expression of this searched gene in stem-like cells from each diseased tissue sample relative to stem-like cells in normal samples in each tissue plotted against the malignancy continuum. Samples are colored based on if they are from different disease stage. |
Top |
Malignant transformation related pathway analysis |
| Find out the enriched GO biological processes and KEGG pathways involved in transition from healthy to precancer to cancer |
| Tissue | Disease Stage | Enriched GO biological Processes |
| Colorectum | AD |  |
| Colorectum | SER |  |
| Colorectum | MSS |  |
| Colorectum | MSI-H |  |
| Colorectum | FAP |  |
| ∗Top 15 enriched GO BP terms are showed in the bar plot of each disease state in each tissue. Each row represents a significant GO biological process which is colored according to the -log10(p.adjust). |
| Page: 1 2 3 4 5 6 7 8 9 |
| GO ID | Tissue | Disease Stage | Description | Gene Ratio | Bg Ratio | pvalue | p.adjust | Count |
| GO:19029059 | Breast | Precancer | positive regulation of supramolecular fiber organization | 28/1080 | 209/18723 | 2.79e-05 | 6.28e-04 | 28 |
| GO:19029039 | Breast | Precancer | regulation of supramolecular fiber organization | 42/1080 | 383/18723 | 4.92e-05 | 1.04e-03 | 42 |
| GO:00329709 | Breast | Precancer | regulation of actin filament-based process | 42/1080 | 397/18723 | 1.11e-04 | 2.01e-03 | 42 |
| GO:00514959 | Breast | Precancer | positive regulation of cytoskeleton organization | 28/1080 | 226/18723 | 1.13e-04 | 2.04e-03 | 28 |
| GO:00070159 | Breast | Precancer | actin filament organization | 44/1080 | 442/18723 | 3.02e-04 | 4.35e-03 | 44 |
| GO:00224119 | Breast | Precancer | cellular component disassembly | 44/1080 | 443/18723 | 3.17e-04 | 4.51e-03 | 44 |
| GO:00329569 | Breast | Precancer | regulation of actin cytoskeleton organization | 36/1080 | 358/18723 | 8.56e-04 | 9.88e-03 | 36 |
| GO:01100539 | Breast | Precancer | regulation of actin filament organization | 29/1080 | 278/18723 | 1.50e-03 | 1.55e-02 | 29 |
| GO:190290514 | Breast | IDC | positive regulation of supramolecular fiber organization | 37/1434 | 209/18723 | 1.33e-06 | 5.75e-05 | 37 |
| GO:003297014 | Breast | IDC | regulation of actin filament-based process | 56/1434 | 397/18723 | 6.37e-06 | 1.99e-04 | 56 |
| GO:190290314 | Breast | IDC | regulation of supramolecular fiber organization | 54/1434 | 383/18723 | 9.40e-06 | 2.66e-04 | 54 |
| GO:005149513 | Breast | IDC | positive regulation of cytoskeleton organization | 35/1434 | 226/18723 | 5.04e-05 | 1.09e-03 | 35 |
| GO:003295614 | Breast | IDC | regulation of actin cytoskeleton organization | 48/1434 | 358/18723 | 1.03e-04 | 1.96e-03 | 48 |
| GO:000701514 | Breast | IDC | actin filament organization | 55/1434 | 442/18723 | 2.45e-04 | 3.84e-03 | 55 |
| GO:011005314 | Breast | IDC | regulation of actin filament organization | 37/1434 | 278/18723 | 7.01e-04 | 8.58e-03 | 37 |
| GO:00325358 | Breast | IDC | regulation of cellular component size | 45/1434 | 383/18723 | 2.72e-03 | 2.41e-02 | 45 |
| GO:190290524 | Breast | DCIS | positive regulation of supramolecular fiber organization | 37/1390 | 209/18723 | 6.31e-07 | 2.71e-05 | 37 |
| GO:003297024 | Breast | DCIS | regulation of actin filament-based process | 56/1390 | 397/18723 | 2.50e-06 | 8.74e-05 | 56 |
| GO:190290324 | Breast | DCIS | regulation of supramolecular fiber organization | 54/1390 | 383/18723 | 3.82e-06 | 1.16e-04 | 54 |
| GO:005149523 | Breast | DCIS | positive regulation of cytoskeleton organization | 35/1390 | 226/18723 | 2.66e-05 | 6.04e-04 | 35 |
| Page: 1 2 3 4 5 6 7 8 9 10 11 12 13 14 15 16 17 18 |
| Pathway ID | Tissue | Disease Stage | Description | Gene Ratio | Bg Ratio | pvalue | p.adjust | qvalue | Count |
| Page: 1 |
Top |
Cell-cell communication analysis |
| Identification of potential cell-cell interactions between two cell types and their ligand-receptor pairs for different disease states |
| Ligand | Receptor | LRpair | Pathway | Tissue | Disease Stage |
| Page: 1 |
Top |
Single-cell gene regulatory network inference analysis |
| Find out the significant the regulons (TFs) and the target genes of each regulon across cell types for different disease states |
| TF | Cell Type | Tissue | Disease Stage | Target Gene | RSS | Regulon Activity |
| ∗The dot plots of a searched regulon are shown for all cell subpopulations in each disease state of each tissue based on the regulon specific score inferred using pySCENIC and by calculating the average expression. |
| Page: 1 |
Top |
Somatic mutation of malignant transformation related genes |
| Annotation of somatic variants for genes involved in malignant transformation |
| Hugo Symbol | Variant Class | Variant Classification | dbSNP RS | HGVSc | HGVSp | HGVSp Short | SWISSPROT | BIOTYPE | SIFT | PolyPhen | Tumor Sample Barcode | Tissue | Histology | Sex | Age | Stage | Therapy Types | Drugs | Outcome |
| DSTN | deletion | Frame_Shift_Del | novel | c.249delN | p.Leu84CysfsTer16 | p.L84Cfs*16 | P60981 | protein_coding | TCGA-EW-A2FV-01 | Breast | breast invasive carcinoma | Female | <65 | III/IV | Chemotherapy | docetaxel | SD | ||
| DSTN | SNV | Missense_Mutation | c.385C>G | p.Gln129Glu | p.Q129E | P60981 | protein_coding | tolerated(0.19) | benign(0.001) | TCGA-EK-A2RJ-01 | Cervix | cervical & endocervical cancer | Female | <65 | I/II | Unknown | Unknown | SD | |
| DSTN | SNV | Missense_Mutation | c.404G>T | p.Cys135Phe | p.C135F | P60981 | protein_coding | tolerated(0.08) | benign(0.001) | TCGA-EK-A2RJ-01 | Cervix | cervical & endocervical cancer | Female | <65 | I/II | Unknown | Unknown | SD | |
| DSTN | SNV | Missense_Mutation | novel | c.272C>T | p.Thr91Ile | p.T91I | P60981 | protein_coding | deleterious(0.01) | probably_damaging(0.976) | TCGA-AA-A01P-01 | Colorectum | colon adenocarcinoma | Female | >=65 | III/IV | Unknown | Unknown | PD |
| DSTN | SNV | Missense_Mutation | c.349N>C | p.Tyr117His | p.Y117H | P60981 | protein_coding | deleterious(0) | possibly_damaging(0.822) | TCGA-CK-4951-01 | Colorectum | colon adenocarcinoma | Female | >=65 | I/II | Unknown | Unknown | PD | |
| DSTN | SNV | Missense_Mutation | rs138670114 | c.61C>T | p.Arg21Cys | p.R21C | P60981 | protein_coding | tolerated(0.2) | benign(0.02) | TCGA-AG-A002-01 | Colorectum | rectum adenocarcinoma | Male | <65 | I/II | Unknown | Unknown | SD |
| DSTN | insertion | Frame_Shift_Ins | rs767965259 | c.300_301insT | p.Leu103PhefsTer12 | p.L103Ffs*12 | P60981 | protein_coding | TCGA-AA-3492-01 | Colorectum | colon adenocarcinoma | Female | >=65 | I/II | Unknown | Unknown | SD | ||
| DSTN | deletion | Frame_Shift_Del | rs750962255 | c.301delN | p.Leu103CysfsTer6 | p.L103Cfs*6 | P60981 | protein_coding | TCGA-AA-3864-01 | Colorectum | colon adenocarcinoma | Male | >=65 | I/II | Unknown | Unknown | SD | ||
| DSTN | insertion | Frame_Shift_Ins | rs767965259 | c.308dupT | p.Leu103PhefsTer12 | p.L103Ffs*12 | P60981 | protein_coding | TCGA-DM-A1HA-01 | Colorectum | colon adenocarcinoma | Male | >=65 | III/IV | Unknown | Unknown | SD | ||
| DSTN | insertion | Frame_Shift_Ins | rs767965259 | c.300_301insT | p.Leu103PhefsTer12 | p.L103Ffs*12 | P60981 | protein_coding | TCGA-G4-6309-01 | Colorectum | colon adenocarcinoma | Female | <65 | III/IV | Chemotherapy | xeloda | PD |
| Page: 1 2 3 4 |
Top |
Related drugs of malignant transformation related genes |
| Identification of chemicals and drugs interact with genes involved in malignant transfromation |
| (DGIdb 4.0) |
| Entrez ID | Symbol | Category | Interaction Types | Drug Claim Name | Drug Name | PMIDs |
| Page: 1 |

Copyright 2023-Present -The University of Texas Health Science Center at Houston |