Schematic overview of the cellular and molecular mechanisms involved in the cancer progression, including the proposed cellular and molecular mechanisms in cancer cells trajectory. AT1: alveolar type 1 cells; AT2: alveolar type 2 cells; AAH: atypical adenomatous hyperplasia; AIS: adenocarcinoma in situ; MIA: minimally invasive adenocarcinoma; IA: invasive adenocarcinoma; EMT: epithelial-mesenchymal transition

Home

Download

Statistics

Help

Contact

Center for Computational Systems Medicine
leaf

Gene summary

leaf

Malignant transformation analysis

leaf

Malignant transformation related pathway analysis

leaf

Cell-cell communication analysis

leaf

Single-cell gene regulatory network inference analysis

leaf

Somatic mutation of malignant transformation related genes

leaf

Related drugs of malignant transformation related genes

Gene: DSC3

Gene summary for DSC3

check button Gene summary.

Gene informationSpeciesHuman
Gene symbol

DSC3

Gene ID

1825

Gene namedesmocollin 3
Gene AliasCDHF3
Cytomap18q12.1
Gene Typeprotein-coding
GO ID

GO:0007155

UniProtAcc

Q14574


Top

Malignant transformation analysis

check button Identification of the aberrant gene expression in precancerous and cancerous lesions by comparing the gene expression of stem-like cells in diseased tissues with normal stem cells
check button Malignant transformation involving gene list.
Entrez IDSymbolReplicatesSpeciesOrganTissueAdj P-valueLog2FCMalignancy
1825DSC3047563_1562-all-cellsHumanProstateBPH1.22e-05-2.38e-030.0791
1825DSC3048752_1579-all-cellsHumanProstateBPH1.46e-124.64e-010.1008
1825DSC3052095_1628-all-cellsHumanProstateBPH2.78e-023.16e-010.1032
1825DSC3052097_1595-all-cellsHumanProstateBPH2.39e-134.78e-010.0972
1825DSC3052099_1652-all-cellsHumanProstateBPH6.92e-083.60e-010.1038
1825DSC3Dong_P1HumanProstateTumor1.65e-05-1.65e-010.035
1825DSC3Dong_P3HumanProstateTumor4.03e-121.64e-010.0278
1825DSC3Dong_P5HumanProstateTumor2.59e-06-1.87e-010.053
1825DSC3GSM5353215_PA_AUG_PB_1B_S2HumanProstateTumor2.84e-057.33e-010.1557
1825DSC3GSM5353221_PA_PB2A_Pool_1_3_S25_L001HumanProstateTumor6.59e-106.86e-010.1633
1825DSC3GSM5353222_PA_PB2B_Pool_1_3_S52_L002HumanProstateTumor1.96e-055.11e-010.1608
1825DSC3GSM5353227_PA_PR5199-193K_Pool_1_2_3_S55_L002HumanProstateTumor6.20e-065.52e-010.1602
1825DSC3GSM5353236_PA_PR5251_T1_S7_L001HumanProstateTumor3.17e-025.50e-010.1608
1825DSC3GSM5353237_PA_PR5251_T2_S8_L001HumanProstateTumor3.44e-068.43e-010.1622
1825DSC3GSM5353240_PA_PR5254_T1_S15_L001HumanProstateTumor1.67e-023.61e-010.1575
1825DSC3GSM5353243_PA_PR5261_T1_S23_L002HumanProstateTumor7.85e-073.93e-010.1545
1825DSC3GSM5353244_PA_PR5261_T2_S24_L002HumanProstateTumor3.39e-064.66e-010.1569
1825DSC3P1_S1_AKHumanSkinAK1.25e-458.88e-01-0.3399
1825DSC3P2_S3_AKHumanSkinAK5.02e-236.40e-01-0.3287
1825DSC3P2_S4_SCCISHumanSkinSCCIS5.42e-115.23e-01-0.3043
Page: 1 2 3 4 5 6 7 

check button Transcriptomic changes along malignancy continuum.
TissueExpression DynamicsAbbreviation
BreastThe image shows the transcriptomic changes along malignancy continuum.log2FC in expression of this searched gene in stem-like cells from each diseased tissue sample relative to stem-like cells in normal samples in each tissue plotted against the malignancy continuum. Samples are colored based on if they are from different disease stage.
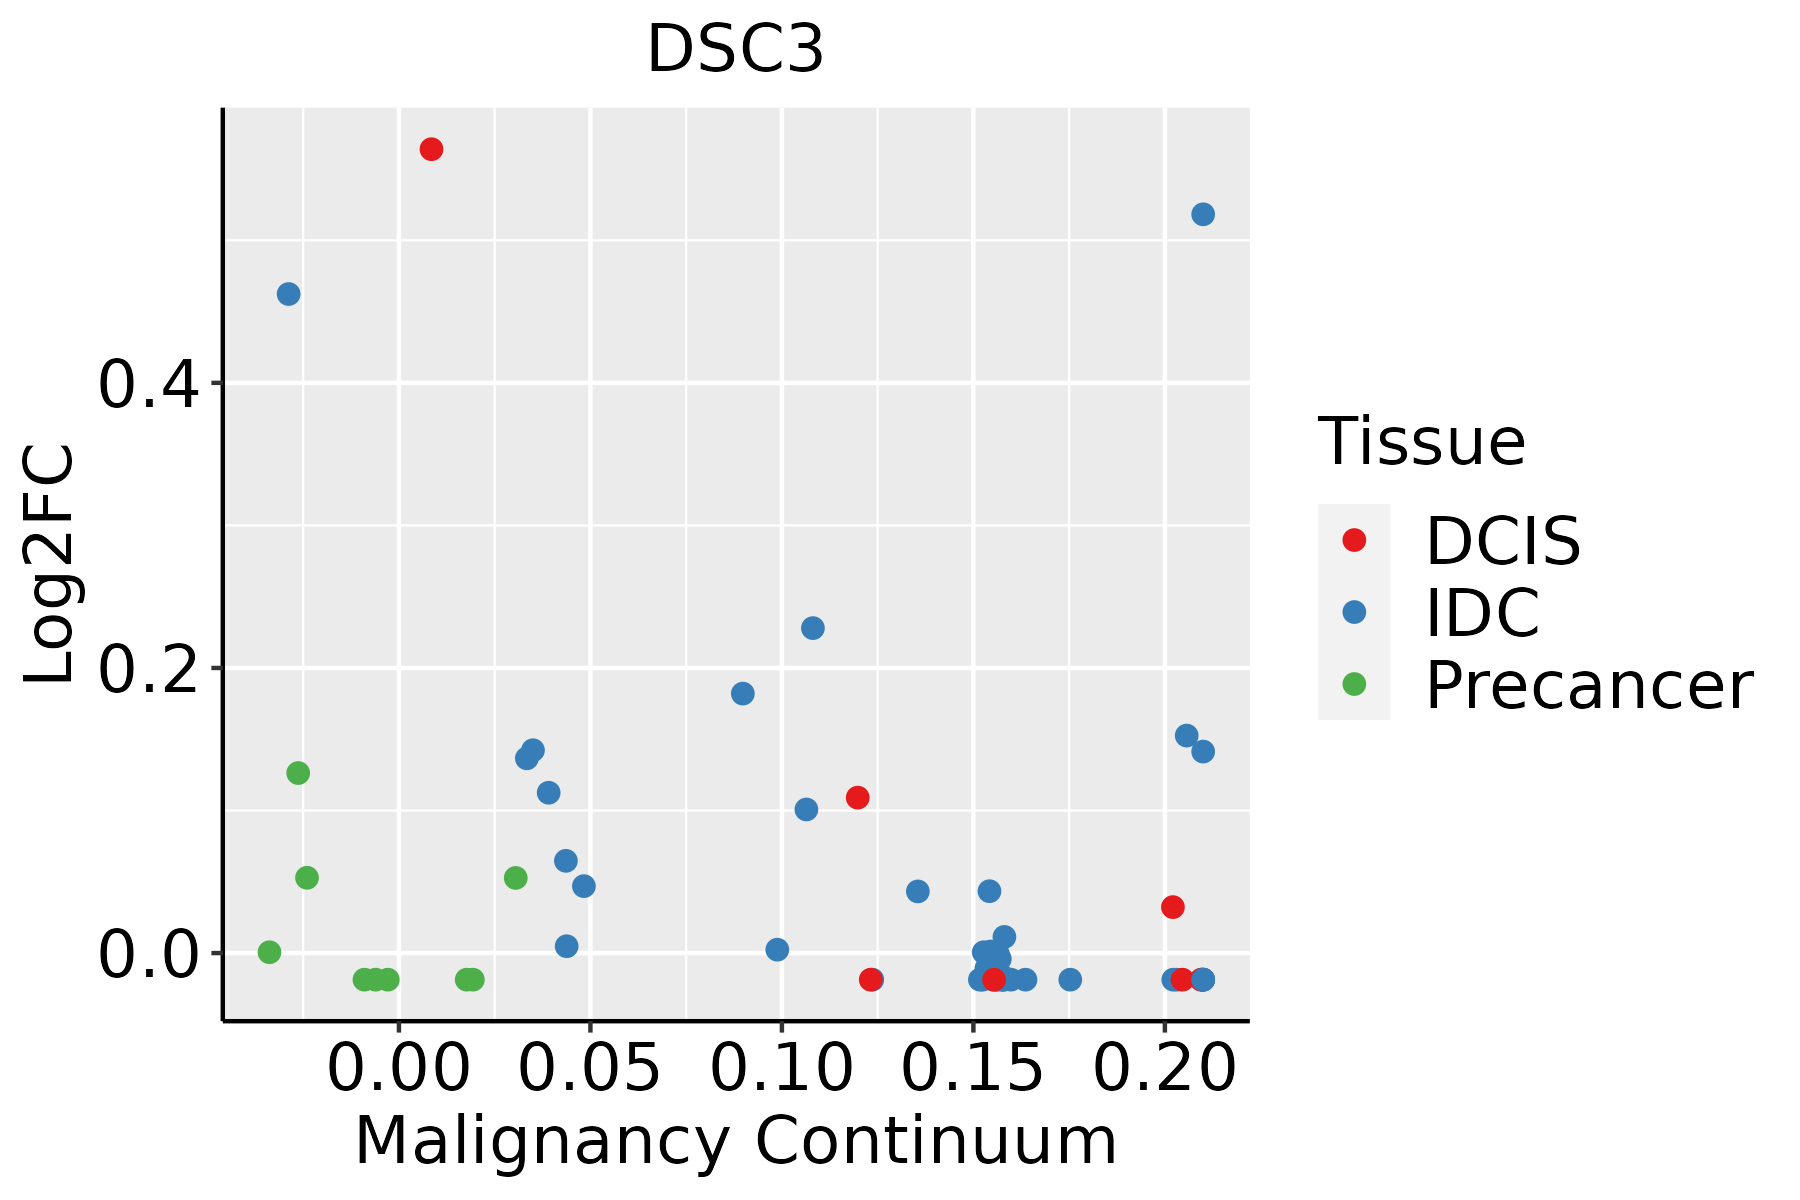
IDC: Invasive ductal carcinoma
DCIS: Ductal carcinoma in situ
Precancer(BRCA1-mut): Precancerous lesion from BRCA1 mutation carriers
CervixThe image shows the transcriptomic changes along malignancy continuum.log2FC in expression of this searched gene in stem-like cells from each diseased tissue sample relative to stem-like cells in normal samples in each tissue plotted against the malignancy continuum. Samples are colored based on if they are from different disease stage.CC: Cervix cancer
HSIL_HPV: HPV-infected high-grade squamous intraepithelial lesions
N_HPV: HPV-infected normal cervix
EsophagusThe image shows the transcriptomic changes along malignancy continuum.log2FC in expression of this searched gene in stem-like cells from each diseased tissue sample relative to stem-like cells in normal samples in each tissue plotted against the malignancy continuum. Samples are colored based on if they are from different disease stage.
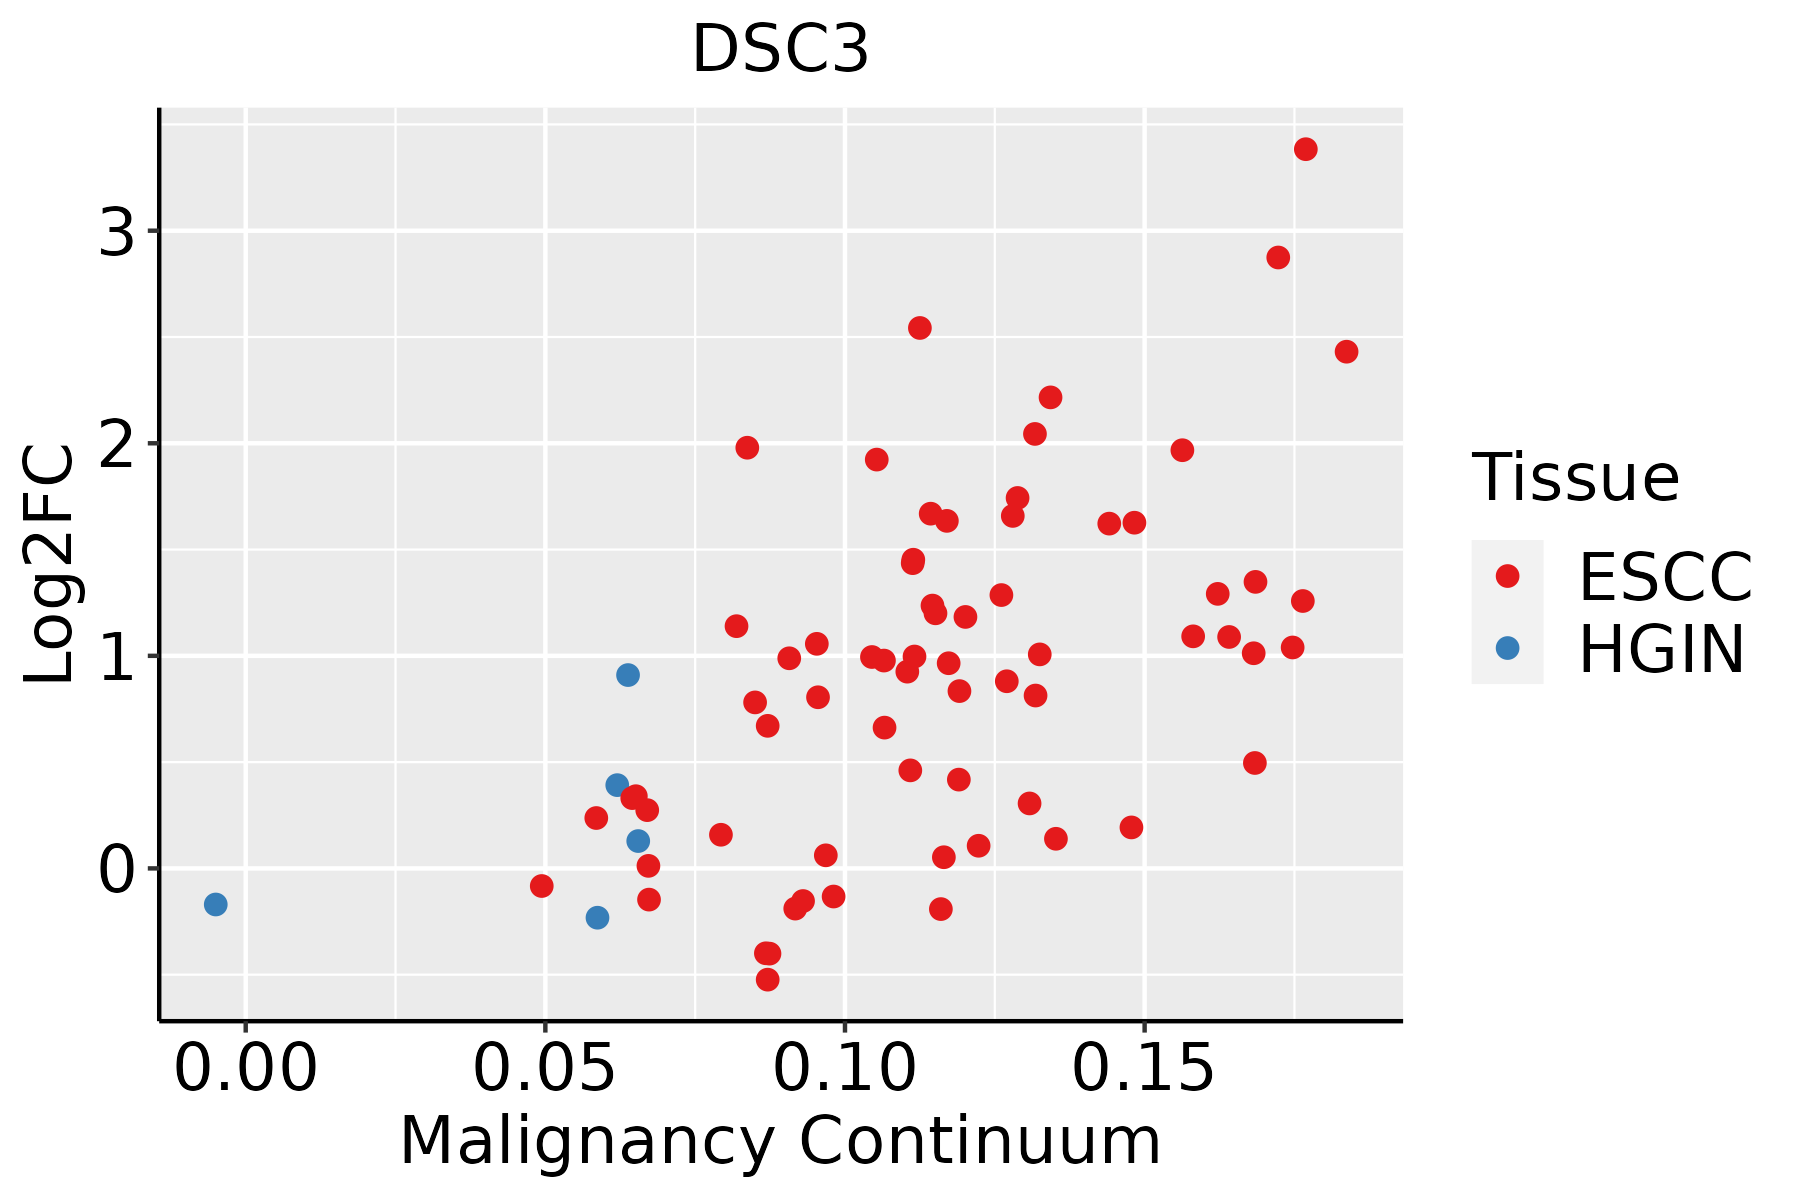
ESCC: Esophageal squamous cell carcinoma
HGIN: High-grade intraepithelial neoplasias
LGIN: Low-grade intraepithelial neoplasias
Oral CavityThe image shows the transcriptomic changes along malignancy continuum.log2FC in expression of this searched gene in stem-like cells from each diseased tissue sample relative to stem-like cells in normal samples in each tissue plotted against the malignancy continuum. Samples are colored based on if they are from different disease stage.EOLP: Erosive Oral lichen planus
LP: leukoplakia
NEOLP: Non-erosive oral lichen planus
OSCC: Oral squamous cell carcinoma
ProstateThe image shows the transcriptomic changes along malignancy continuum.log2FC in expression of this searched gene in stem-like cells from each diseased tissue sample relative to stem-like cells in normal samples in each tissue plotted against the malignancy continuum. Samples are colored based on if they are from different disease stage.BPH: Benign Prostatic Hyperplasia
SkinThe image shows the transcriptomic changes along malignancy continuum.log2FC in expression of this searched gene in stem-like cells from each diseased tissue sample relative to stem-like cells in normal samples in each tissue plotted against the malignancy continuum. Samples are colored based on if they are from different disease stage.
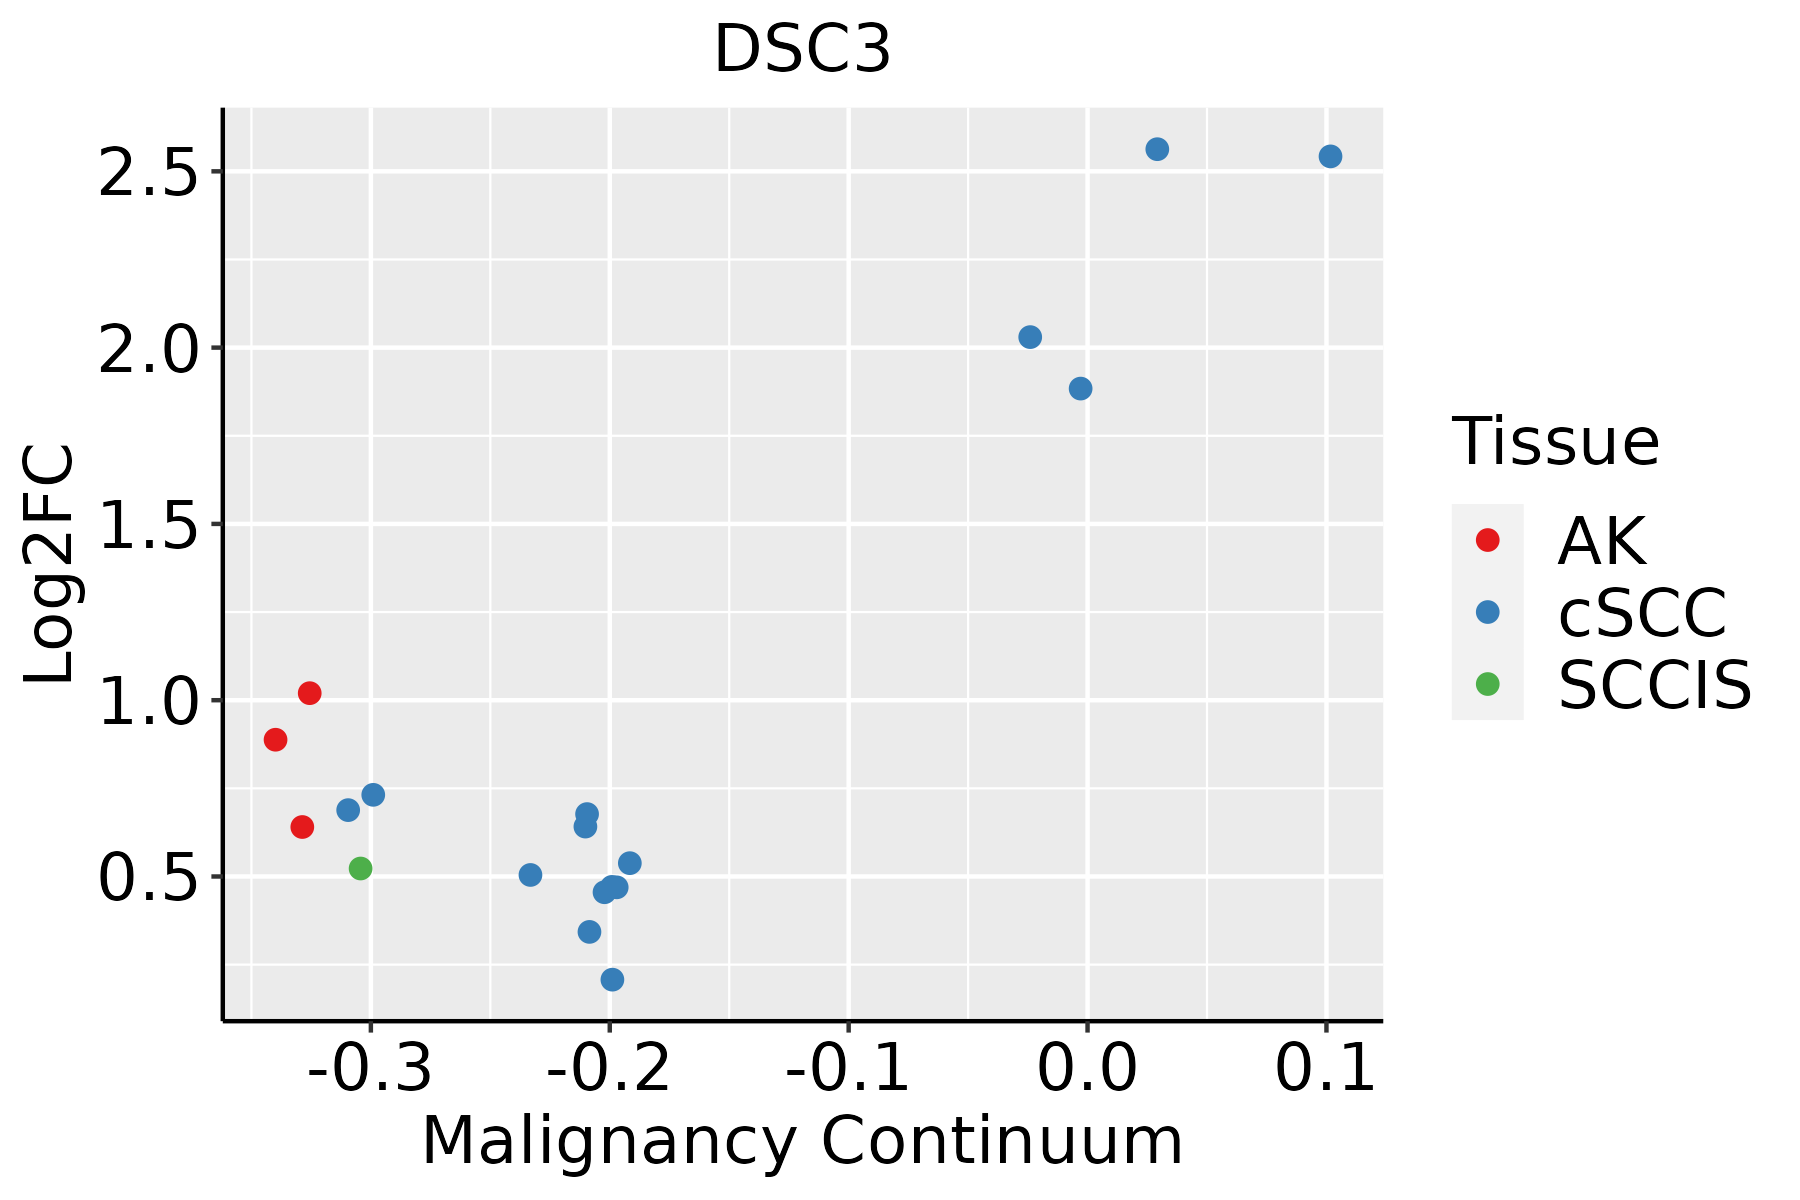
AK: Actinic keratosis
cSCC: Cutaneous squamous cell carcinoma
SCCIS:squamous cell carcinoma in situ
∗log2FC in expression of this searched gene in stem-like cells from each diseased tissue sample relative to stem-like cells in normal samples in each tissue plotted against the malignancy continuum. Samples are colored based on if they are from different disease stage.

Top

Malignant transformation related pathway analysis

check buttonFind out the enriched GO biological processes and KEGG pathways involved in transition from healthy to precancer to cancer
check button Figure of enriched GO biological processes.
TissueDisease StageEnriched GO biological Processes
ColorectumADGO analysis - Figure of enriched GO biological processes: Top 15 enriched GO BP terms are showed in the bar plot of each disease state in each tissue. Each row represents a significant GO biological process which is colored according to the -log10(p.adjust).
ColorectumSERGO analysis - Figure of enriched GO biological processes: Top 15 enriched GO BP terms are showed in the bar plot of each disease state in each tissue. Each row represents a significant GO biological process which is colored according to the -log10(p.adjust).
ColorectumMSSGO analysis - Figure of enriched GO biological processes: Top 15 enriched GO BP terms are showed in the bar plot of each disease state in each tissue. Each row represents a significant GO biological process which is colored according to the -log10(p.adjust).
ColorectumMSI-HGO analysis - Figure of enriched GO biological processes: Top 15 enriched GO BP terms are showed in the bar plot of each disease state in each tissue. Each row represents a significant GO biological process which is colored according to the -log10(p.adjust).
ColorectumFAPGO analysis - Figure of enriched GO biological processes: Top 15 enriched GO BP terms are showed in the bar plot of each disease state in each tissue. Each row represents a significant GO biological process which is colored according to the -log10(p.adjust).
∗Top 15 enriched GO BP terms are showed in the bar plot of each disease state in each tissue. Each row represents a significant GO biological process which is colored according to the -log10(p.adjust).
Page: 1 2 3 4 5 6 7 8 9 

check button Enriched GO biological processes.
GO IDTissueDisease StageDescriptionGene RatioBg Ratiopvaluep.adjustCount
GO:0098742CervixN_HPVcell-cell adhesion via plasma-membrane adhesion molecules17/534273/187232.26e-032.11e-0217
GO:00987421SkinSCCIScell-cell adhesion via plasma-membrane adhesion molecules26/919273/187239.83e-041.23e-0226
Page: 1 

check button Enriched KEGG pathways.
Pathway IDTissueDisease StageDescriptionGene RatioBg Ratiopvaluep.adjustqvalueCount
Page: 1 

Top

Cell-cell communication analysis

check buttonIdentification of potential cell-cell interactions between two cell types and their ligand-receptor pairs for different disease states
LigandReceptorLRpairPathwayTissueDisease Stage
DSG2DSC3DSG2_DSC3DESMOSOMEBreastIDC
DSG2DSC3DSG2_DSC3DESMOSOMECervixCC
DSG1DSC3DSG1_DSC3DESMOSOMECervixHealthy
DSG2DSC3DSG2_DSC3DESMOSOMEEsophagusADJ
DSG2DSC3DSG2_DSC3DESMOSOMEEsophagusESCC
DSG1DSC3DSG1_DSC3DESMOSOMEHNSCCOSCC
DSG2DSC3DSG2_DSC3DESMOSOMEHNSCCOSCC
DSG1DSC3DSG1_DSC3DESMOSOMEHNSCCPrecancer
DSG2DSC3DSG2_DSC3DESMOSOMEHNSCCPrecancer
DSG2DSC3DSG2_DSC3DESMOSOMEProstateADJ
DSG2DSC3DSG2_DSC3DESMOSOMEProstateBPH
DSG1DSC3DSG1_DSC3DESMOSOMESkinADJ
DSG2DSC3DSG2_DSC3DESMOSOMESkinADJ
DSG1DSC3DSG1_DSC3DESMOSOMESkinAK
DSG2DSC3DSG2_DSC3DESMOSOMESkinAK
DSG1DSC3DSG1_DSC3DESMOSOMESkincSCC
DSG1DSC3DSG1_DSC3DESMOSOMESkinHealthy
DSG1DSC3DSG1_DSC3DESMOSOMESkinSCCIS
Page: 1 

Top

Single-cell gene regulatory network inference analysis

check buttonFind out the significant the regulons (TFs) and the target genes of each regulon across cell types for different disease states
TFCell TypeTissueDisease StageTarget GeneRSSRegulon Activity
∗The dot plots of a searched regulon are shown for all cell subpopulations in each disease state of each tissue based on the regulon specific score inferred using pySCENIC and by calculating the average expression.
Page: 1 

Top

Somatic mutation of malignant transformation related genes

check buttonAnnotation of somatic variants for genes involved in malignant transformation
Hugo SymbolVariant ClassVariant ClassificationdbSNP RSHGVScHGVSpHGVSp ShortSWISSPROTBIOTYPESIFTPolyPhenTumor Sample BarcodeTissueHistologySexAgeStageTherapy TypesDrugsOutcome
DSC3SNVMissense_Mutationc.2219N>Ap.Pro740Hisp.P740HQ14574protein_codingdeleterious(0)probably_damaging(0.999)TCGA-A8-A09Z-01Breastbreast invasive carcinomaFemale>=65I/IIUnknownUnknownSD
DSC3SNVMissense_Mutationnovelc.1381N>Ap.His461Asnp.H461NQ14574protein_codingtolerated(1)benign(0.001)TCGA-AN-A046-01Breastbreast invasive carcinomaFemale>=65I/IIUnknownUnknownSD
DSC3SNVMissense_Mutationnovelc.1146N>Ap.Asp382Glup.D382EQ14574protein_codingdeleterious(0)probably_damaging(0.981)TCGA-AN-A046-01Breastbreast invasive carcinomaFemale>=65I/IIUnknownUnknownSD
DSC3SNVMissense_Mutationnovelc.1795C>Tp.Pro599Serp.P599SQ14574protein_codingtolerated(0.13)benign(0.03)TCGA-BH-A8FY-01Breastbreast invasive carcinomaFemale>=65I/IIUnknownUnknownSD
DSC3SNVMissense_Mutationrs372346117c.2033G>Ap.Arg678Hisp.R678HQ14574protein_codingtolerated(0.07)benign(0.003)TCGA-D8-A1JG-01Breastbreast invasive carcinomaFemale<65I/IIChemotherapydoxorubicinSD
DSC3SNVMissense_Mutationnovelc.1130N>Ap.Pro377Hisp.P377HQ14574protein_codingdeleterious(0.01)benign(0.148)TCGA-S3-AA17-01Breastbreast invasive carcinomaFemale<65I/IIHormone TherapyanastrozoleSD
DSC3insertionNonsense_Mutationnovelc.183_184insTTTAAAGTACATTAAATATTTTCAGTCATTTTTTTCATTAAAATp.Asp62PhefsTer5p.D62Ffs*5Q14574protein_codingTCGA-A2-A0CP-01Breastbreast invasive carcinomaFemale<65I/IIChemotherapycytoxanSD
DSC3insertionFrame_Shift_Insrs752923110c.2383_2384insGp.Ala795GlyfsTer37p.A795Gfs*37Q14574protein_codingTCGA-AN-A0FK-01Breastbreast invasive carcinomaFemale>=65III/IVUnknownUnknownSD
DSC3SNVMissense_Mutationnovelc.2138N>Ap.Gly713Glup.G713EQ14574protein_codingtolerated(0.22)possibly_damaging(0.598)TCGA-2W-A8YY-01Cervixcervical & endocervical cancerFemale<65I/IIChemotherapycisplatinCR
DSC3SNVMissense_Mutationnovelc.523G>Ap.Gly175Argp.G175RQ14574protein_codingdeleterious(0)probably_damaging(1)TCGA-4J-AA1J-01Cervixcervical & endocervical cancerFemale<65I/IIUnknownUnknownSD
Page: 1 2 3 4 5 6 7 8 9 10 11 12 

Top

Related drugs of malignant transformation related genes

check buttonIdentification of chemicals and drugs interact with genes involved in malignant transfromation
(DGIdb 4.0)
Entrez IDSymbolCategoryInteraction TypesDrug Claim NameDrug NamePMIDs
Page: 1