
|
|||||
|
 | |
| |
| |
| |
| |
| |
|
Gene: DGCR6L |
Gene summary for DGCR6L |
| Gene information | Species | Human | Gene symbol | DGCR6L | Gene ID | 85359 |
| Gene name | DiGeorge syndrome critical region gene 6 like | |
| Gene Alias | DGCR6 | |
| Cytomap | 22q11.21 | |
| Gene Type | protein-coding | GO ID | GO:0005575 | UniProtAcc | Q9BY27 |
Top |
Malignant transformation analysis |
| Identification of the aberrant gene expression in precancerous and cancerous lesions by comparing the gene expression of stem-like cells in diseased tissues with normal stem cells |
| Entrez ID | Symbol | Replicates | Species | Organ | Tissue | Adj P-value | Log2FC | Malignancy |
| 85359 | DGCR6L | C30 | Human | Oral cavity | OSCC | 6.96e-59 | 2.66e+00 | 0.3055 |
| 85359 | DGCR6L | C38 | Human | Oral cavity | OSCC | 8.53e-15 | 1.60e+00 | 0.172 |
| 85359 | DGCR6L | C43 | Human | Oral cavity | OSCC | 6.70e-54 | 1.01e+00 | 0.1704 |
| 85359 | DGCR6L | C46 | Human | Oral cavity | OSCC | 1.29e-51 | 1.26e+00 | 0.1673 |
| 85359 | DGCR6L | C51 | Human | Oral cavity | OSCC | 2.85e-31 | 1.62e+00 | 0.2674 |
| 85359 | DGCR6L | C57 | Human | Oral cavity | OSCC | 4.22e-10 | 7.10e-01 | 0.1679 |
| 85359 | DGCR6L | C06 | Human | Oral cavity | OSCC | 1.91e-08 | 1.68e+00 | 0.2699 |
| 85359 | DGCR6L | C07 | Human | Oral cavity | OSCC | 1.70e-06 | 1.44e+00 | 0.2491 |
| 85359 | DGCR6L | C08 | Human | Oral cavity | OSCC | 2.95e-61 | 1.27e+00 | 0.1919 |
| 85359 | DGCR6L | C09 | Human | Oral cavity | OSCC | 1.18e-12 | 7.41e-01 | 0.1431 |
| 85359 | DGCR6L | LN22 | Human | Oral cavity | OSCC | 8.92e-13 | 1.36e+00 | 0.1733 |
| 85359 | DGCR6L | LN38 | Human | Oral cavity | OSCC | 2.42e-05 | 1.41e+00 | 0.168 |
| 85359 | DGCR6L | LN46 | Human | Oral cavity | OSCC | 6.78e-35 | 1.36e+00 | 0.1666 |
| 85359 | DGCR6L | LP15 | Human | Oral cavity | LP | 1.57e-13 | 1.91e+00 | 0.2174 |
| 85359 | DGCR6L | LP17 | Human | Oral cavity | LP | 1.39e-06 | 1.22e+00 | 0.2349 |
| 85359 | DGCR6L | SYSMH1 | Human | Oral cavity | OSCC | 3.38e-16 | 4.21e-01 | 0.1127 |
| 85359 | DGCR6L | SYSMH2 | Human | Oral cavity | OSCC | 2.63e-42 | 1.67e+00 | 0.2326 |
| 85359 | DGCR6L | SYSMH3 | Human | Oral cavity | OSCC | 2.22e-22 | 7.21e-01 | 0.2442 |
| 85359 | DGCR6L | SYSMH4 | Human | Oral cavity | OSCC | 3.84e-04 | 2.48e-01 | 0.1226 |
| 85359 | DGCR6L | SYSMH5 | Human | Oral cavity | OSCC | 3.29e-13 | 4.09e-01 | 0.0647 |
| Page: 1 2 3 4 5 6 7 8 |
| Tissue | Expression Dynamics | Abbreviation |
| Breast | 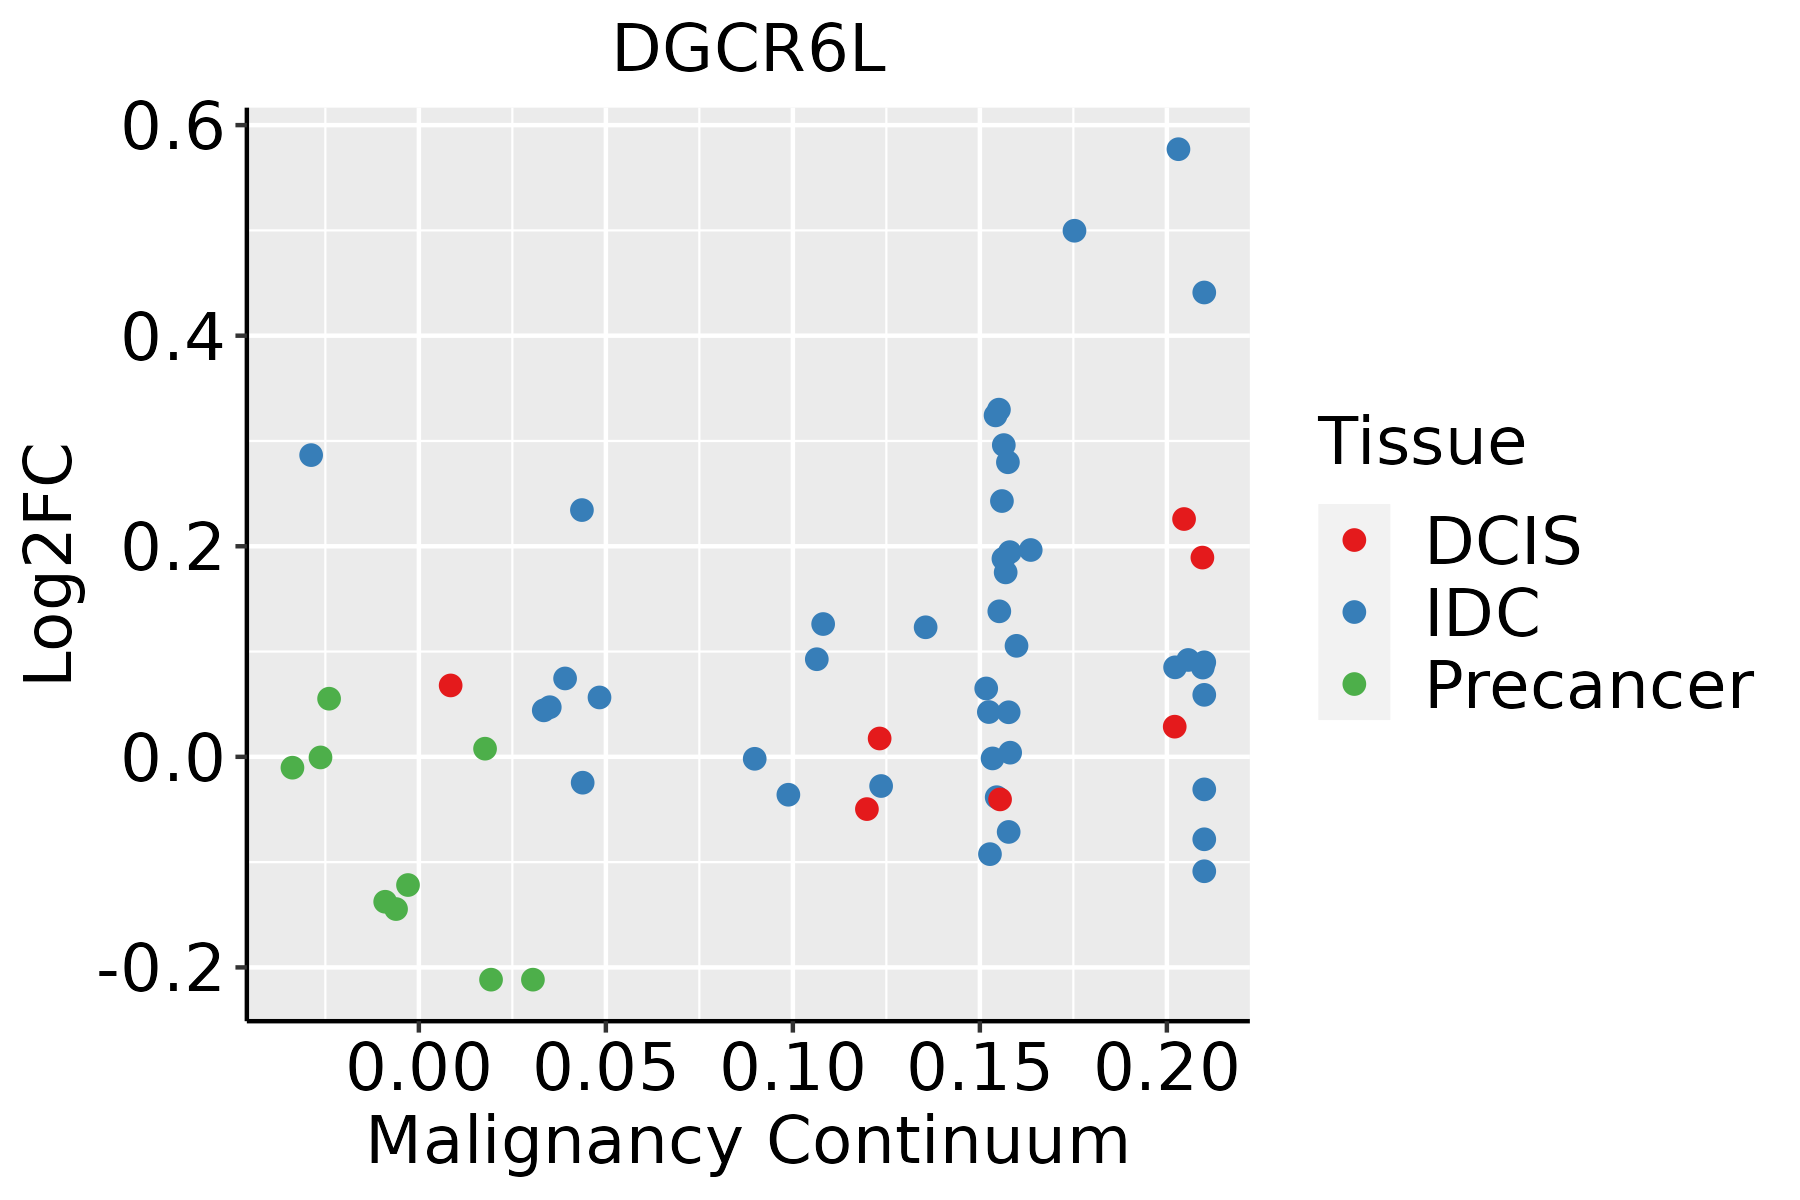 | IDC: Invasive ductal carcinoma |
| DCIS: Ductal carcinoma in situ | ||
| Precancer(BRCA1-mut): Precancerous lesion from BRCA1 mutation carriers | ||
| Esophagus | 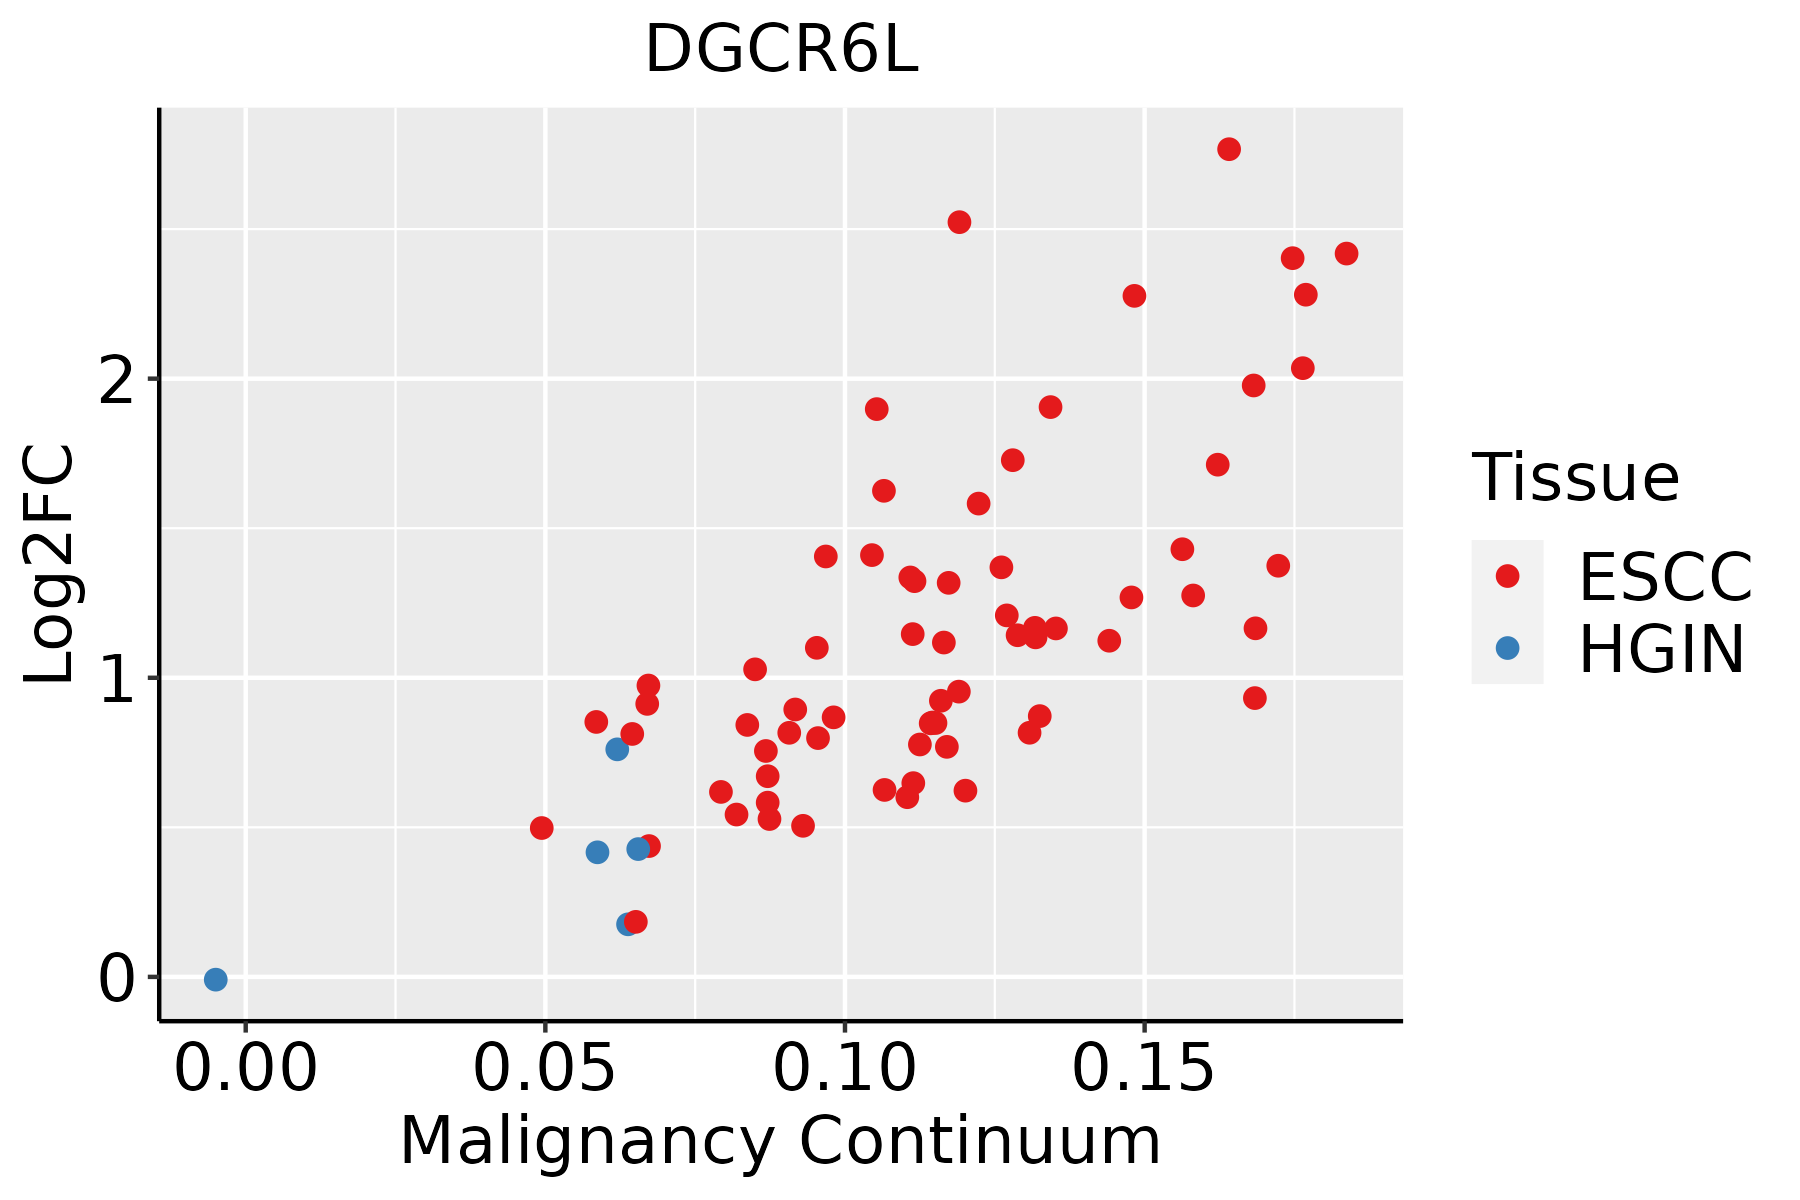 | ESCC: Esophageal squamous cell carcinoma |
| HGIN: High-grade intraepithelial neoplasias | ||
| LGIN: Low-grade intraepithelial neoplasias | ||
| Liver | 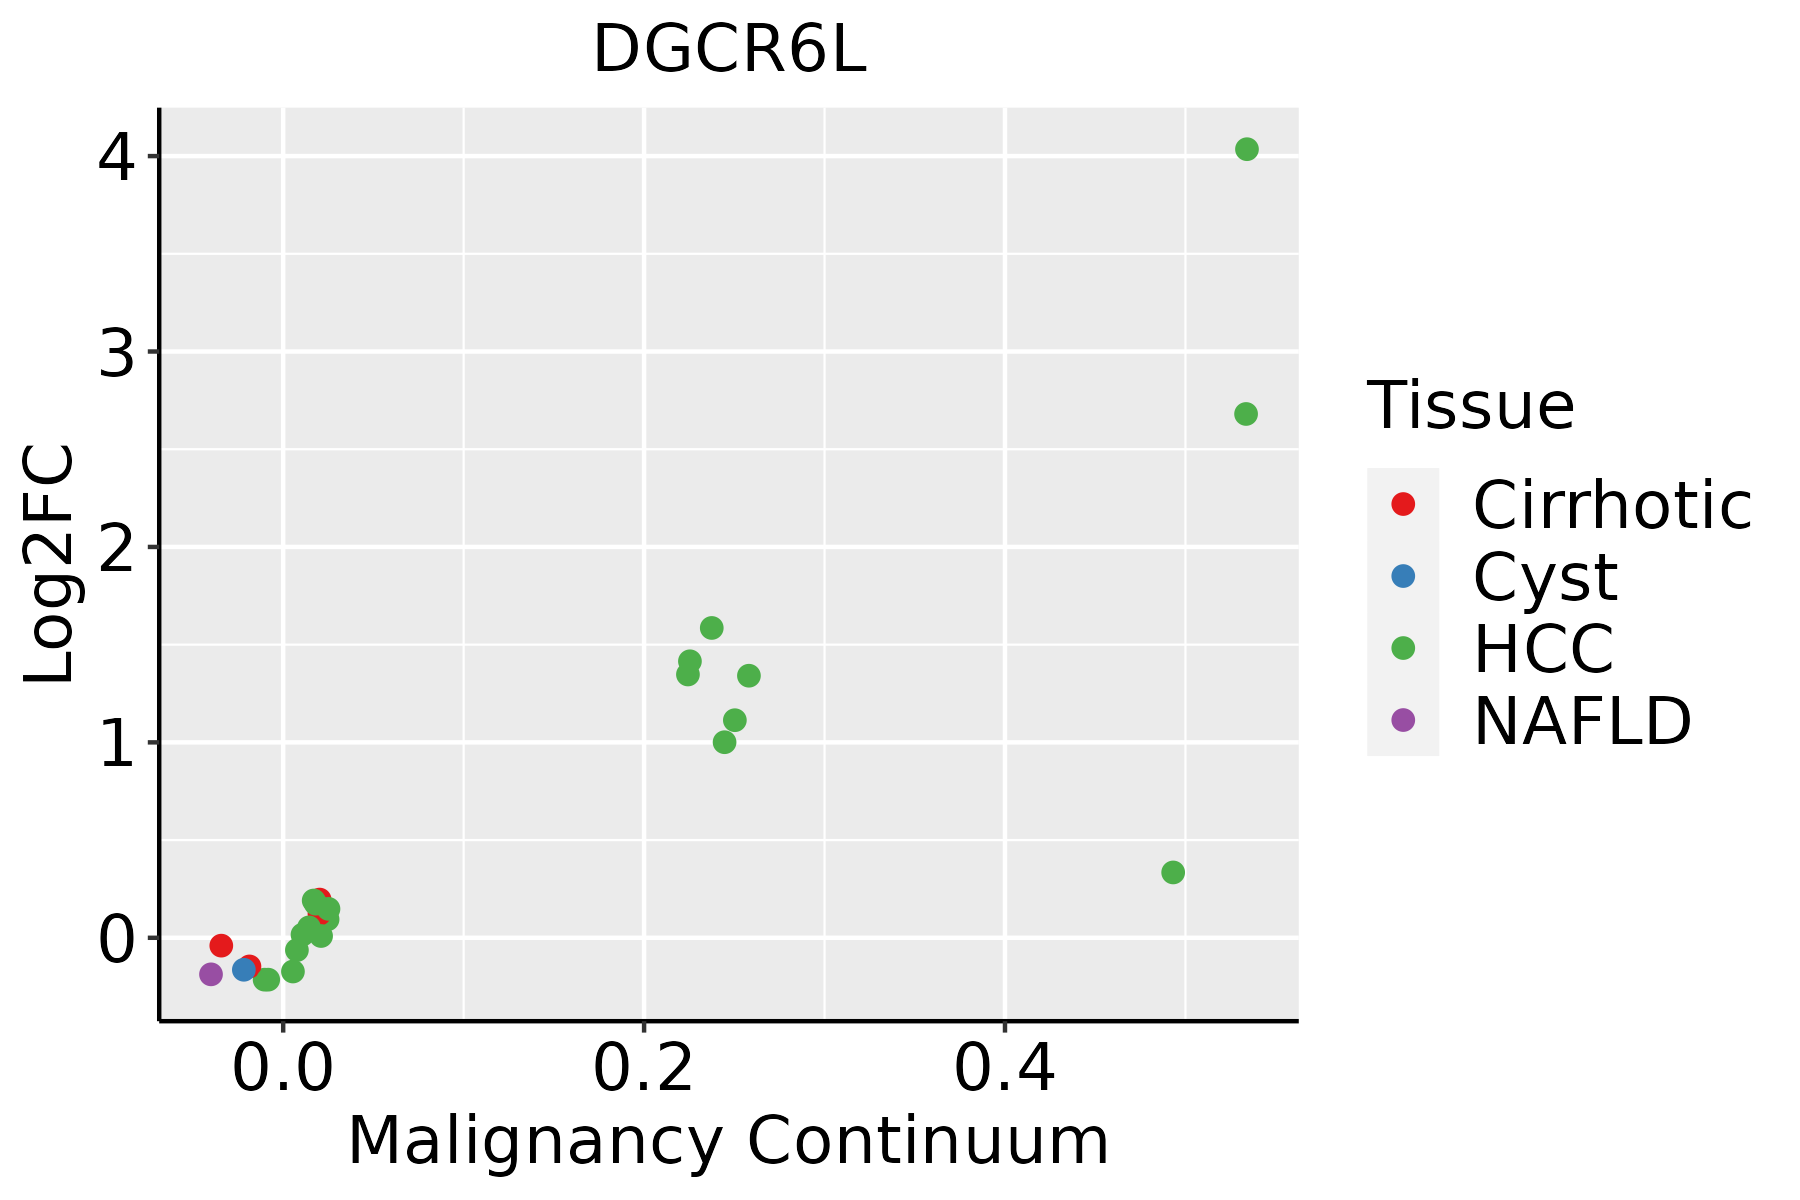 | HCC: Hepatocellular carcinoma |
| NAFLD: Non-alcoholic fatty liver disease | ||
| Oral Cavity | 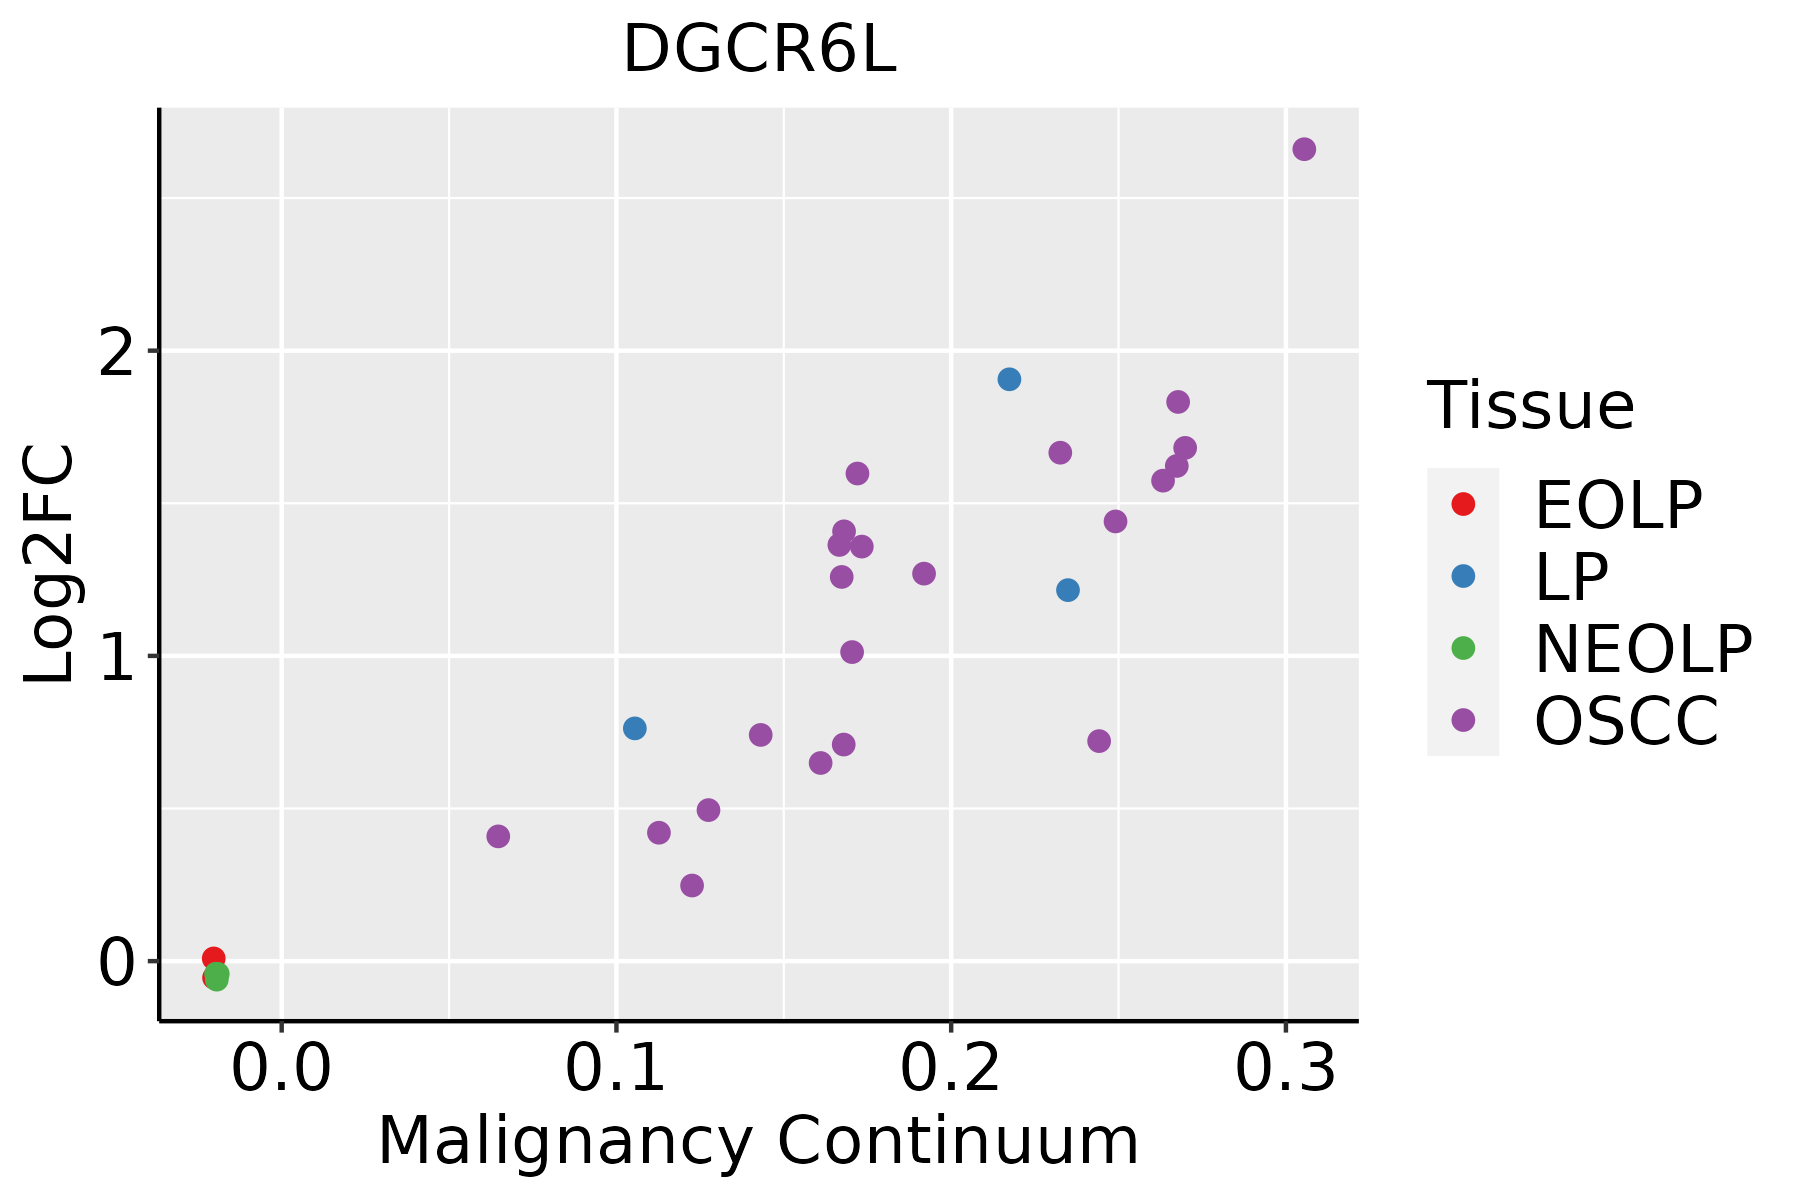 | EOLP: Erosive Oral lichen planus |
| LP: leukoplakia | ||
| NEOLP: Non-erosive oral lichen planus | ||
| OSCC: Oral squamous cell carcinoma | ||
| Prostate |  | BPH: Benign Prostatic Hyperplasia |
| Skin | 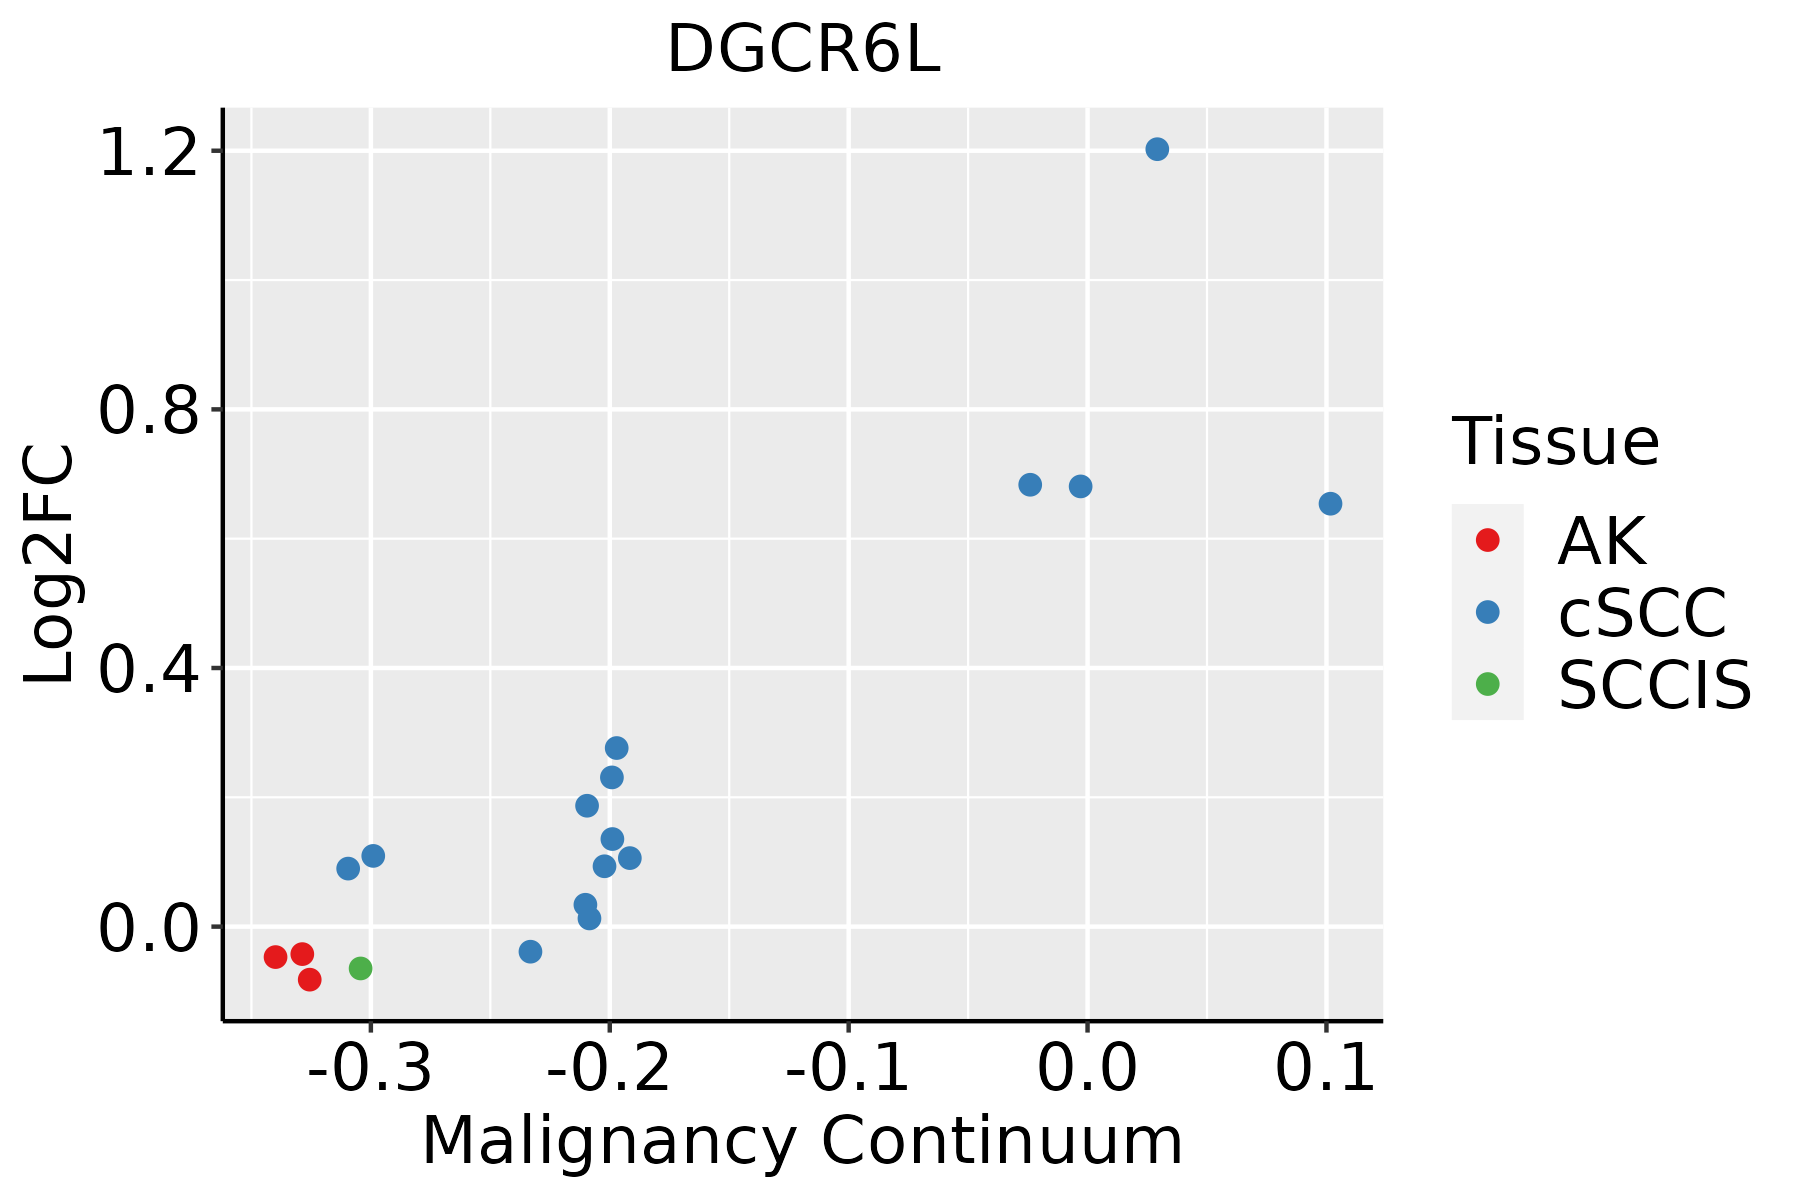 | AK: Actinic keratosis |
| cSCC: Cutaneous squamous cell carcinoma | ||
| SCCIS:squamous cell carcinoma in situ | ||
| Thyroid | 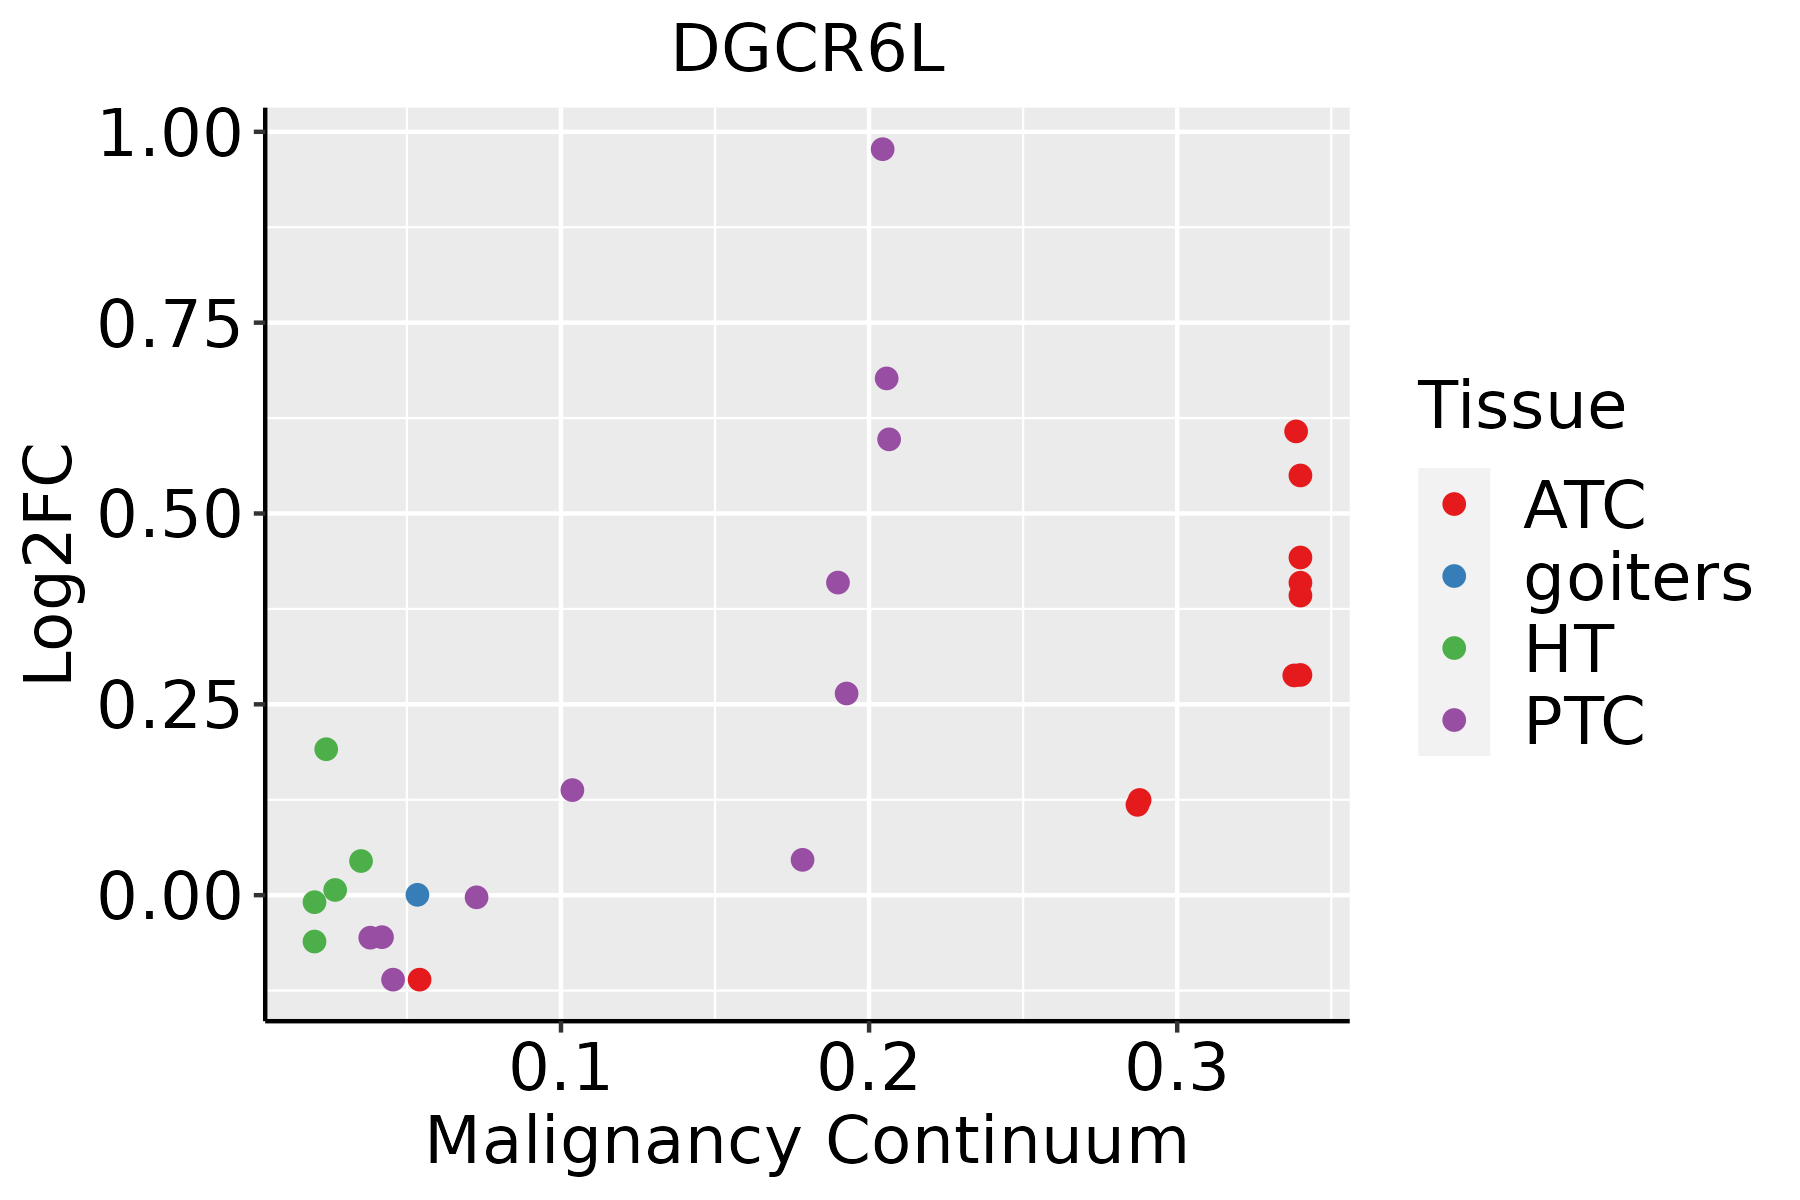 | ATC: Anaplastic thyroid cancer |
| HT: Hashimoto's thyroiditis | ||
| PTC: Papillary thyroid cancer |
| ∗log2FC in expression of this searched gene in stem-like cells from each diseased tissue sample relative to stem-like cells in normal samples in each tissue plotted against the malignancy continuum. Samples are colored based on if they are from different disease stage. |
Top |
Malignant transformation related pathway analysis |
| Find out the enriched GO biological processes and KEGG pathways involved in transition from healthy to precancer to cancer |
| Tissue | Disease Stage | Enriched GO biological Processes |
| Colorectum | AD |  |
| Colorectum | SER |  |
| Colorectum | MSS |  |
| Colorectum | MSI-H |  |
| Colorectum | FAP |  |
| ∗Top 15 enriched GO BP terms are showed in the bar plot of each disease state in each tissue. Each row represents a significant GO biological process which is colored according to the -log10(p.adjust). |
| Page: 1 2 3 4 5 6 7 8 9 |
| GO ID | Tissue | Disease Stage | Description | Gene Ratio | Bg Ratio | pvalue | p.adjust | Count |
| Page: 1 |
| Pathway ID | Tissue | Disease Stage | Description | Gene Ratio | Bg Ratio | pvalue | p.adjust | qvalue | Count |
| Page: 1 |
Top |
Cell-cell communication analysis |
| Identification of potential cell-cell interactions between two cell types and their ligand-receptor pairs for different disease states |
| Ligand | Receptor | LRpair | Pathway | Tissue | Disease Stage |
| Page: 1 |
Top |
Single-cell gene regulatory network inference analysis |
| Find out the significant the regulons (TFs) and the target genes of each regulon across cell types for different disease states |
| TF | Cell Type | Tissue | Disease Stage | Target Gene | RSS | Regulon Activity |
| ∗The dot plots of a searched regulon are shown for all cell subpopulations in each disease state of each tissue based on the regulon specific score inferred using pySCENIC and by calculating the average expression. |
| Page: 1 |
Top |
Somatic mutation of malignant transformation related genes |
| Annotation of somatic variants for genes involved in malignant transformation |
| Hugo Symbol | Variant Class | Variant Classification | dbSNP RS | HGVSc | HGVSp | HGVSp Short | SWISSPROT | BIOTYPE | SIFT | PolyPhen | Tumor Sample Barcode | Tissue | Histology | Sex | Age | Stage | Therapy Types | Drugs | Outcome |
| DGCR6L | SNV | Missense_Mutation | novel | c.492N>A | p.Phe164Leu | p.F164L | Q9BY27 | protein_coding | deleterious(0) | probably_damaging(0.95) | TCGA-2W-A8YY-01 | Cervix | cervical & endocervical cancer | Female | <65 | I/II | Chemotherapy | cisplatin | CR |
| DGCR6L | SNV | Missense_Mutation | novel | c.485N>T | p.Ala162Val | p.A162V | Q9BY27 | protein_coding | deleterious(0) | probably_damaging(0.983) | TCGA-A5-A2K3-01 | Endometrium | uterine corpus endometrioid carcinoma | Female | >=65 | I/II | Chemotherapy | carboplatin | SD |
| DGCR6L | SNV | Missense_Mutation | novel | c.492N>A | p.Phe164Leu | p.F164L | Q9BY27 | protein_coding | deleterious(0) | probably_damaging(0.95) | TCGA-AJ-A5DW-01 | Endometrium | uterine corpus endometrioid carcinoma | Female | <65 | I/II | Unknown | Unknown | SD |
| DGCR6L | SNV | Missense_Mutation | rs758170132 | c.476C>T | p.Ala159Val | p.A159V | Q9BY27 | protein_coding | deleterious(0.02) | probably_damaging(0.984) | TCGA-AP-A059-01 | Endometrium | uterine corpus endometrioid carcinoma | Female | >=65 | I/II | Unknown | Unknown | SD |
| DGCR6L | SNV | Missense_Mutation | rs143957631 | c.575N>A | p.Arg192Gln | p.R192Q | Q9BY27 | protein_coding | tolerated(1) | benign(0) | TCGA-B5-A0K9-01 | Endometrium | uterine corpus endometrioid carcinoma | Female | >=65 | I/II | Unknown | Unknown | SD |
| DGCR6L | SNV | Missense_Mutation | rs145876189 | c.439N>T | p.Arg147Trp | p.R147W | Q9BY27 | protein_coding | deleterious(0.03) | probably_damaging(0.993) | TCGA-EY-A1GU-01 | Endometrium | uterine corpus endometrioid carcinoma | Female | >=65 | I/II | Unknown | Unknown | SD |
| DGCR6L | SNV | Missense_Mutation | rs758170132 | c.476N>T | p.Ala159Val | p.A159V | Q9BY27 | protein_coding | deleterious(0.02) | probably_damaging(0.984) | TCGA-FI-A2D5-01 | Endometrium | uterine corpus endometrioid carcinoma | Female | <65 | III/IV | Chemotherapy | carboplatinum | PD |
| DGCR6L | SNV | Missense_Mutation | rs573329481 | c.461N>A | p.Ser154Asn | p.S154N | Q9BY27 | protein_coding | tolerated(0.24) | probably_damaging(0.95) | TCGA-CC-5261-01 | Liver | liver hepatocellular carcinoma | Male | <65 | I/II | Unknown | Unknown | SD |
| DGCR6L | SNV | Missense_Mutation | c.394G>A | p.Glu132Lys | p.E132K | Q9BY27 | protein_coding | tolerated(0.16) | probably_damaging(0.973) | TCGA-50-6590-01 | Lung | lung adenocarcinoma | Female | >=65 | I/II | Chemotherapy | paclitaxel | CR |
| Page: 1 |
Top |
Related drugs of malignant transformation related genes |
| Identification of chemicals and drugs interact with genes involved in malignant transfromation |
| (DGIdb 4.0) |
| Entrez ID | Symbol | Category | Interaction Types | Drug Claim Name | Drug Name | PMIDs |
| Page: 1 |

Copyright 2023-Present -The University of Texas Health Science Center at Houston |