
|
|||||
|
 | |
| |
| |
| |
| |
| |
|
Gene: DCTN2 |
Gene summary for DCTN2 |
| Gene information | Species | Human | Gene symbol | DCTN2 | Gene ID | 10540 |
| Gene name | dynactin subunit 2 | |
| Gene Alias | DCTN50 | |
| Cytomap | 12q13.3 | |
| Gene Type | protein-coding | GO ID | GO:0000070 | UniProtAcc | Q13561 |
Top |
Malignant transformation analysis |
| Identification of the aberrant gene expression in precancerous and cancerous lesions by comparing the gene expression of stem-like cells in diseased tissues with normal stem cells |
| Entrez ID | Symbol | Replicates | Species | Organ | Tissue | Adj P-value | Log2FC | Malignancy |
| 10540 | DCTN2 | C38 | Human | Oral cavity | OSCC | 2.30e-14 | 1.70e+00 | 0.172 |
| 10540 | DCTN2 | C43 | Human | Oral cavity | OSCC | 7.41e-60 | 1.22e+00 | 0.1704 |
| 10540 | DCTN2 | C46 | Human | Oral cavity | OSCC | 2.00e-65 | 1.33e+00 | 0.1673 |
| 10540 | DCTN2 | C51 | Human | Oral cavity | OSCC | 8.47e-25 | 1.58e+00 | 0.2674 |
| 10540 | DCTN2 | C57 | Human | Oral cavity | OSCC | 9.49e-26 | 1.03e+00 | 0.1679 |
| 10540 | DCTN2 | C06 | Human | Oral cavity | OSCC | 1.31e-14 | 2.05e+00 | 0.2699 |
| 10540 | DCTN2 | C07 | Human | Oral cavity | OSCC | 9.26e-08 | 2.13e+00 | 0.2491 |
| 10540 | DCTN2 | C08 | Human | Oral cavity | OSCC | 1.39e-57 | 1.48e+00 | 0.1919 |
| 10540 | DCTN2 | C09 | Human | Oral cavity | OSCC | 3.52e-10 | 5.00e-01 | 0.1431 |
| 10540 | DCTN2 | LN22 | Human | Oral cavity | OSCC | 1.68e-09 | 1.43e+00 | 0.1733 |
| 10540 | DCTN2 | LN38 | Human | Oral cavity | OSCC | 3.89e-08 | 1.68e+00 | 0.168 |
| 10540 | DCTN2 | LN46 | Human | Oral cavity | OSCC | 1.90e-15 | 8.18e-01 | 0.1666 |
| 10540 | DCTN2 | LP15 | Human | Oral cavity | LP | 3.62e-11 | 1.85e+00 | 0.2174 |
| 10540 | DCTN2 | LP17 | Human | Oral cavity | LP | 4.18e-12 | 1.31e+00 | 0.2349 |
| 10540 | DCTN2 | SYSMH1 | Human | Oral cavity | OSCC | 3.26e-31 | 6.90e-01 | 0.1127 |
| 10540 | DCTN2 | SYSMH2 | Human | Oral cavity | OSCC | 4.10e-21 | 9.35e-01 | 0.2326 |
| 10540 | DCTN2 | SYSMH3 | Human | Oral cavity | OSCC | 3.27e-31 | 1.06e+00 | 0.2442 |
| 10540 | DCTN2 | SYSMH4 | Human | Oral cavity | OSCC | 8.46e-03 | 2.19e-01 | 0.1226 |
| 10540 | DCTN2 | SYSMH5 | Human | Oral cavity | OSCC | 3.57e-10 | 5.36e-01 | 0.0647 |
| 10540 | DCTN2 | SYSMH6 | Human | Oral cavity | OSCC | 7.15e-16 | 5.68e-01 | 0.1275 |
| Page: 1 2 3 4 5 6 7 8 |
| Tissue | Expression Dynamics | Abbreviation |
| Colorectum (GSE201348) |  | FAP: Familial adenomatous polyposis |
| CRC: Colorectal cancer | ||
| Colorectum (HTA11) |  | AD: Adenomas |
| SER: Sessile serrated lesions | ||
| MSI-H: Microsatellite-high colorectal cancer | ||
| MSS: Microsatellite stable colorectal cancer | ||
| Esophagus |  | ESCC: Esophageal squamous cell carcinoma |
| HGIN: High-grade intraepithelial neoplasias | ||
| LGIN: Low-grade intraepithelial neoplasias | ||
| Liver | 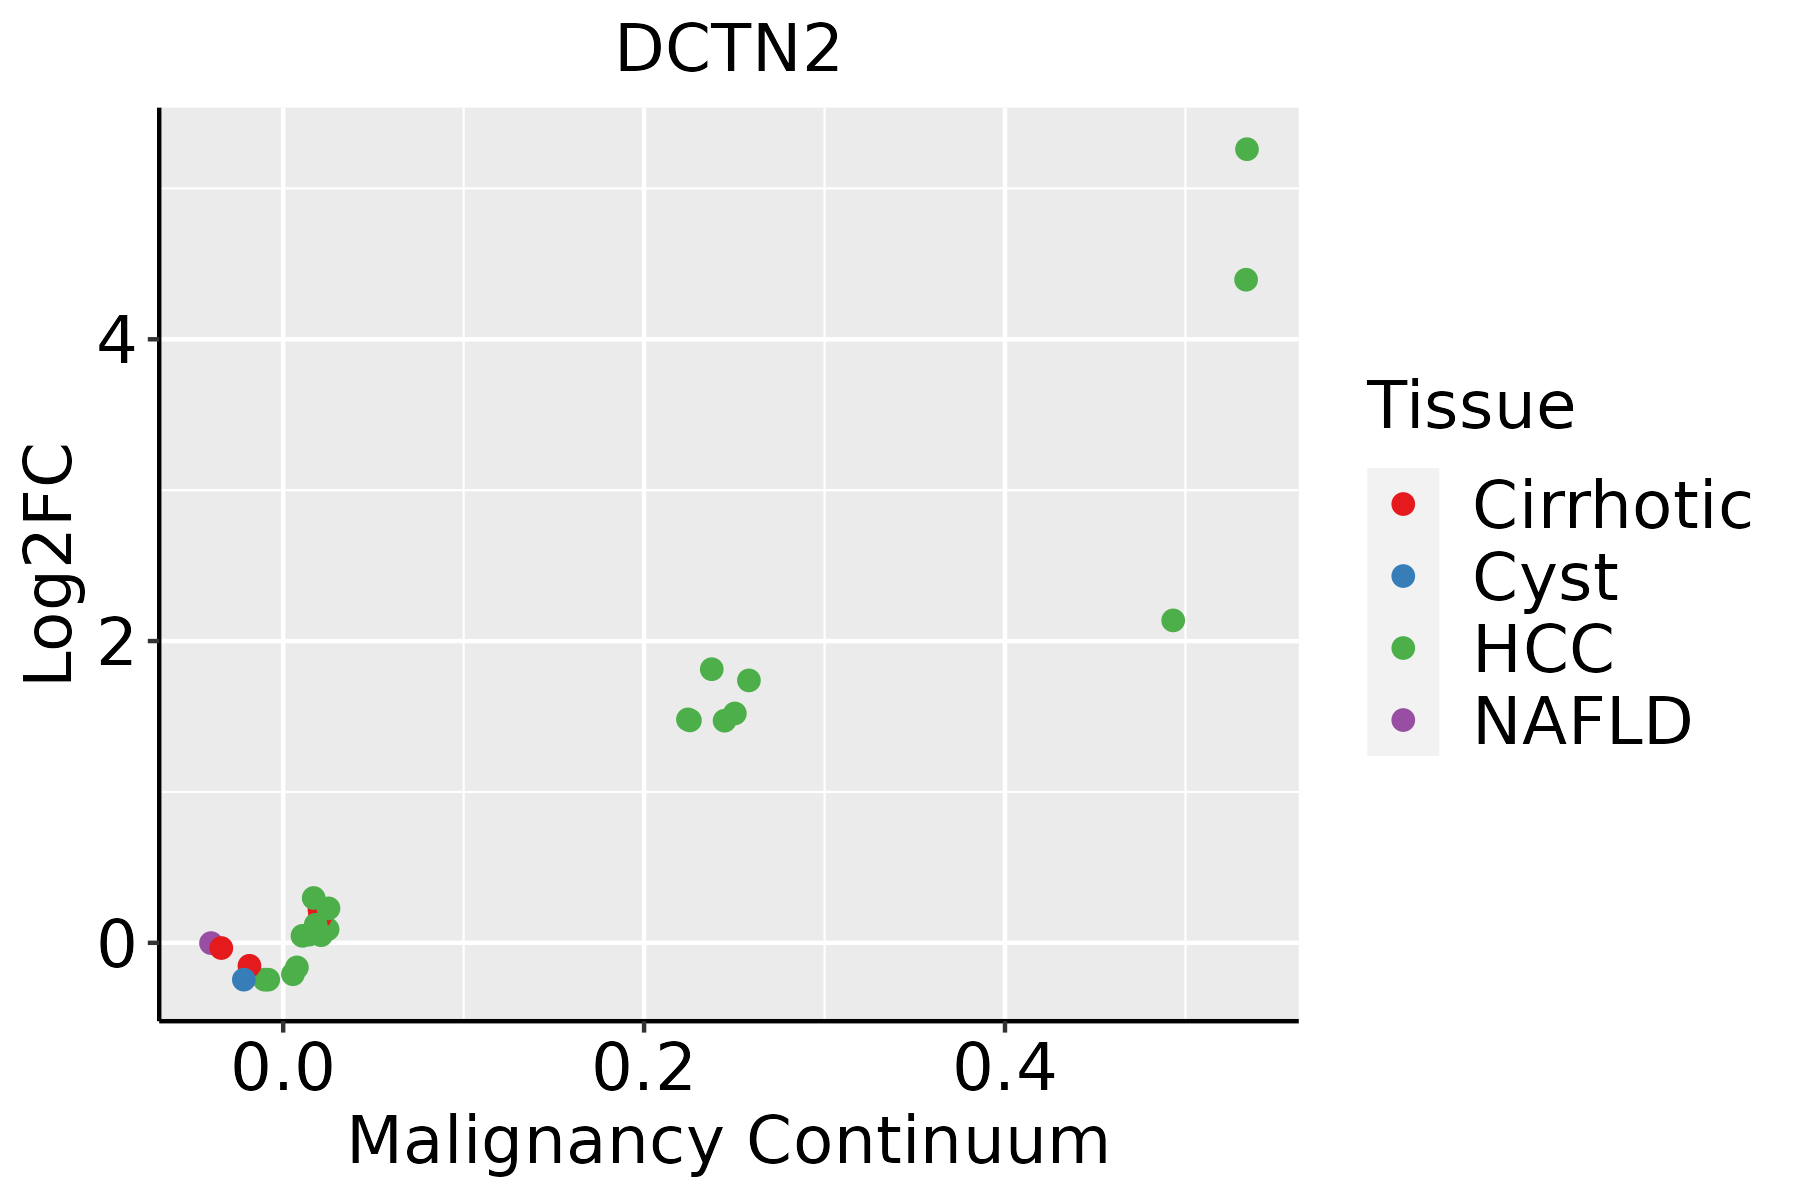 | HCC: Hepatocellular carcinoma |
| NAFLD: Non-alcoholic fatty liver disease | ||
| Oral Cavity |  | EOLP: Erosive Oral lichen planus |
| LP: leukoplakia | ||
| NEOLP: Non-erosive oral lichen planus | ||
| OSCC: Oral squamous cell carcinoma | ||
| Skin | 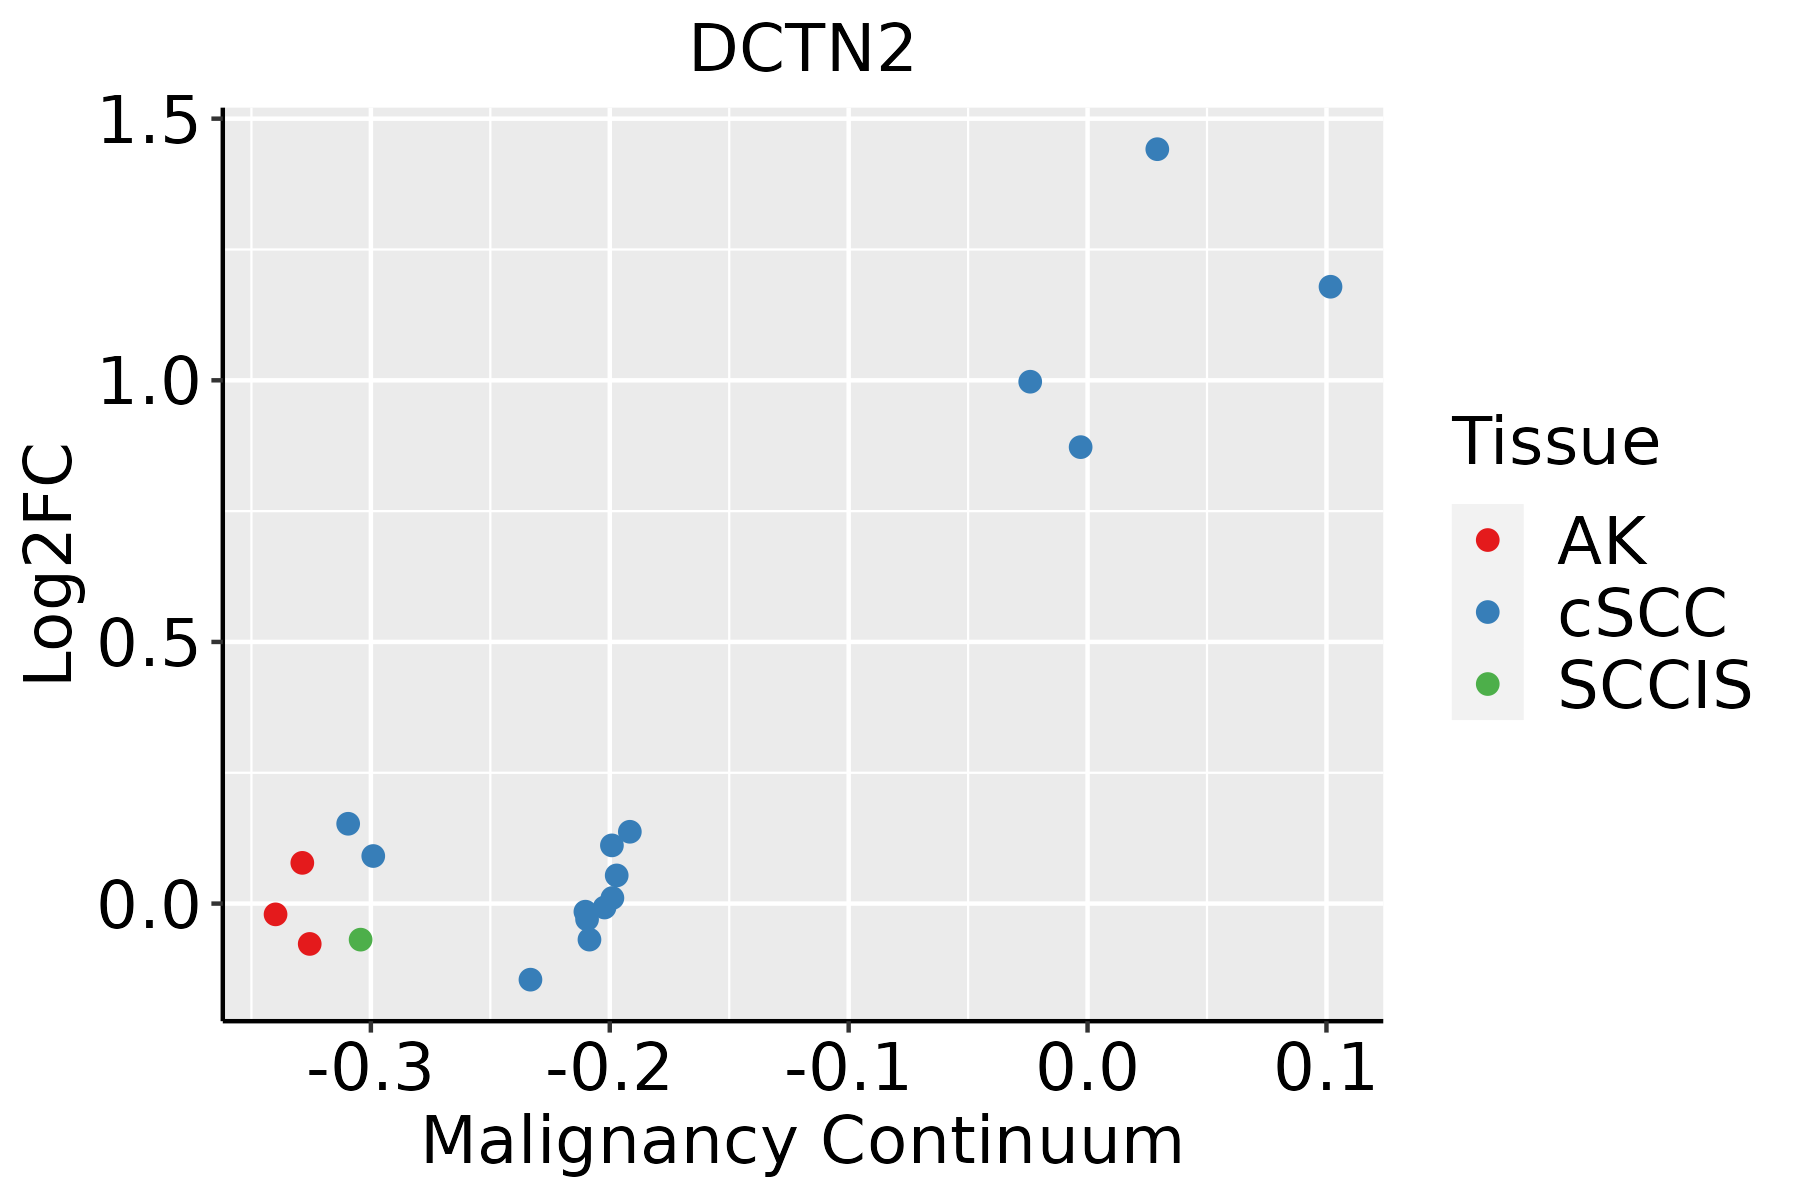 | AK: Actinic keratosis |
| cSCC: Cutaneous squamous cell carcinoma | ||
| SCCIS:squamous cell carcinoma in situ | ||
| Thyroid |  | ATC: Anaplastic thyroid cancer |
| HT: Hashimoto's thyroiditis | ||
| PTC: Papillary thyroid cancer |
| ∗log2FC in expression of this searched gene in stem-like cells from each diseased tissue sample relative to stem-like cells in normal samples in each tissue plotted against the malignancy continuum. Samples are colored based on if they are from different disease stage. |
Top |
Malignant transformation related pathway analysis |
| Find out the enriched GO biological processes and KEGG pathways involved in transition from healthy to precancer to cancer |
| Tissue | Disease Stage | Enriched GO biological Processes |
| Colorectum | AD |  |
| Colorectum | SER |  |
| Colorectum | MSS |  |
| Colorectum | MSI-H |  |
| Colorectum | FAP |  |
| ∗Top 15 enriched GO BP terms are showed in the bar plot of each disease state in each tissue. Each row represents a significant GO biological process which is colored according to the -log10(p.adjust). |
| Page: 1 2 3 4 5 6 7 8 9 |
| GO ID | Tissue | Disease Stage | Description | Gene Ratio | Bg Ratio | pvalue | p.adjust | Count |
| GO:0051656 | Colorectum | AD | establishment of organelle localization | 131/3918 | 390/18723 | 3.00e-09 | 2.06e-07 | 131 |
| GO:0051650 | Colorectum | AD | establishment of vesicle localization | 57/3918 | 161/18723 | 1.47e-05 | 3.15e-04 | 57 |
| GO:0051648 | Colorectum | AD | vesicle localization | 59/3918 | 177/18723 | 7.83e-05 | 1.25e-03 | 59 |
| GO:0071539 | Colorectum | AD | protein localization to centrosome | 16/3918 | 33/18723 | 3.86e-04 | 4.41e-03 | 16 |
| GO:0007051 | Colorectum | AD | spindle organization | 58/3918 | 184/18723 | 4.71e-04 | 5.20e-03 | 58 |
| GO:1902850 | Colorectum | AD | microtubule cytoskeleton organization involved in mitosis | 48/3918 | 147/18723 | 5.87e-04 | 6.21e-03 | 48 |
| GO:1905508 | Colorectum | AD | protein localization to microtubule organizing center | 16/3918 | 35/18723 | 8.76e-04 | 8.51e-03 | 16 |
| GO:0007052 | Colorectum | AD | mitotic spindle organization | 40/3918 | 120/18723 | 1.03e-03 | 9.61e-03 | 40 |
| GO:0140014 | Colorectum | AD | mitotic nuclear division | 78/3918 | 287/18723 | 6.48e-03 | 4.05e-02 | 78 |
| GO:00516561 | Colorectum | SER | establishment of organelle localization | 100/2897 | 390/18723 | 1.11e-07 | 6.79e-06 | 100 |
| GO:00516501 | Colorectum | SER | establishment of vesicle localization | 42/2897 | 161/18723 | 3.38e-04 | 5.35e-03 | 42 |
| GO:00516481 | Colorectum | SER | vesicle localization | 43/2897 | 177/18723 | 1.41e-03 | 1.53e-02 | 43 |
| GO:00516562 | Colorectum | MSS | establishment of organelle localization | 115/3467 | 390/18723 | 7.30e-08 | 3.67e-06 | 115 |
| GO:00516502 | Colorectum | MSS | establishment of vesicle localization | 51/3467 | 161/18723 | 3.92e-05 | 7.45e-04 | 51 |
| GO:00715391 | Colorectum | MSS | protein localization to centrosome | 16/3467 | 33/18723 | 8.66e-05 | 1.40e-03 | 16 |
| GO:00516482 | Colorectum | MSS | vesicle localization | 53/3467 | 177/18723 | 1.47e-04 | 2.16e-03 | 53 |
| GO:19055081 | Colorectum | MSS | protein localization to microtubule organizing center | 16/3467 | 35/18723 | 2.07e-04 | 2.89e-03 | 16 |
| GO:00070511 | Colorectum | MSS | spindle organization | 53/3467 | 184/18723 | 4.23e-04 | 5.19e-03 | 53 |
| GO:19028501 | Colorectum | MSS | microtubule cytoskeleton organization involved in mitosis | 44/3467 | 147/18723 | 5.17e-04 | 5.98e-03 | 44 |
| GO:00070521 | Colorectum | MSS | mitotic spindle organization | 36/3467 | 120/18723 | 1.52e-03 | 1.39e-02 | 36 |
| Page: 1 2 3 4 5 6 7 8 9 10 |
| Pathway ID | Tissue | Disease Stage | Description | Gene Ratio | Bg Ratio | pvalue | p.adjust | qvalue | Count |
| hsa05016 | Colorectum | AD | Huntington disease | 147/2092 | 306/8465 | 1.93e-19 | 9.26e-18 | 5.91e-18 | 147 |
| hsa05014 | Colorectum | AD | Amyotrophic lateral sclerosis | 164/2092 | 364/8465 | 4.28e-18 | 1.27e-16 | 8.09e-17 | 164 |
| hsa05022 | Colorectum | AD | Pathways of neurodegeneration - multiple diseases | 201/2092 | 476/8465 | 4.54e-18 | 1.27e-16 | 8.09e-17 | 201 |
| hsa05132 | Colorectum | AD | Salmonella infection | 102/2092 | 249/8465 | 7.65e-09 | 1.28e-07 | 8.17e-08 | 102 |
| hsa04962 | Colorectum | AD | Vasopressin-regulated water reabsorption | 19/2092 | 44/8465 | 5.48e-03 | 2.48e-02 | 1.58e-02 | 19 |
| hsa050161 | Colorectum | AD | Huntington disease | 147/2092 | 306/8465 | 1.93e-19 | 9.26e-18 | 5.91e-18 | 147 |
| hsa050141 | Colorectum | AD | Amyotrophic lateral sclerosis | 164/2092 | 364/8465 | 4.28e-18 | 1.27e-16 | 8.09e-17 | 164 |
| hsa050221 | Colorectum | AD | Pathways of neurodegeneration - multiple diseases | 201/2092 | 476/8465 | 4.54e-18 | 1.27e-16 | 8.09e-17 | 201 |
| hsa051321 | Colorectum | AD | Salmonella infection | 102/2092 | 249/8465 | 7.65e-09 | 1.28e-07 | 8.17e-08 | 102 |
| hsa049621 | Colorectum | AD | Vasopressin-regulated water reabsorption | 19/2092 | 44/8465 | 5.48e-03 | 2.48e-02 | 1.58e-02 | 19 |
| hsa050162 | Colorectum | SER | Huntington disease | 127/1580 | 306/8465 | 3.29e-21 | 1.37e-19 | 9.92e-20 | 127 |
| hsa050222 | Colorectum | SER | Pathways of neurodegeneration - multiple diseases | 168/1580 | 476/8465 | 6.23e-19 | 2.07e-17 | 1.50e-17 | 168 |
| hsa050142 | Colorectum | SER | Amyotrophic lateral sclerosis | 138/1580 | 364/8465 | 9.89e-19 | 2.99e-17 | 2.17e-17 | 138 |
| hsa051322 | Colorectum | SER | Salmonella infection | 77/1580 | 249/8465 | 1.56e-06 | 2.35e-05 | 1.71e-05 | 77 |
| hsa050163 | Colorectum | SER | Huntington disease | 127/1580 | 306/8465 | 3.29e-21 | 1.37e-19 | 9.92e-20 | 127 |
| hsa050223 | Colorectum | SER | Pathways of neurodegeneration - multiple diseases | 168/1580 | 476/8465 | 6.23e-19 | 2.07e-17 | 1.50e-17 | 168 |
| hsa050143 | Colorectum | SER | Amyotrophic lateral sclerosis | 138/1580 | 364/8465 | 9.89e-19 | 2.99e-17 | 2.17e-17 | 138 |
| hsa051323 | Colorectum | SER | Salmonella infection | 77/1580 | 249/8465 | 1.56e-06 | 2.35e-05 | 1.71e-05 | 77 |
| hsa050164 | Colorectum | MSS | Huntington disease | 141/1875 | 306/8465 | 2.90e-21 | 1.62e-19 | 9.92e-20 | 141 |
| hsa050224 | Colorectum | MSS | Pathways of neurodegeneration - multiple diseases | 192/1875 | 476/8465 | 2.79e-20 | 1.04e-18 | 6.36e-19 | 192 |
| Page: 1 2 3 4 5 |
Top |
Cell-cell communication analysis |
| Identification of potential cell-cell interactions between two cell types and their ligand-receptor pairs for different disease states |
| Ligand | Receptor | LRpair | Pathway | Tissue | Disease Stage |
| Page: 1 |
Top |
Single-cell gene regulatory network inference analysis |
| Find out the significant the regulons (TFs) and the target genes of each regulon across cell types for different disease states |
| TF | Cell Type | Tissue | Disease Stage | Target Gene | RSS | Regulon Activity |
| ∗The dot plots of a searched regulon are shown for all cell subpopulations in each disease state of each tissue based on the regulon specific score inferred using pySCENIC and by calculating the average expression. |
| Page: 1 |
Top |
Somatic mutation of malignant transformation related genes |
| Annotation of somatic variants for genes involved in malignant transformation |
| Hugo Symbol | Variant Class | Variant Classification | dbSNP RS | HGVSc | HGVSp | HGVSp Short | SWISSPROT | BIOTYPE | SIFT | PolyPhen | Tumor Sample Barcode | Tissue | Histology | Sex | Age | Stage | Therapy Types | Drugs | Outcome |
| DCTN2 | SNV | Missense_Mutation | novel | c.669N>A | p.Phe223Leu | p.F223L | Q13561 | protein_coding | tolerated(0.24) | benign(0.245) | TCGA-AN-A046-01 | Breast | breast invasive carcinoma | Female | >=65 | I/II | Unknown | Unknown | SD |
| DCTN2 | SNV | Missense_Mutation | c.274N>A | p.Glu92Lys | p.E92K | Q13561 | protein_coding | deleterious(0) | probably_damaging(0.997) | TCGA-D8-A1JJ-01 | Breast | breast invasive carcinoma | Female | <65 | I/II | Chemotherapy | doxorubicine | SD | |
| DCTN2 | SNV | Missense_Mutation | c.1139N>G | p.Gln380Arg | p.Q380R | Q13561 | protein_coding | deleterious(0) | possibly_damaging(0.791) | TCGA-D8-A1XK-01 | Breast | breast invasive carcinoma | Female | <65 | I/II | Chemotherapy | doxorubicine+cyclophosphamide | SD | |
| DCTN2 | SNV | Missense_Mutation | novel | c.487N>A | p.Leu163Met | p.L163M | Q13561 | protein_coding | deleterious(0) | probably_damaging(0.999) | TCGA-2W-A8YY-01 | Cervix | cervical & endocervical cancer | Female | <65 | I/II | Chemotherapy | cisplatin | CR |
| DCTN2 | SNV | Missense_Mutation | rs374804015 | c.649N>T | p.Arg217Trp | p.R217W | Q13561 | protein_coding | deleterious(0) | probably_damaging(0.923) | TCGA-AA-3715-01 | Colorectum | colon adenocarcinoma | Male | >=65 | I/II | Unknown | Unknown | PD |
| DCTN2 | SNV | Missense_Mutation | rs141248212 | c.823N>A | p.Ala275Thr | p.A275T | Q13561 | protein_coding | tolerated(0.17) | benign(0.001) | TCGA-AA-3966-01 | Colorectum | colon adenocarcinoma | Female | >=65 | I/II | Unknown | Unknown | SD |
| DCTN2 | SNV | Missense_Mutation | novel | c.139N>C | p.Ser47Arg | p.S47R | Q13561 | protein_coding | deleterious(0) | probably_damaging(0.984) | TCGA-AA-3984-01 | Colorectum | colon adenocarcinoma | Female | <65 | I/II | Unknown | Unknown | SD |
| DCTN2 | SNV | Missense_Mutation | c.680C>T | p.Ala227Val | p.A227V | Q13561 | protein_coding | tolerated(0.08) | possibly_damaging(0.79) | TCGA-CK-5913-01 | Colorectum | colon adenocarcinoma | Female | <65 | I/II | Unknown | Unknown | SD | |
| DCTN2 | SNV | Missense_Mutation | c.467C>T | p.Ala156Val | p.A156V | Q13561 | protein_coding | deleterious(0.04) | benign(0.145) | TCGA-CM-4746-01 | Colorectum | colon adenocarcinoma | Male | <65 | I/II | Unknown | Unknown | SD | |
| DCTN2 | SNV | Missense_Mutation | novel | c.460N>A | p.Leu154Met | p.L154M | Q13561 | protein_coding | deleterious(0) | probably_damaging(0.999) | TCGA-T9-A92H-01 | Colorectum | colon adenocarcinoma | Male | >=65 | I/II | Unknown | Unknown | PD |
| Page: 1 2 3 4 |
Top |
Related drugs of malignant transformation related genes |
| Identification of chemicals and drugs interact with genes involved in malignant transfromation |
| (DGIdb 4.0) |
| Entrez ID | Symbol | Category | Interaction Types | Drug Claim Name | Drug Name | PMIDs |
| Page: 1 |

Copyright 2023-Present -The University of Texas Health Science Center at Houston |