
|
|||||
|
 | |
| |
| |
| |
| |
| |
|
Gene: COL6A2 |
Gene summary for COL6A2 |
| Gene information | Species | Human | Gene symbol | COL6A2 | Gene ID | 1292 |
| Gene name | collagen type VI alpha 2 chain | |
| Gene Alias | BTHLM1 | |
| Cytomap | 21q22.3 | |
| Gene Type | protein-coding | GO ID | GO:0007155 | UniProtAcc | P12110 |
Top |
Malignant transformation analysis |
| Identification of the aberrant gene expression in precancerous and cancerous lesions by comparing the gene expression of stem-like cells in diseased tissues with normal stem cells |
| Entrez ID | Symbol | Replicates | Species | Organ | Tissue | Adj P-value | Log2FC | Malignancy |
| 1292 | COL6A2 | cSCC_p8 | Human | Skin | cSCC | 2.66e-38 | -1.06e+00 | -0.1971 |
| 1292 | COL6A2 | cSCC_p9 | Human | Skin | cSCC | 4.94e-30 | -9.69e-01 | -0.1991 |
| 1292 | COL6A2 | PTC07 | Human | Thyroid | PTC | 3.49e-02 | 9.59e-02 | 0.2044 |
| 1292 | COL6A2 | ATC09 | Human | Thyroid | ATC | 3.53e-66 | 2.60e+00 | 0.2871 |
| 1292 | COL6A2 | ATC11 | Human | Thyroid | ATC | 1.49e-29 | 4.52e+00 | 0.3386 |
| 1292 | COL6A2 | ATC12 | Human | Thyroid | ATC | 6.55e-159 | 5.60e+00 | 0.34 |
| 1292 | COL6A2 | ATC13 | Human | Thyroid | ATC | 1.80e-117 | 3.36e+00 | 0.34 |
| 1292 | COL6A2 | ATC1 | Human | Thyroid | ATC | 1.37e-65 | 2.78e+00 | 0.2878 |
| 1292 | COL6A2 | ATC2 | Human | Thyroid | ATC | 6.85e-34 | 3.55e+00 | 0.34 |
| 1292 | COL6A2 | ATC3 | Human | Thyroid | ATC | 4.67e-44 | 4.74e+00 | 0.338 |
| 1292 | COL6A2 | ATC4 | Human | Thyroid | ATC | 1.21e-158 | 5.91e+00 | 0.34 |
| 1292 | COL6A2 | ATC5 | Human | Thyroid | ATC | 4.38e-135 | 3.48e+00 | 0.34 |
| Page: 1 2 3 4 5 6 |
| Tissue | Expression Dynamics | Abbreviation |
| Endometrium | 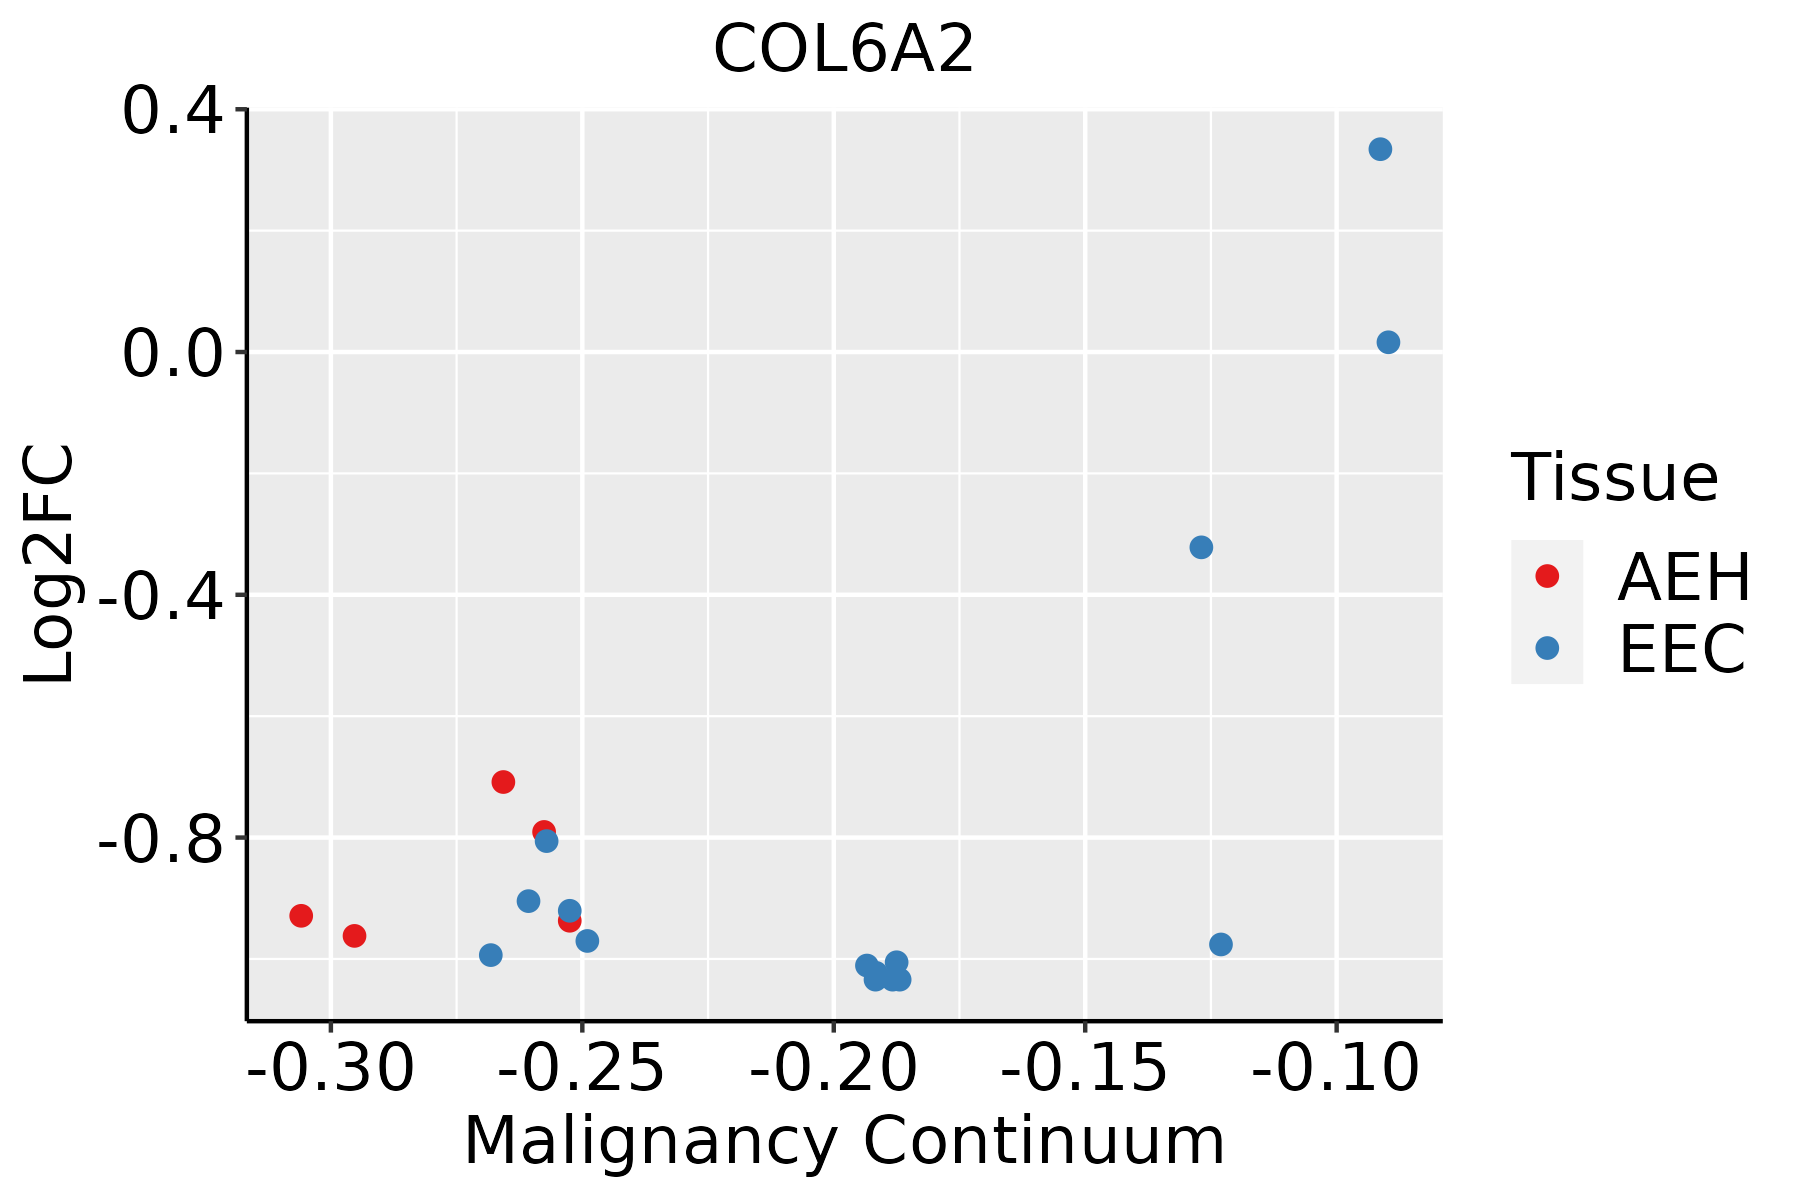 | AEH: Atypical endometrial hyperplasia |
| EEC: Endometrioid Cancer | ||
| Esophagus | 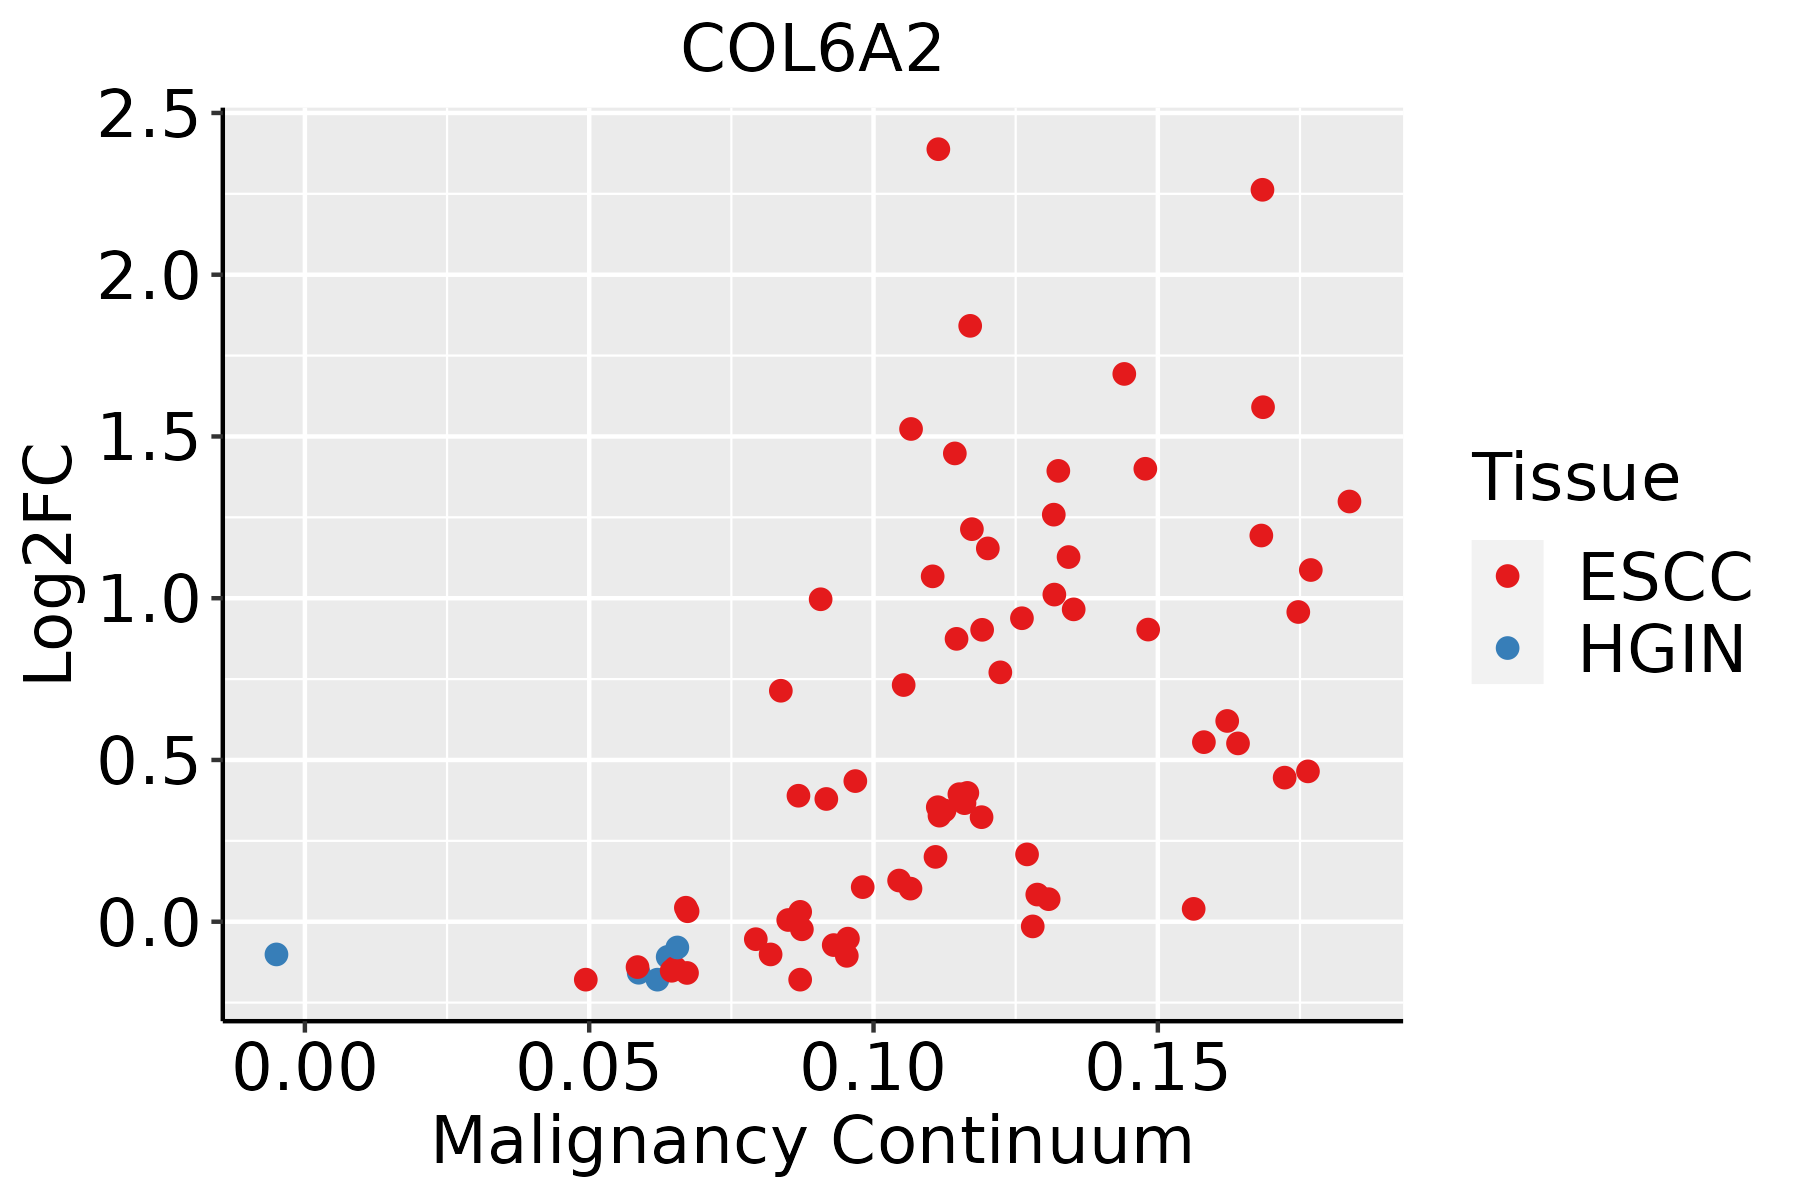 | ESCC: Esophageal squamous cell carcinoma |
| HGIN: High-grade intraepithelial neoplasias | ||
| LGIN: Low-grade intraepithelial neoplasias | ||
| Liver | 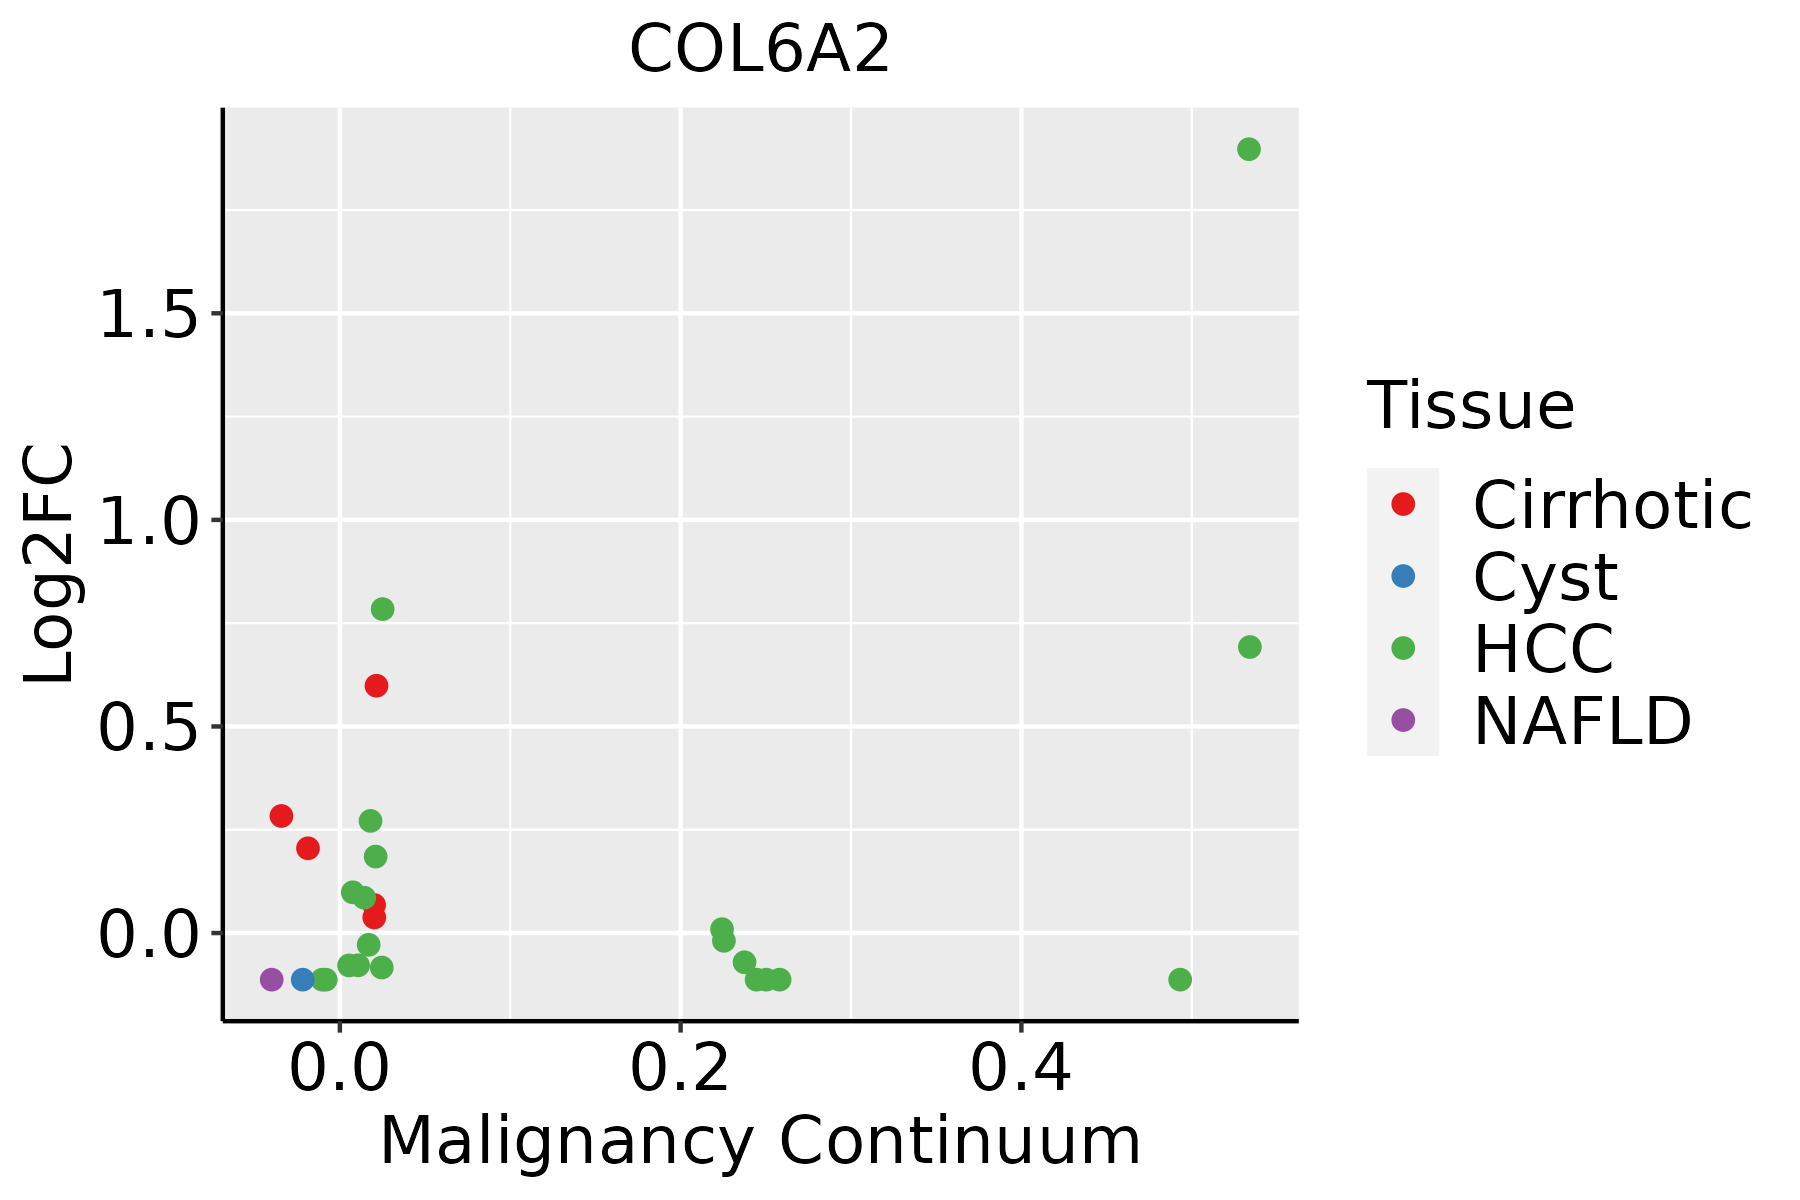 | HCC: Hepatocellular carcinoma |
| NAFLD: Non-alcoholic fatty liver disease | ||
| Oral Cavity | 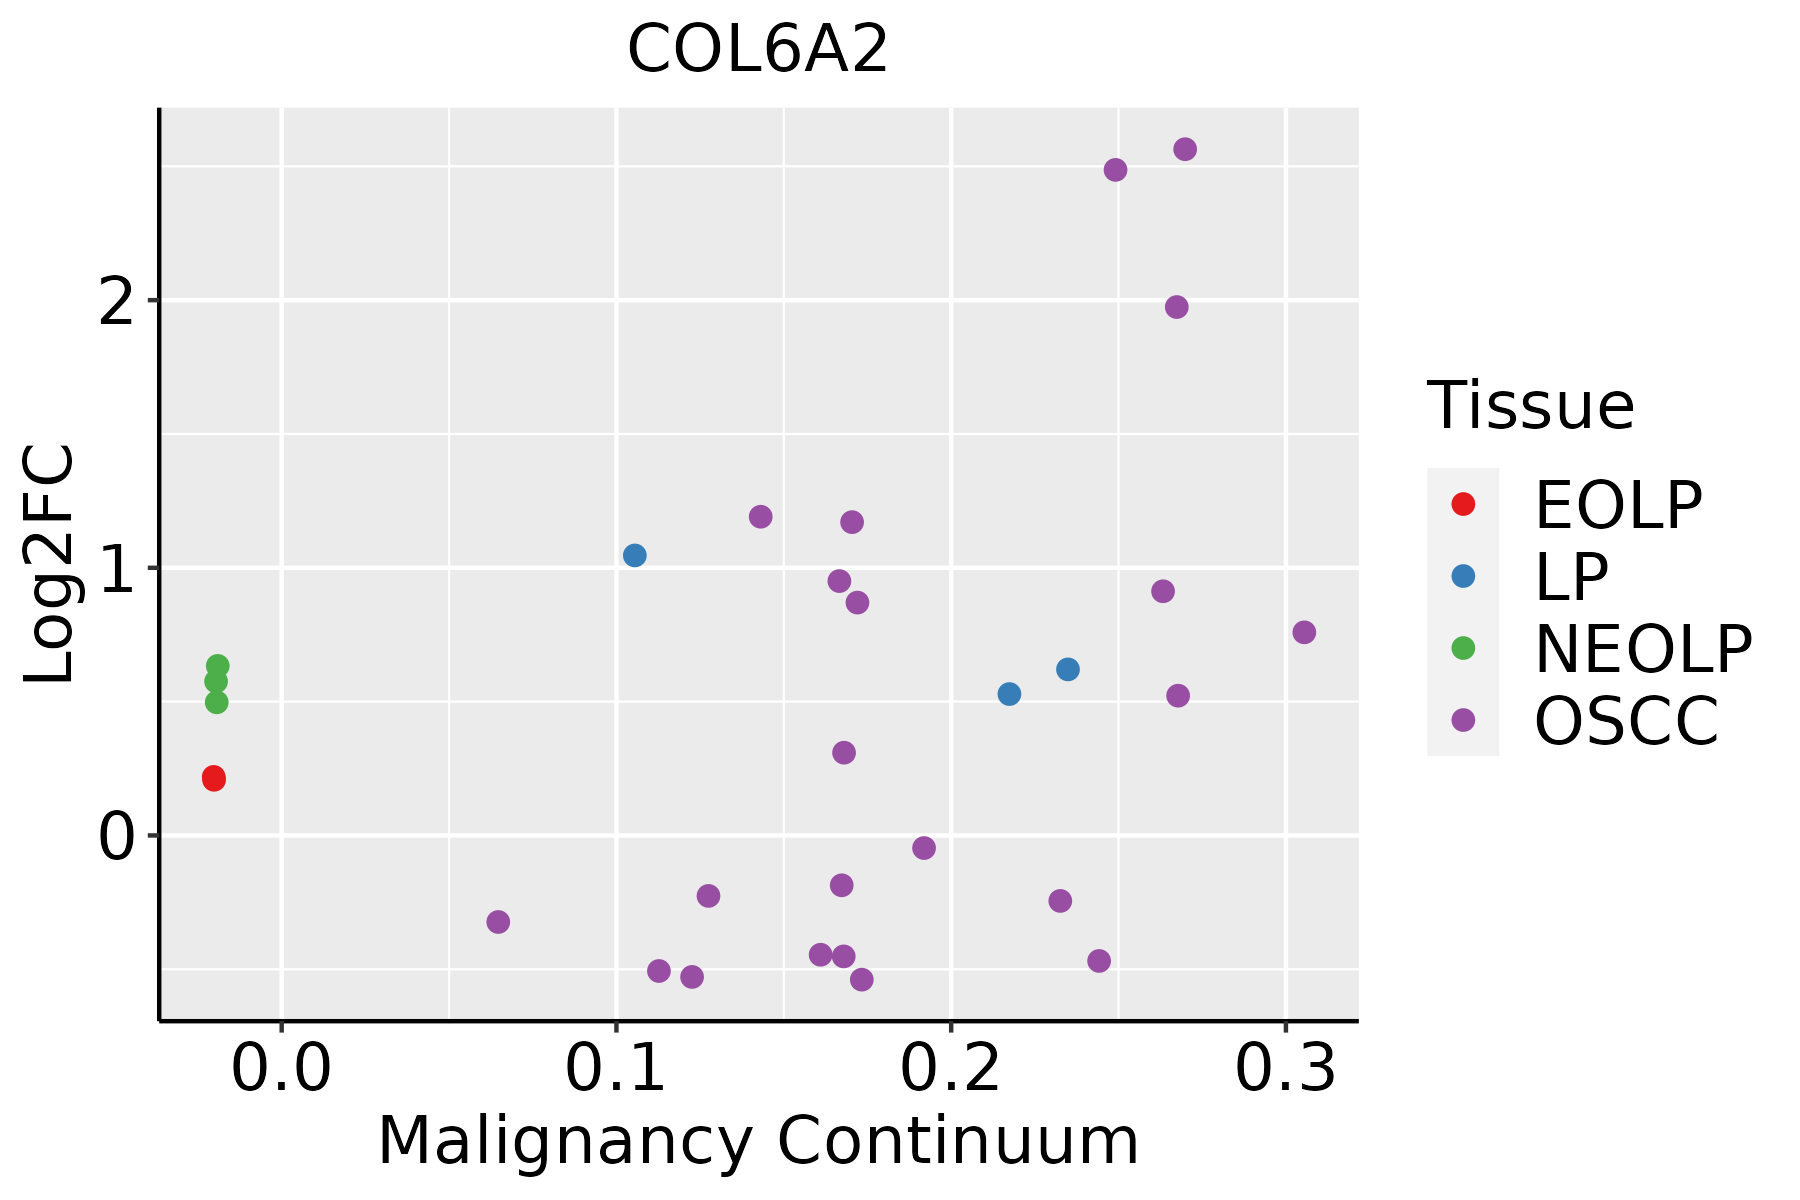 | EOLP: Erosive Oral lichen planus |
| LP: leukoplakia | ||
| NEOLP: Non-erosive oral lichen planus | ||
| OSCC: Oral squamous cell carcinoma | ||
| Prostate | 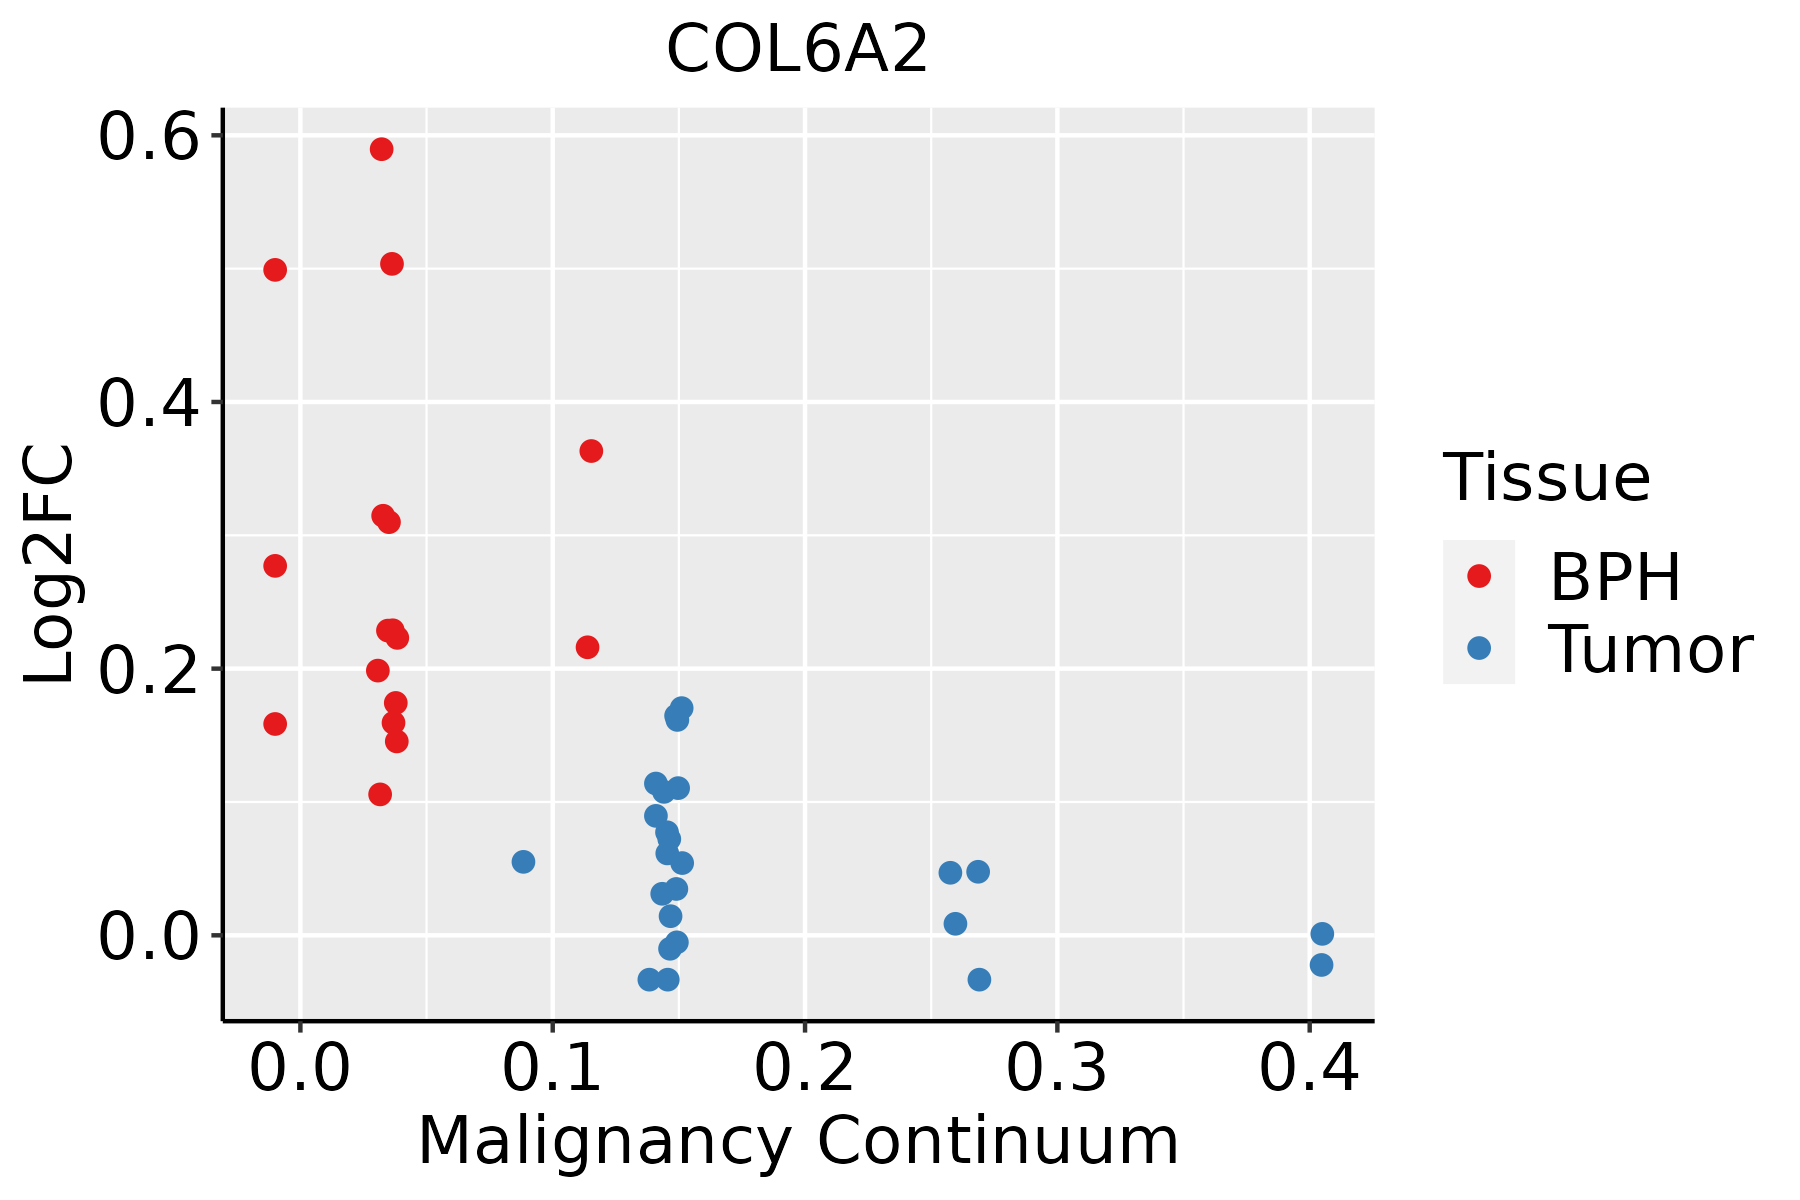 | BPH: Benign Prostatic Hyperplasia |
| Skin |  | AK: Actinic keratosis |
| cSCC: Cutaneous squamous cell carcinoma | ||
| SCCIS:squamous cell carcinoma in situ | ||
| Thyroid | 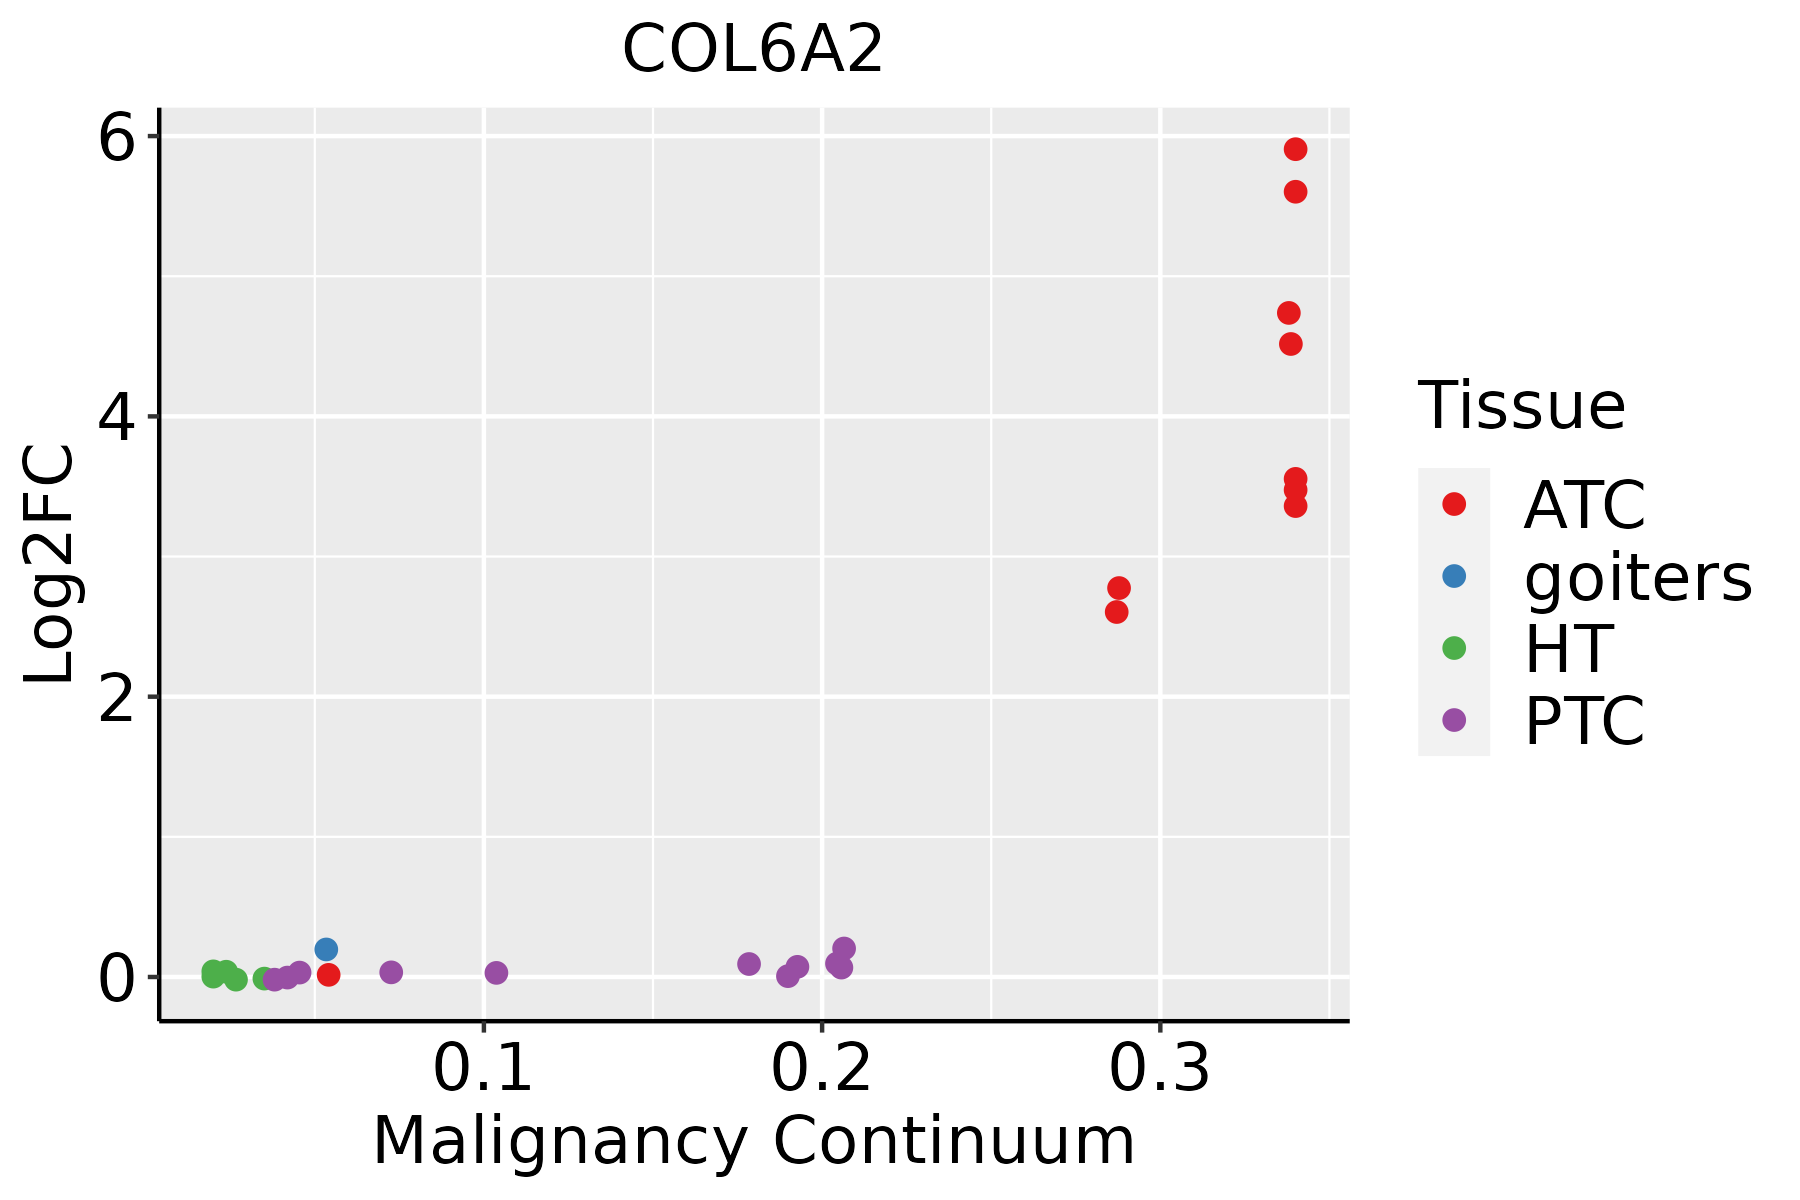 | ATC: Anaplastic thyroid cancer |
| HT: Hashimoto's thyroiditis | ||
| PTC: Papillary thyroid cancer |
| ∗log2FC in expression of this searched gene in stem-like cells from each diseased tissue sample relative to stem-like cells in normal samples in each tissue plotted against the malignancy continuum. Samples are colored based on if they are from different disease stage. |
Top |
Malignant transformation related pathway analysis |
| Find out the enriched GO biological processes and KEGG pathways involved in transition from healthy to precancer to cancer |
| Tissue | Disease Stage | Enriched GO biological Processes |
| Colorectum | AD |  |
| Colorectum | SER |  |
| Colorectum | MSS |  |
| Colorectum | MSI-H |  |
| Colorectum | FAP |  |
| ∗Top 15 enriched GO BP terms are showed in the bar plot of each disease state in each tissue. Each row represents a significant GO biological process which is colored according to the -log10(p.adjust). |
| Page: 1 2 3 4 5 6 7 8 9 |
| GO ID | Tissue | Disease Stage | Description | Gene Ratio | Bg Ratio | pvalue | p.adjust | Count |
| GO:000974316 | Endometrium | AEH | response to carbohydrate | 62/2100 | 253/18723 | 1.76e-09 | 1.51e-07 | 62 |
| GO:003428416 | Endometrium | AEH | response to monosaccharide | 57/2100 | 225/18723 | 2.13e-09 | 1.77e-07 | 57 |
| GO:000974615 | Endometrium | AEH | response to hexose | 54/2100 | 219/18723 | 1.54e-08 | 9.72e-07 | 54 |
| GO:000974910 | Endometrium | AEH | response to glucose | 52/2100 | 212/18723 | 3.40e-08 | 1.91e-06 | 52 |
| GO:000974317 | Endometrium | EEC | response to carbohydrate | 64/2168 | 253/18723 | 8.81e-10 | 7.89e-08 | 64 |
| GO:003428417 | Endometrium | EEC | response to monosaccharide | 58/2168 | 225/18723 | 2.52e-09 | 1.96e-07 | 58 |
| GO:000974616 | Endometrium | EEC | response to hexose | 55/2168 | 219/18723 | 1.74e-08 | 1.07e-06 | 55 |
| GO:000974914 | Endometrium | EEC | response to glucose | 53/2168 | 212/18723 | 3.70e-08 | 2.07e-06 | 53 |
| GO:0009743111 | Esophagus | ESCC | response to carbohydrate | 135/8552 | 253/18723 | 8.16e-03 | 2.89e-02 | 135 |
| GO:000974312 | Liver | Cirrhotic | response to carbohydrate | 101/4634 | 253/18723 | 6.24e-08 | 1.92e-06 | 101 |
| GO:003428412 | Liver | Cirrhotic | response to monosaccharide | 90/4634 | 225/18723 | 2.87e-07 | 7.01e-06 | 90 |
| GO:000974612 | Liver | Cirrhotic | response to hexose | 86/4634 | 219/18723 | 1.30e-06 | 2.59e-05 | 86 |
| GO:00097497 | Liver | Cirrhotic | response to glucose | 82/4634 | 212/18723 | 4.54e-06 | 7.51e-05 | 82 |
| GO:000974322 | Liver | HCC | response to carbohydrate | 149/7958 | 253/18723 | 9.55e-08 | 1.89e-06 | 149 |
| GO:003428422 | Liver | HCC | response to monosaccharide | 131/7958 | 225/18723 | 1.32e-06 | 1.91e-05 | 131 |
| GO:000974622 | Liver | HCC | response to hexose | 126/7958 | 219/18723 | 4.81e-06 | 6.06e-05 | 126 |
| GO:000974912 | Liver | HCC | response to glucose | 121/7958 | 212/18723 | 1.24e-05 | 1.39e-04 | 121 |
| GO:000974320 | Oral cavity | OSCC | response to carbohydrate | 128/7305 | 253/18723 | 1.11e-04 | 8.16e-04 | 128 |
| GO:003428420 | Oral cavity | OSCC | response to monosaccharide | 114/7305 | 225/18723 | 2.37e-04 | 1.54e-03 | 114 |
| GO:000974619 | Oral cavity | OSCC | response to hexose | 109/7305 | 219/18723 | 7.41e-04 | 4.05e-03 | 109 |
| Page: 1 2 3 |
| Pathway ID | Tissue | Disease Stage | Description | Gene Ratio | Bg Ratio | pvalue | p.adjust | qvalue | Count |
| hsa0451015 | Endometrium | AEH | Focal adhesion | 58/1197 | 203/8465 | 4.99e-08 | 7.37e-07 | 5.39e-07 | 58 |
| hsa0451016 | Endometrium | AEH | Focal adhesion | 58/1197 | 203/8465 | 4.99e-08 | 7.37e-07 | 5.39e-07 | 58 |
| hsa0451024 | Endometrium | EEC | Focal adhesion | 58/1237 | 203/8465 | 1.61e-07 | 2.30e-06 | 1.71e-06 | 58 |
| hsa0451034 | Endometrium | EEC | Focal adhesion | 58/1237 | 203/8465 | 1.61e-07 | 2.30e-06 | 1.71e-06 | 58 |
| hsa0516510 | Esophagus | ESCC | Human papillomavirus infection | 215/4205 | 331/8465 | 7.86e-09 | 7.12e-08 | 3.65e-08 | 215 |
| hsa0451020 | Esophagus | ESCC | Focal adhesion | 127/4205 | 203/8465 | 1.25e-04 | 4.99e-04 | 2.56e-04 | 127 |
| hsa041517 | Esophagus | ESCC | PI3K-Akt signaling pathway | 197/4205 | 354/8465 | 1.24e-02 | 2.83e-02 | 1.45e-02 | 197 |
| hsa0516515 | Esophagus | ESCC | Human papillomavirus infection | 215/4205 | 331/8465 | 7.86e-09 | 7.12e-08 | 3.65e-08 | 215 |
| hsa04510111 | Esophagus | ESCC | Focal adhesion | 127/4205 | 203/8465 | 1.25e-04 | 4.99e-04 | 2.56e-04 | 127 |
| hsa0415114 | Esophagus | ESCC | PI3K-Akt signaling pathway | 197/4205 | 354/8465 | 1.24e-02 | 2.83e-02 | 1.45e-02 | 197 |
| hsa0451021 | Liver | Cirrhotic | Focal adhesion | 93/2530 | 203/8465 | 9.27e-07 | 1.10e-05 | 6.80e-06 | 93 |
| hsa05165 | Liver | Cirrhotic | Human papillomavirus infection | 124/2530 | 331/8465 | 1.55e-03 | 7.83e-03 | 4.83e-03 | 124 |
| hsa0451031 | Liver | Cirrhotic | Focal adhesion | 93/2530 | 203/8465 | 9.27e-07 | 1.10e-05 | 6.80e-06 | 93 |
| hsa051651 | Liver | Cirrhotic | Human papillomavirus infection | 124/2530 | 331/8465 | 1.55e-03 | 7.83e-03 | 4.83e-03 | 124 |
| hsa0451041 | Liver | HCC | Focal adhesion | 125/4020 | 203/8465 | 3.12e-05 | 1.88e-04 | 1.04e-04 | 125 |
| hsa051652 | Liver | HCC | Human papillomavirus infection | 188/4020 | 331/8465 | 3.34e-04 | 1.49e-03 | 8.29e-04 | 188 |
| hsa0451051 | Liver | HCC | Focal adhesion | 125/4020 | 203/8465 | 3.12e-05 | 1.88e-04 | 1.04e-04 | 125 |
| hsa051653 | Liver | HCC | Human papillomavirus infection | 188/4020 | 331/8465 | 3.34e-04 | 1.49e-03 | 8.29e-04 | 188 |
| hsa051659 | Oral cavity | OSCC | Human papillomavirus infection | 200/3704 | 331/8465 | 3.83e-10 | 4.93e-09 | 2.51e-09 | 200 |
| hsa0451019 | Oral cavity | OSCC | Focal adhesion | 128/3704 | 203/8465 | 1.71e-08 | 1.63e-07 | 8.31e-08 | 128 |
| Page: 1 2 |
Top |
Cell-cell communication analysis |
| Identification of potential cell-cell interactions between two cell types and their ligand-receptor pairs for different disease states |
| Ligand | Receptor | LRpair | Pathway | Tissue | Disease Stage |
| COL6A2 | ITGA1_ITGB1 | COL6A2_ITGA1_ITGB1 | COLLAGEN | Breast | ADJ |
| COL6A2 | ITGA2_ITGB1 | COL6A2_ITGA2_ITGB1 | COLLAGEN | Breast | ADJ |
| COL6A2 | CD44 | COL6A2_CD44 | COLLAGEN | Breast | ADJ |
| COL6A2 | SDC4 | COL6A2_SDC4 | COLLAGEN | Breast | ADJ |
| COL6A2 | ITGA1_ITGB1 | COL6A2_ITGA1_ITGB1 | COLLAGEN | Breast | DCIS |
| COL6A2 | ITGA2_ITGB1 | COL6A2_ITGA2_ITGB1 | COLLAGEN | Breast | DCIS |
| COL6A2 | CD44 | COL6A2_CD44 | COLLAGEN | Breast | DCIS |
| COL6A2 | SDC1 | COL6A2_SDC1 | COLLAGEN | Breast | DCIS |
| COL6A2 | SDC4 | COL6A2_SDC4 | COLLAGEN | Breast | DCIS |
| COL6A2 | ITGA1_ITGB1 | COL6A2_ITGA1_ITGB1 | COLLAGEN | Breast | Healthy |
| COL6A2 | ITGA2_ITGB1 | COL6A2_ITGA2_ITGB1 | COLLAGEN | Breast | Healthy |
| COL6A2 | ITGAV_ITGB8 | COL6A2_ITGAV_ITGB8 | COLLAGEN | Breast | Healthy |
| COL6A2 | CD44 | COL6A2_CD44 | COLLAGEN | Breast | Healthy |
| COL6A2 | SDC1 | COL6A2_SDC1 | COLLAGEN | Breast | Healthy |
| COL6A2 | SDC4 | COL6A2_SDC4 | COLLAGEN | Breast | Healthy |
| COL6A2 | ITGA1_ITGB1 | COL6A2_ITGA1_ITGB1 | COLLAGEN | Breast | IDC |
| COL6A2 | CD44 | COL6A2_CD44 | COLLAGEN | Breast | IDC |
| COL6A2 | SDC1 | COL6A2_SDC1 | COLLAGEN | Breast | IDC |
| COL6A2 | SDC4 | COL6A2_SDC4 | COLLAGEN | Breast | IDC |
| COL6A2 | ITGA1_ITGB1 | COL6A2_ITGA1_ITGB1 | COLLAGEN | Breast | Precancer |
| Page: 1 2 3 4 5 6 7 8 9 10 11 12 13 14 15 |
Top |
Single-cell gene regulatory network inference analysis |
| Find out the significant the regulons (TFs) and the target genes of each regulon across cell types for different disease states |
| TF | Cell Type | Tissue | Disease Stage | Target Gene | RSS | Regulon Activity |
| ∗The dot plots of a searched regulon are shown for all cell subpopulations in each disease state of each tissue based on the regulon specific score inferred using pySCENIC and by calculating the average expression. |
| Page: 1 |
Top |
Somatic mutation of malignant transformation related genes |
| Annotation of somatic variants for genes involved in malignant transformation |
| Hugo Symbol | Variant Class | Variant Classification | dbSNP RS | HGVSc | HGVSp | HGVSp Short | SWISSPROT | BIOTYPE | SIFT | PolyPhen | Tumor Sample Barcode | Tissue | Histology | Sex | Age | Stage | Therapy Types | Drugs | Outcome |
| COL6A2 | SNV | Missense_Mutation | rs111630733 | c.2851N>A | p.Val951Ile | p.V951I | P12110 | protein_coding | tolerated(1) | benign(0.12) | TCGA-AC-A8OQ-01 | Breast | breast invasive carcinoma | Female | >=65 | I/II | Unknown | Unknown | SD |
| COL6A2 | SNV | Missense_Mutation | c.1798N>A | p.Glu600Lys | p.E600K | P12110 | protein_coding | tolerated(0.15) | probably_damaging(0.991) | TCGA-AR-A0TP-01 | Breast | breast invasive carcinoma | Female | <65 | I/II | Chemotherapy | doxorubicin | SD | |
| COL6A2 | SNV | Missense_Mutation | rs541785316 | c.1780G>A | p.Val594Ile | p.V594I | P12110 | protein_coding | tolerated(0.36) | possibly_damaging(0.801) | TCGA-AR-A1AO-01 | Breast | breast invasive carcinoma | Female | <65 | I/II | Chemotherapy | doxorubicin | SD |
| COL6A2 | SNV | Missense_Mutation | rs372431744 | c.3034G>A | p.Asp1012Asn | p.D1012N | P12110 | protein_coding | deleterious(0.01) | probably_damaging(0.983) | TCGA-BH-A18Q-01 | Breast | breast invasive carcinoma | Female | <65 | I/II | Unknown | Unknown | SD |
| COL6A2 | SNV | Missense_Mutation | rs142880107 | c.1138C>T | p.Arg380Cys | p.R380C | P12110 | protein_coding | deleterious(0) | probably_damaging(0.993) | TCGA-BH-A42T-01 | Breast | breast invasive carcinoma | Female | >=65 | I/II | Unknown | Unknown | SD |
| COL6A2 | SNV | Missense_Mutation | c.2430G>C | p.Gln810His | p.Q810H | P12110 | protein_coding | tolerated(0.28) | benign(0.155) | TCGA-D8-A1JA-01 | Breast | breast invasive carcinoma | Female | <65 | III/IV | Chemotherapy | adriamycin | PD | |
| COL6A2 | SNV | Missense_Mutation | rs558005986 | c.1976N>A | p.Arg659His | p.R659H | P12110 | protein_coding | deleterious(0.04) | probably_damaging(0.999) | TCGA-GI-A2C9-01 | Breast | breast invasive carcinoma | Female | <65 | I/II | Unspecific | SD | |
| COL6A2 | SNV | Missense_Mutation | rs727503883 | c.1162N>A | p.Gly388Arg | p.G388R | P12110 | protein_coding | deleterious(0) | probably_damaging(1) | TCGA-LL-A5YL-01 | Breast | breast invasive carcinoma | Female | <65 | I/II | Chemotherapy | adriamycin | SD |
| COL6A2 | SNV | Missense_Mutation | rs565801105 | c.2350N>T | p.Arg784Cys | p.R784C | P12110 | protein_coding | tolerated(0.1) | possibly_damaging(0.823) | TCGA-2W-A8YY-01 | Cervix | cervical & endocervical cancer | Female | <65 | I/II | Chemotherapy | cisplatin | CR |
| COL6A2 | SNV | Missense_Mutation | c.2720C>T | p.Thr907Ile | p.T907I | P12110 | protein_coding | tolerated(0.18) | benign(0) | TCGA-IR-A3LK-01 | Cervix | cervical & endocervical cancer | Female | >=65 | I/II | Chemotherapy | cisplatin | PD |
| Page: 1 2 3 4 5 6 7 8 9 10 11 12 13 14 15 16 |
Top |
Related drugs of malignant transformation related genes |
| Identification of chemicals and drugs interact with genes involved in malignant transfromation |
| (DGIdb 4.0) |
| Entrez ID | Symbol | Category | Interaction Types | Drug Claim Name | Drug Name | PMIDs |
| 1292 | COL6A2 | DRUGGABLE GENOME | CHEMBL2108709 | COLLAGENASE CLOSTRIDIUM HISTOLYTICUM | ||
| 1292 | COL6A2 | DRUGGABLE GENOME | CHEMBL2095222 | OCRIPLASMIN |
| Page: 1 |

Copyright 2023-Present -The University of Texas Health Science Center at Houston |