Schematic overview of the cellular and molecular mechanisms involved in the cancer progression, including the proposed cellular and molecular mechanisms in cancer cells trajectory. AT1: alveolar type 1 cells; AT2: alveolar type 2 cells; AAH: atypical adenomatous hyperplasia; AIS: adenocarcinoma in situ; MIA: minimally invasive adenocarcinoma; IA: invasive adenocarcinoma; EMT: epithelial-mesenchymal transition

Home

Download

Statistics

Help

Contact

Center for Computational Systems Medicine
leaf

Gene summary

leaf

Malignant transformation analysis

leaf

Malignant transformation related pathway analysis

leaf

Cell-cell communication analysis

leaf

Single-cell gene regulatory network inference analysis

leaf

Somatic mutation of malignant transformation related genes

leaf

Related drugs of malignant transformation related genes

Gene: CNPPD1

Gene summary for CNPPD1

check button Gene summary.

Gene informationSpeciesHuman
Gene symbol

CNPPD1

Gene ID

27013

Gene namecyclin Pas1/PHO80 domain containing 1
Gene AliasC2orf24
Cytomap2q35
Gene Typeprotein-coding
GO ID

GO:0000079

UniProtAcc

A0A024R432


Top

Malignant transformation analysis

check button Identification of the aberrant gene expression in precancerous and cancerous lesions by comparing the gene expression of stem-like cells in diseased tissues with normal stem cells
check button Malignant transformation involving gene list.
Entrez IDSymbolReplicatesSpeciesOrganTissueAdj P-valueLog2FCMalignancy
27013CNPPD1S014HumanLiverHCC3.17e-259.25e-010.2254
27013CNPPD1S015HumanLiverHCC8.80e-291.34e+000.2375
27013CNPPD1S016HumanLiverHCC1.74e-291.09e+000.2243
27013CNPPD1S027HumanLiverHCC1.08e-089.99e-010.2446
27013CNPPD1S028HumanLiverHCC5.19e-219.37e-010.2503
27013CNPPD1S029HumanLiverHCC1.47e-271.11e+000.2581
27013CNPPD1C04HumanOral cavityOSCC3.87e-095.76e-010.2633
27013CNPPD1C21HumanOral cavityOSCC9.78e-289.11e-010.2678
27013CNPPD1C30HumanOral cavityOSCC4.40e-231.02e+000.3055
27013CNPPD1C38HumanOral cavityOSCC1.31e-036.64e-010.172
27013CNPPD1C43HumanOral cavityOSCC9.74e-174.05e-010.1704
27013CNPPD1C46HumanOral cavityOSCC5.39e-174.44e-010.1673
27013CNPPD1C51HumanOral cavityOSCC2.13e-043.06e-010.2674
27013CNPPD1C57HumanOral cavityOSCC5.42e-114.20e-010.1679
27013CNPPD1C06HumanOral cavityOSCC2.59e-058.70e-010.2699
27013CNPPD1C07HumanOral cavityOSCC2.10e-048.66e-010.2491
27013CNPPD1C08HumanOral cavityOSCC1.52e-123.27e-010.1919
27013CNPPD1C09HumanOral cavityOSCC5.18e-072.57e-010.1431
27013CNPPD1LN22HumanOral cavityOSCC4.61e-025.22e-010.1733
27013CNPPD1LN46HumanOral cavityOSCC2.35e-093.88e-010.1666
Page: 1 2 3 4 5 6 7 8 

check button Transcriptomic changes along malignancy continuum.
TissueExpression DynamicsAbbreviation
Colorectum (GSE201348)The image shows the transcriptomic changes along malignancy continuum.log2FC in expression of this searched gene in stem-like cells from each diseased tissue sample relative to stem-like cells in normal samples in each tissue plotted against the malignancy continuum. Samples are colored based on if they are from different disease stage.FAP: Familial adenomatous polyposis
CRC: Colorectal cancer
Colorectum (HTA11)The image shows the transcriptomic changes along malignancy continuum.log2FC in expression of this searched gene in stem-like cells from each diseased tissue sample relative to stem-like cells in normal samples in each tissue plotted against the malignancy continuum. Samples are colored based on if they are from different disease stage.AD: Adenomas
SER: Sessile serrated lesions
MSI-H: Microsatellite-high colorectal cancer
MSS: Microsatellite stable colorectal cancer
EsophagusThe image shows the transcriptomic changes along malignancy continuum.log2FC in expression of this searched gene in stem-like cells from each diseased tissue sample relative to stem-like cells in normal samples in each tissue plotted against the malignancy continuum. Samples are colored based on if they are from different disease stage.
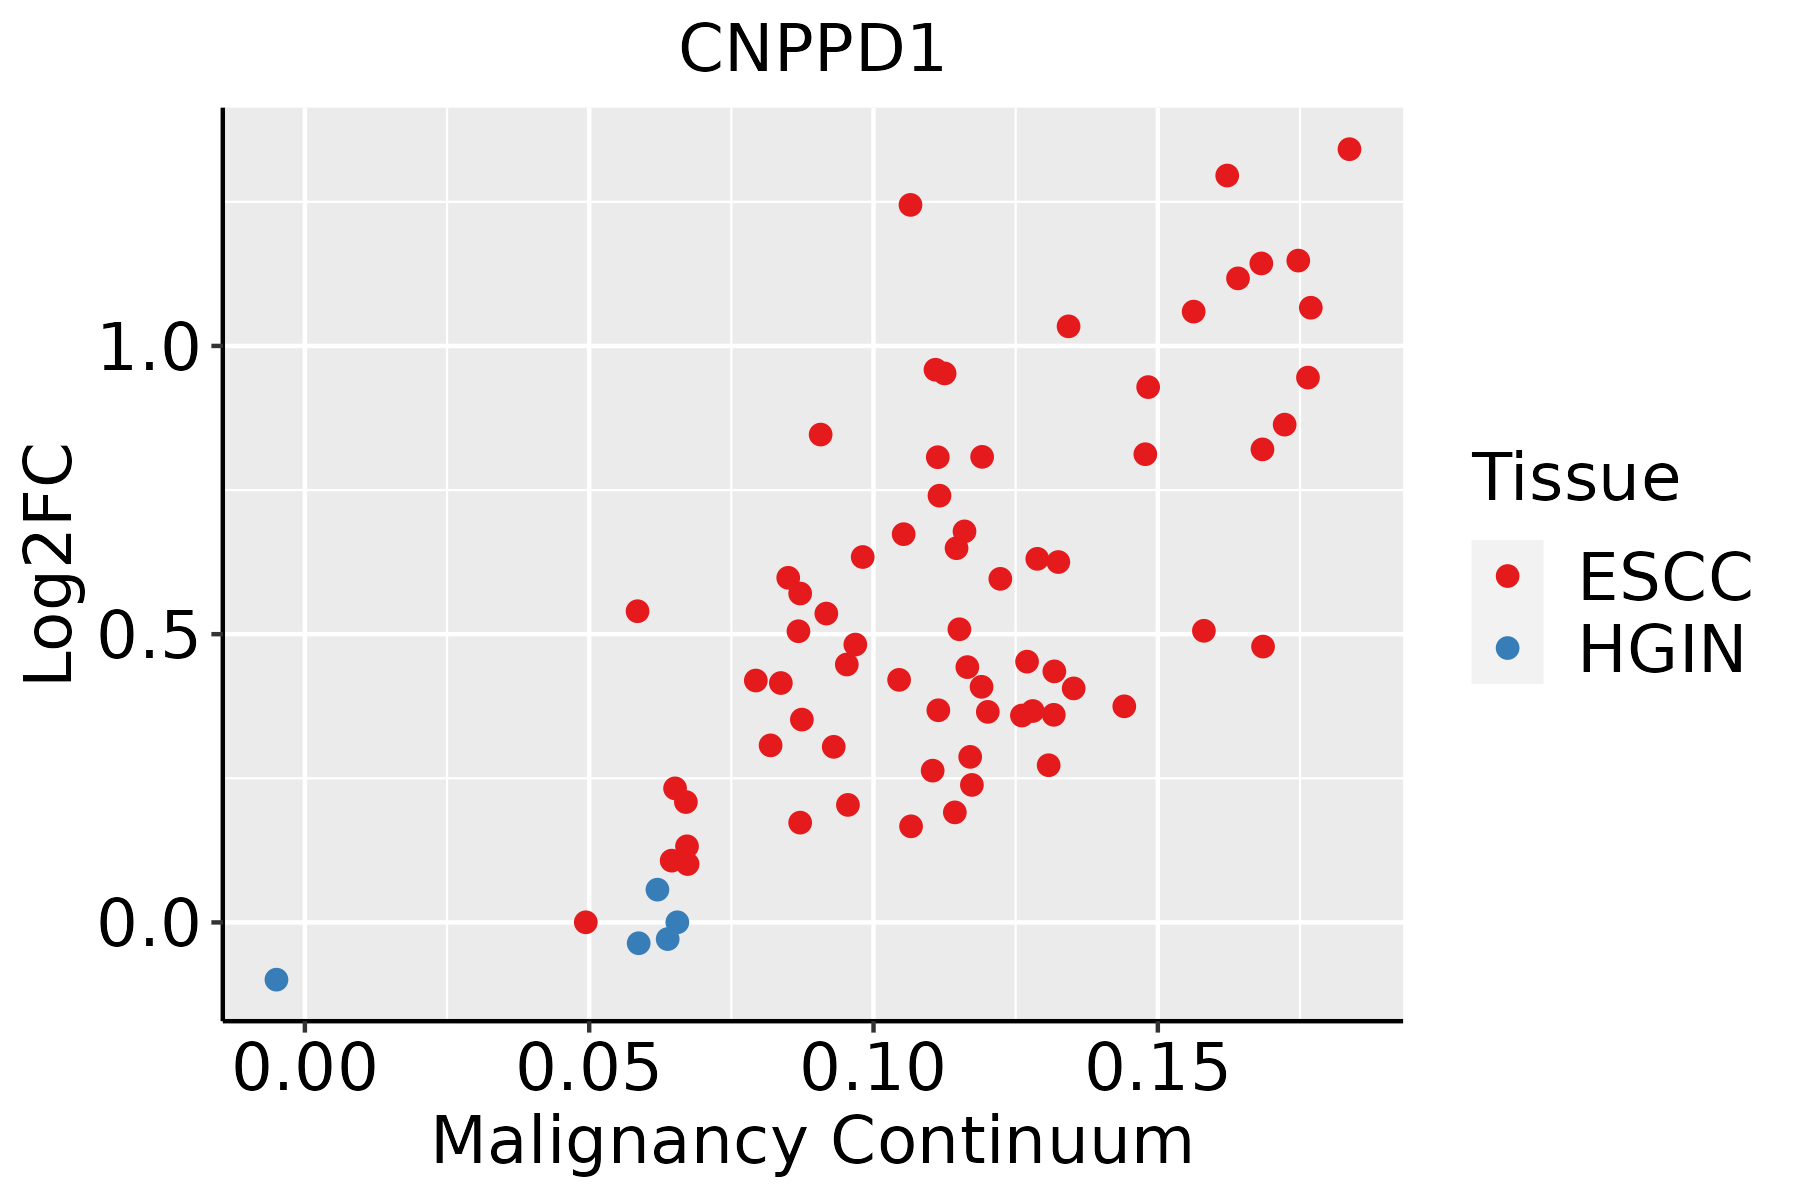
ESCC: Esophageal squamous cell carcinoma
HGIN: High-grade intraepithelial neoplasias
LGIN: Low-grade intraepithelial neoplasias
LiverThe image shows the transcriptomic changes along malignancy continuum.log2FC in expression of this searched gene in stem-like cells from each diseased tissue sample relative to stem-like cells in normal samples in each tissue plotted against the malignancy continuum. Samples are colored based on if they are from different disease stage.
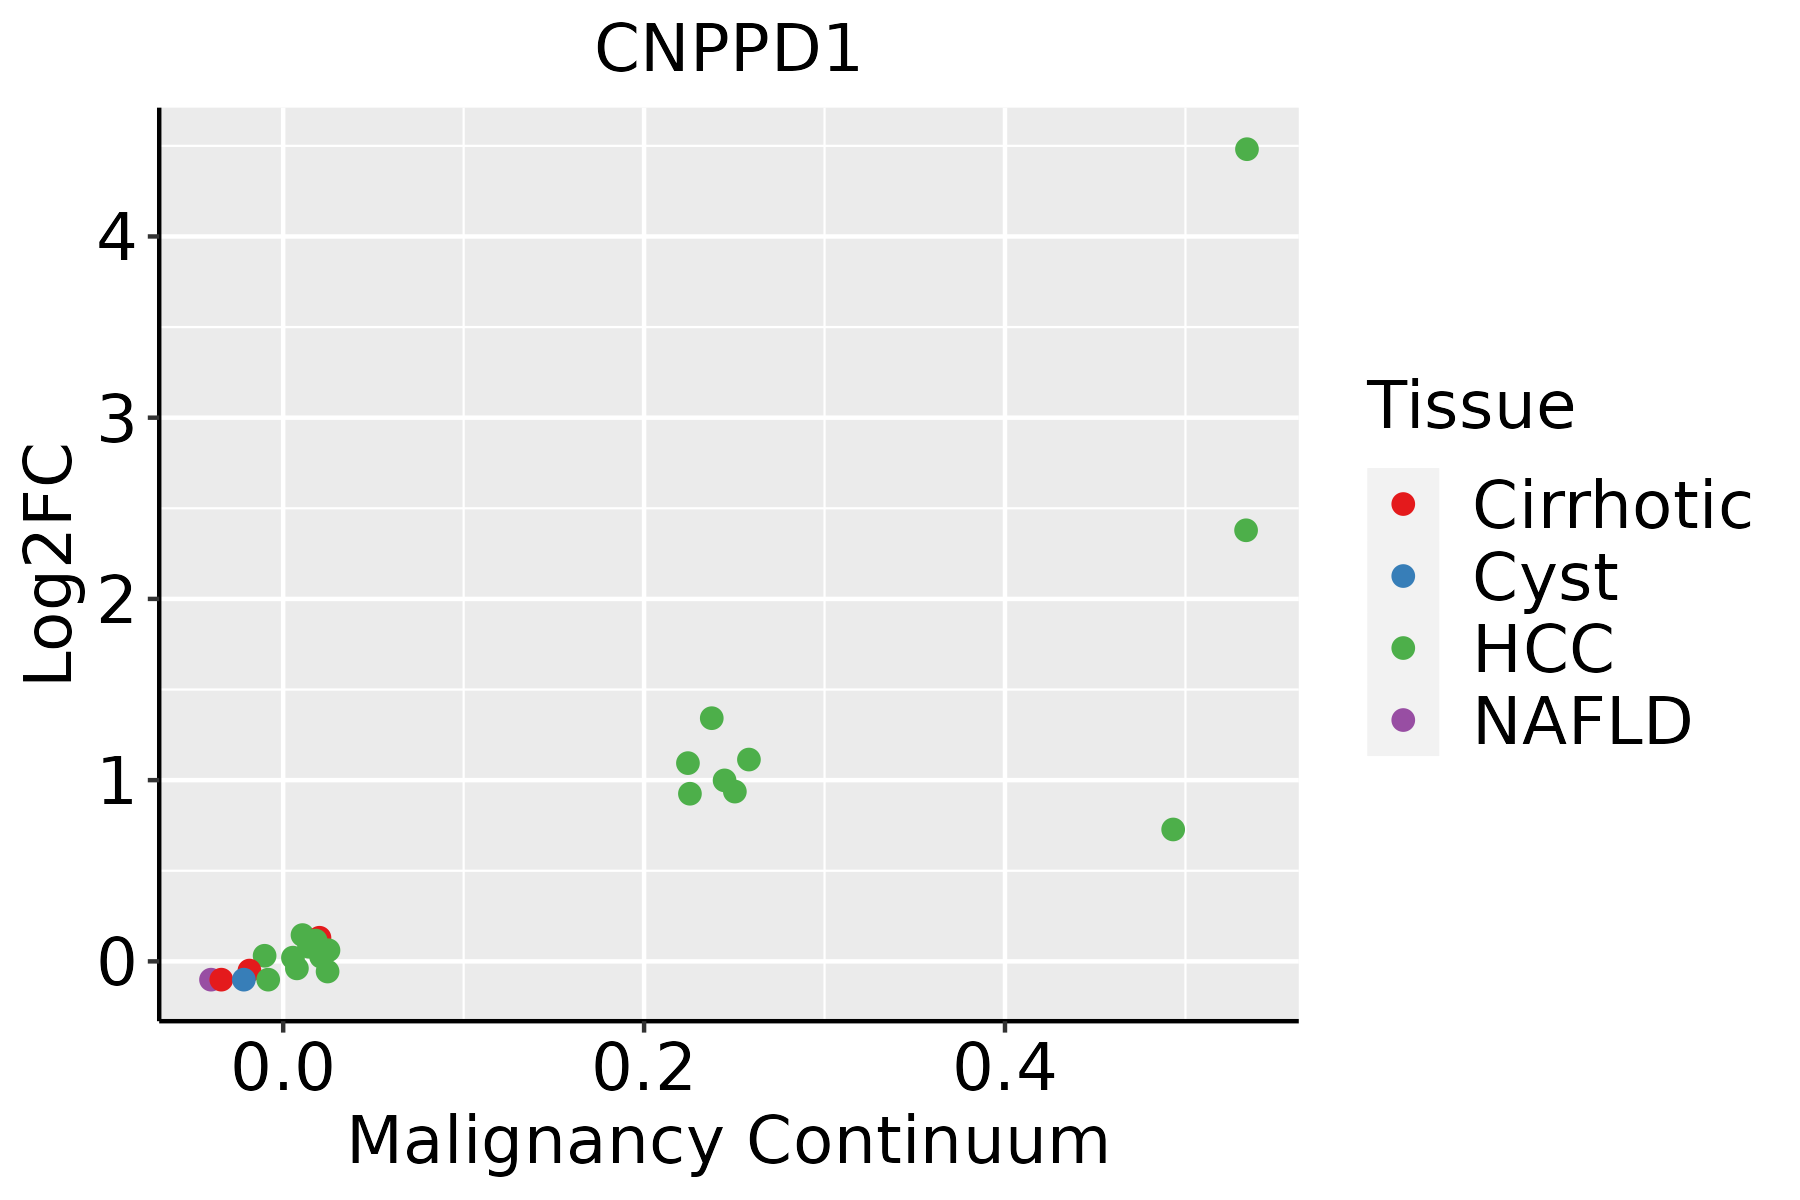
HCC: Hepatocellular carcinoma
NAFLD: Non-alcoholic fatty liver disease
Oral CavityThe image shows the transcriptomic changes along malignancy continuum.log2FC in expression of this searched gene in stem-like cells from each diseased tissue sample relative to stem-like cells in normal samples in each tissue plotted against the malignancy continuum. Samples are colored based on if they are from different disease stage.EOLP: Erosive Oral lichen planus
LP: leukoplakia
NEOLP: Non-erosive oral lichen planus
OSCC: Oral squamous cell carcinoma
SkinThe image shows the transcriptomic changes along malignancy continuum.log2FC in expression of this searched gene in stem-like cells from each diseased tissue sample relative to stem-like cells in normal samples in each tissue plotted against the malignancy continuum. Samples are colored based on if they are from different disease stage.
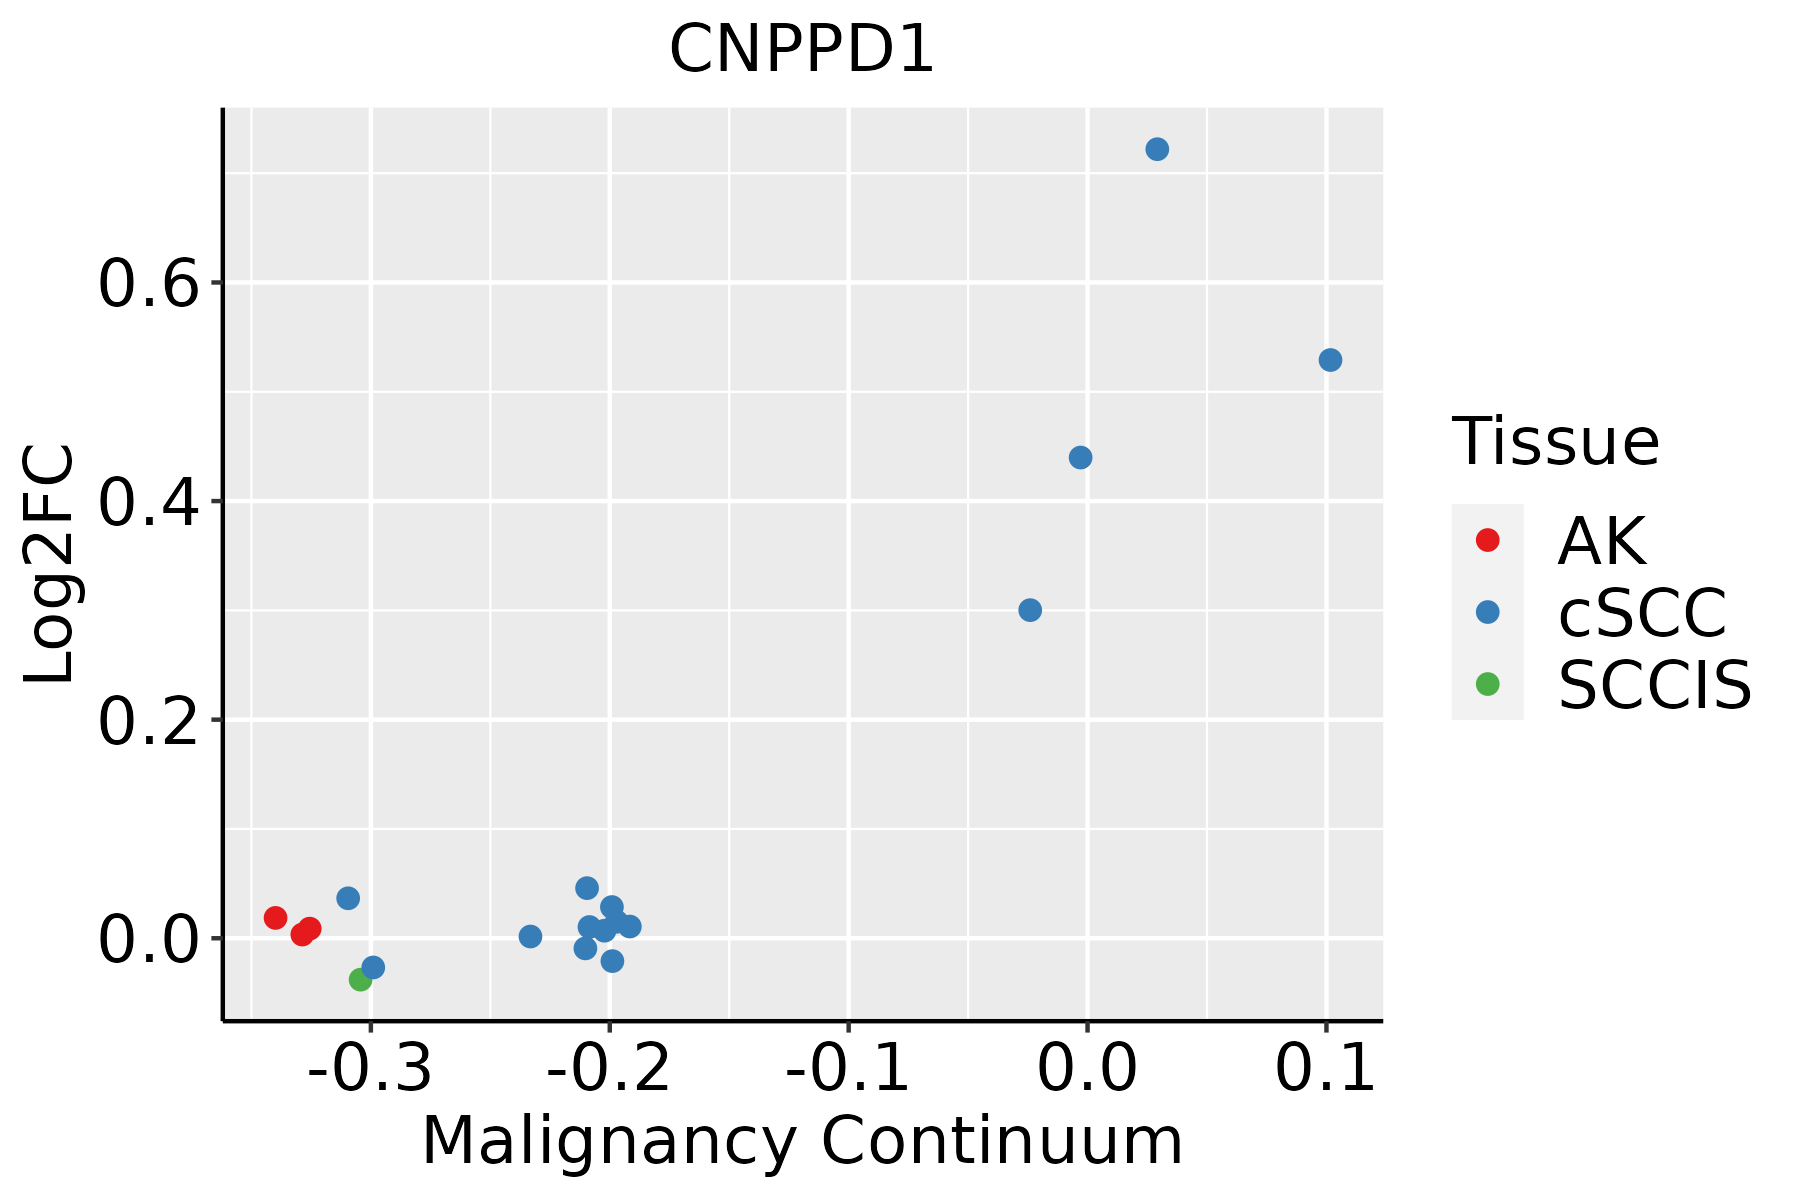
AK: Actinic keratosis
cSCC: Cutaneous squamous cell carcinoma
SCCIS:squamous cell carcinoma in situ
ThyroidThe image shows the transcriptomic changes along malignancy continuum.log2FC in expression of this searched gene in stem-like cells from each diseased tissue sample relative to stem-like cells in normal samples in each tissue plotted against the malignancy continuum. Samples are colored based on if they are from different disease stage.
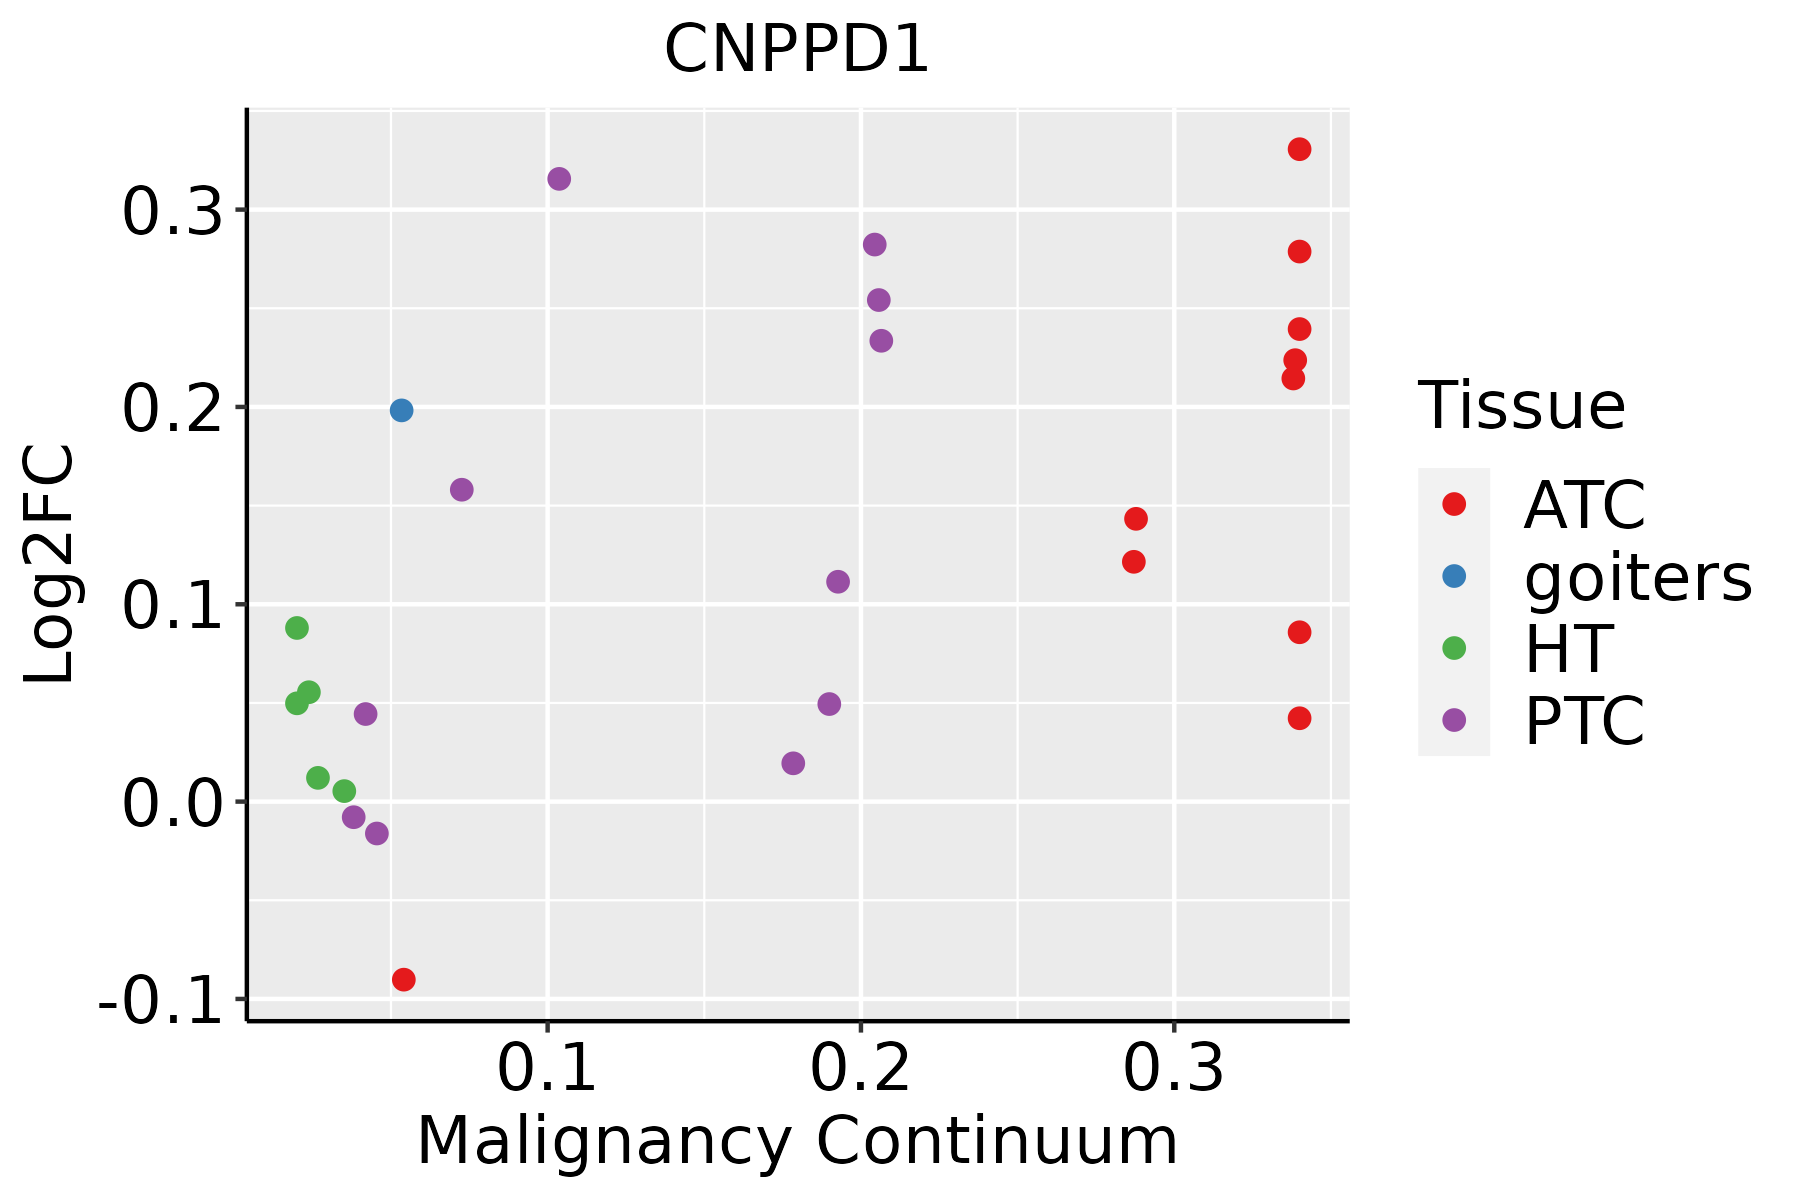
ATC: Anaplastic thyroid cancer
HT: Hashimoto's thyroiditis
PTC: Papillary thyroid cancer
∗log2FC in expression of this searched gene in stem-like cells from each diseased tissue sample relative to stem-like cells in normal samples in each tissue plotted against the malignancy continuum. Samples are colored based on if they are from different disease stage.

Top

Malignant transformation related pathway analysis

check buttonFind out the enriched GO biological processes and KEGG pathways involved in transition from healthy to precancer to cancer
check button Figure of enriched GO biological processes.
TissueDisease StageEnriched GO biological Processes
ColorectumADGO analysis - Figure of enriched GO biological processes: Top 15 enriched GO BP terms are showed in the bar plot of each disease state in each tissue. Each row represents a significant GO biological process which is colored according to the -log10(p.adjust).
ColorectumSERGO analysis - Figure of enriched GO biological processes: Top 15 enriched GO BP terms are showed in the bar plot of each disease state in each tissue. Each row represents a significant GO biological process which is colored according to the -log10(p.adjust).
ColorectumMSSGO analysis - Figure of enriched GO biological processes: Top 15 enriched GO BP terms are showed in the bar plot of each disease state in each tissue. Each row represents a significant GO biological process which is colored according to the -log10(p.adjust).
ColorectumMSI-HGO analysis - Figure of enriched GO biological processes: Top 15 enriched GO BP terms are showed in the bar plot of each disease state in each tissue. Each row represents a significant GO biological process which is colored according to the -log10(p.adjust).
ColorectumFAPGO analysis - Figure of enriched GO biological processes: Top 15 enriched GO BP terms are showed in the bar plot of each disease state in each tissue. Each row represents a significant GO biological process which is colored according to the -log10(p.adjust).
∗Top 15 enriched GO BP terms are showed in the bar plot of each disease state in each tissue. Each row represents a significant GO biological process which is colored according to the -log10(p.adjust).
Page: 1 2 3 4 5 6 7 8 9 

check button Enriched GO biological processes.
GO IDTissueDisease StageDescriptionGene RatioBg Ratiopvaluep.adjustCount
GO:0071900ColorectumADregulation of protein serine/threonine kinase activity98/3918359/187232.18e-031.73e-0298
GO:00719001ColorectumSERregulation of protein serine/threonine kinase activity74/2897359/187235.22e-033.96e-0274
GO:00719002ColorectumMSSregulation of protein serine/threonine kinase activity93/3467359/187232.98e-043.91e-0393
GO:007190016EsophagusESCCregulation of protein serine/threonine kinase activity227/8552359/187231.12e-114.10e-10227
GO:19040294EsophagusESCCregulation of cyclin-dependent protein kinase activity69/855298/187236.04e-077.91e-0669
GO:00000794EsophagusESCCregulation of cyclin-dependent protein serine/threonine kinase activity66/855294/187231.24e-061.53e-0566
GO:007190011LiverCirrhoticregulation of protein serine/threonine kinase activity110/4634359/187236.19e-033.08e-02110
GO:007190021LiverHCCregulation of protein serine/threonine kinase activity189/7958359/187235.97e-055.47e-04189
GO:0000079LiverHCCregulation of cyclin-dependent protein serine/threonine kinase activity55/795894/187231.25e-036.91e-0355
GO:1904029LiverHCCregulation of cyclin-dependent protein kinase activity57/795898/187231.26e-036.92e-0357
GO:007190010Oral cavityOSCCregulation of protein serine/threonine kinase activity201/7305359/187233.90e-111.27e-09201
GO:19040293Oral cavityOSCCregulation of cyclin-dependent protein kinase activity60/730598/187236.90e-067.56e-0560
GO:00000793Oral cavityOSCCregulation of cyclin-dependent protein serine/threonine kinase activity58/730594/187236.92e-067.57e-0558
GO:007190015Oral cavityLPregulation of protein serine/threonine kinase activity119/4623359/187231.70e-041.90e-03119
GO:000007911Oral cavityLPregulation of cyclin-dependent protein serine/threonine kinase activity34/462394/187238.52e-034.61e-0234
GO:00000795SkincSCCregulation of cyclin-dependent protein serine/threonine kinase activity41/486494/187231.53e-041.35e-0341
GO:190402911SkincSCCregulation of cyclin-dependent protein kinase activity42/486498/187232.05e-041.70e-0342
GO:007190024SkincSCCregulation of protein serine/threonine kinase activity123/4864359/187232.70e-042.17e-03123
GO:0071900110ThyroidPTCregulation of protein serine/threonine kinase activity164/5968359/187232.41e-085.43e-07164
GO:190402912ThyroidPTCregulation of cyclin-dependent protein kinase activity49/596898/187231.40e-041.09e-0349
Page: 1 2 

check button Enriched KEGG pathways.
Pathway IDTissueDisease StageDescriptionGene RatioBg Ratiopvaluep.adjustqvalueCount
Page: 1 

Top

Cell-cell communication analysis

check buttonIdentification of potential cell-cell interactions between two cell types and their ligand-receptor pairs for different disease states
LigandReceptorLRpairPathwayTissueDisease Stage
Page: 1 

Top

Single-cell gene regulatory network inference analysis

check buttonFind out the significant the regulons (TFs) and the target genes of each regulon across cell types for different disease states
TFCell TypeTissueDisease StageTarget GeneRSSRegulon Activity
∗The dot plots of a searched regulon are shown for all cell subpopulations in each disease state of each tissue based on the regulon specific score inferred using pySCENIC and by calculating the average expression.
Page: 1 

Top

Somatic mutation of malignant transformation related genes

check buttonAnnotation of somatic variants for genes involved in malignant transformation
Hugo SymbolVariant ClassVariant ClassificationdbSNP RSHGVScHGVSpHGVSp ShortSWISSPROTBIOTYPESIFTPolyPhenTumor Sample BarcodeTissueHistologySexAgeStageTherapy TypesDrugsOutcome
CNPPD1SNVMissense_Mutationc.842N>Ap.Cys281Tyrp.C281YQ9BV87protein_codingtolerated(0.35)benign(0.188)TCGA-A8-A09Z-01Breastbreast invasive carcinomaFemale>=65I/IIUnknownUnknownSD
CNPPD1SNVMissense_Mutationnovelc.436N>Ap.Asp146Asnp.D146NQ9BV87protein_codingtolerated(0.05)probably_damaging(0.984)TCGA-AN-A046-01Breastbreast invasive carcinomaFemale>=65I/IIUnknownUnknownSD
CNPPD1SNVMissense_Mutationrs770379185c.599N>Ap.Arg200Glnp.R200QQ9BV87protein_codingdeleterious(0)probably_damaging(0.965)TCGA-C8-A274-01Breastbreast invasive carcinomaFemale<65I/IIHormone TherapytamoxiphenSD
CNPPD1SNVMissense_Mutationrs374803866c.227N>Ap.Arg76Glnp.R76QQ9BV87protein_codingdeleterious(0.01)possibly_damaging(0.472)TCGA-E2-A56Z-01Breastbreast invasive carcinomaFemale>=65I/IIHormone TherapyarimidexSD
CNPPD1insertionFrame_Shift_Insnovelc.481_482insATACACCCAGTTCGGCCTCp.Ala161AspfsTer23p.A161Dfs*23Q9BV87protein_codingTCGA-A8-A06P-01Breastbreast invasive carcinomaFemale<65III/IVUnspecificSD
CNPPD1insertionFrame_Shift_Insnovelc.479_480insGp.Asn160LysfsTer18p.N160Kfs*18Q9BV87protein_codingTCGA-A8-A06P-01Breastbreast invasive carcinomaFemale<65III/IVUnspecificSD
CNPPD1SNVMissense_Mutationnovelc.992N>Gp.Thr331Serp.T331SQ9BV87protein_codingtolerated_low_confidence(0.79)benign(0)TCGA-5M-AAT5-01Colorectumcolon adenocarcinomaUnknownUnknownI/IIUnknownUnknownUnknown
CNPPD1SNVMissense_Mutationc.781N>Cp.Cys261Argp.C261RQ9BV87protein_codingtolerated(0.6)benign(0.083)TCGA-AA-A010-01Colorectumcolon adenocarcinomaFemale<65I/IIChemotherapyfolinicCR
CNPPD1SNVMissense_Mutationc.953N>Tp.Pro318Leup.P318LQ9BV87protein_codingtolerated_low_confidence(0.63)possibly_damaging(0.648)TCGA-AA-A02H-01Colorectumcolon adenocarcinomaFemale>=65III/IVUnknownUnknownPD
CNPPD1SNVMissense_Mutationc.619N>Tp.Asp207Tyrp.D207YQ9BV87protein_codingdeleterious(0)probably_damaging(0.972)TCGA-AZ-6601-01Colorectumcolon adenocarcinomaMale>=65I/IIUnknownUnknownPD
Page: 1 2 3 4 5 

Top

Related drugs of malignant transformation related genes

check buttonIdentification of chemicals and drugs interact with genes involved in malignant transfromation
(DGIdb 4.0)
Entrez IDSymbolCategoryInteraction TypesDrug Claim NameDrug NamePMIDs
Page: 1