
|
|||||
|
 | |
| |
| |
| |
| |
| |
|
Gene: CLINT1 |
Gene summary for CLINT1 |
| Gene information | Species | Human | Gene symbol | CLINT1 | Gene ID | 9685 |
| Gene name | clathrin interactor 1 | |
| Gene Alias | CLINT | |
| Cytomap | 5q33.3 | |
| Gene Type | protein-coding | GO ID | GO:0006810 | UniProtAcc | A0A0S2Z5H3 |
Top |
Malignant transformation analysis |
| Identification of the aberrant gene expression in precancerous and cancerous lesions by comparing the gene expression of stem-like cells in diseased tissues with normal stem cells |
| Entrez ID | Symbol | Replicates | Species | Organ | Tissue | Adj P-value | Log2FC | Malignancy |
| 9685 | CLINT1 | S43 | Human | Liver | Cirrhotic | 2.30e-12 | -3.26e-01 | -0.0187 |
| 9685 | CLINT1 | HCC1_Meng | Human | Liver | HCC | 1.90e-77 | -6.00e-02 | 0.0246 |
| 9685 | CLINT1 | HCC2_Meng | Human | Liver | HCC | 2.26e-40 | 1.17e-01 | 0.0107 |
| 9685 | CLINT1 | cirrhotic1 | Human | Liver | Cirrhotic | 2.78e-08 | 7.24e-02 | 0.0202 |
| 9685 | CLINT1 | cirrhotic2 | Human | Liver | Cirrhotic | 5.50e-07 | 7.44e-02 | 0.0201 |
| 9685 | CLINT1 | cirrhotic3 | Human | Liver | Cirrhotic | 1.49e-02 | -1.20e-01 | 0.0215 |
| 9685 | CLINT1 | HCC2 | Human | Liver | HCC | 8.18e-14 | 4.44e+00 | 0.5341 |
| 9685 | CLINT1 | Pt13.b | Human | Liver | HCC | 1.47e-10 | -8.04e-02 | 0.0251 |
| 9685 | CLINT1 | S014 | Human | Liver | HCC | 5.58e-03 | 3.80e-01 | 0.2254 |
| 9685 | CLINT1 | S015 | Human | Liver | HCC | 2.23e-02 | 4.13e-01 | 0.2375 |
| 9685 | CLINT1 | S027 | Human | Liver | HCC | 3.81e-07 | 1.09e+00 | 0.2446 |
| 9685 | CLINT1 | S028 | Human | Liver | HCC | 5.01e-08 | 6.70e-01 | 0.2503 |
| 9685 | CLINT1 | S029 | Human | Liver | HCC | 1.02e-11 | 1.11e+00 | 0.2581 |
| 9685 | CLINT1 | C04 | Human | Oral cavity | OSCC | 4.09e-09 | 6.00e-01 | 0.2633 |
| 9685 | CLINT1 | C21 | Human | Oral cavity | OSCC | 1.70e-31 | 1.22e+00 | 0.2678 |
| 9685 | CLINT1 | C30 | Human | Oral cavity | OSCC | 6.47e-26 | 9.72e-01 | 0.3055 |
| 9685 | CLINT1 | C38 | Human | Oral cavity | OSCC | 3.27e-14 | 1.63e+00 | 0.172 |
| 9685 | CLINT1 | C43 | Human | Oral cavity | OSCC | 1.73e-33 | 7.76e-01 | 0.1704 |
| 9685 | CLINT1 | C46 | Human | Oral cavity | OSCC | 3.70e-30 | 7.76e-01 | 0.1673 |
| 9685 | CLINT1 | C51 | Human | Oral cavity | OSCC | 1.03e-07 | 5.34e-01 | 0.2674 |
| Page: 1 2 3 4 5 6 7 8 9 |
| Tissue | Expression Dynamics | Abbreviation |
| Colorectum (GSE201348) |  | FAP: Familial adenomatous polyposis |
| CRC: Colorectal cancer | ||
| Colorectum (HTA11) |  | AD: Adenomas |
| SER: Sessile serrated lesions | ||
| MSI-H: Microsatellite-high colorectal cancer | ||
| MSS: Microsatellite stable colorectal cancer | ||
| Esophagus |  | ESCC: Esophageal squamous cell carcinoma |
| HGIN: High-grade intraepithelial neoplasias | ||
| LGIN: Low-grade intraepithelial neoplasias | ||
| Liver | 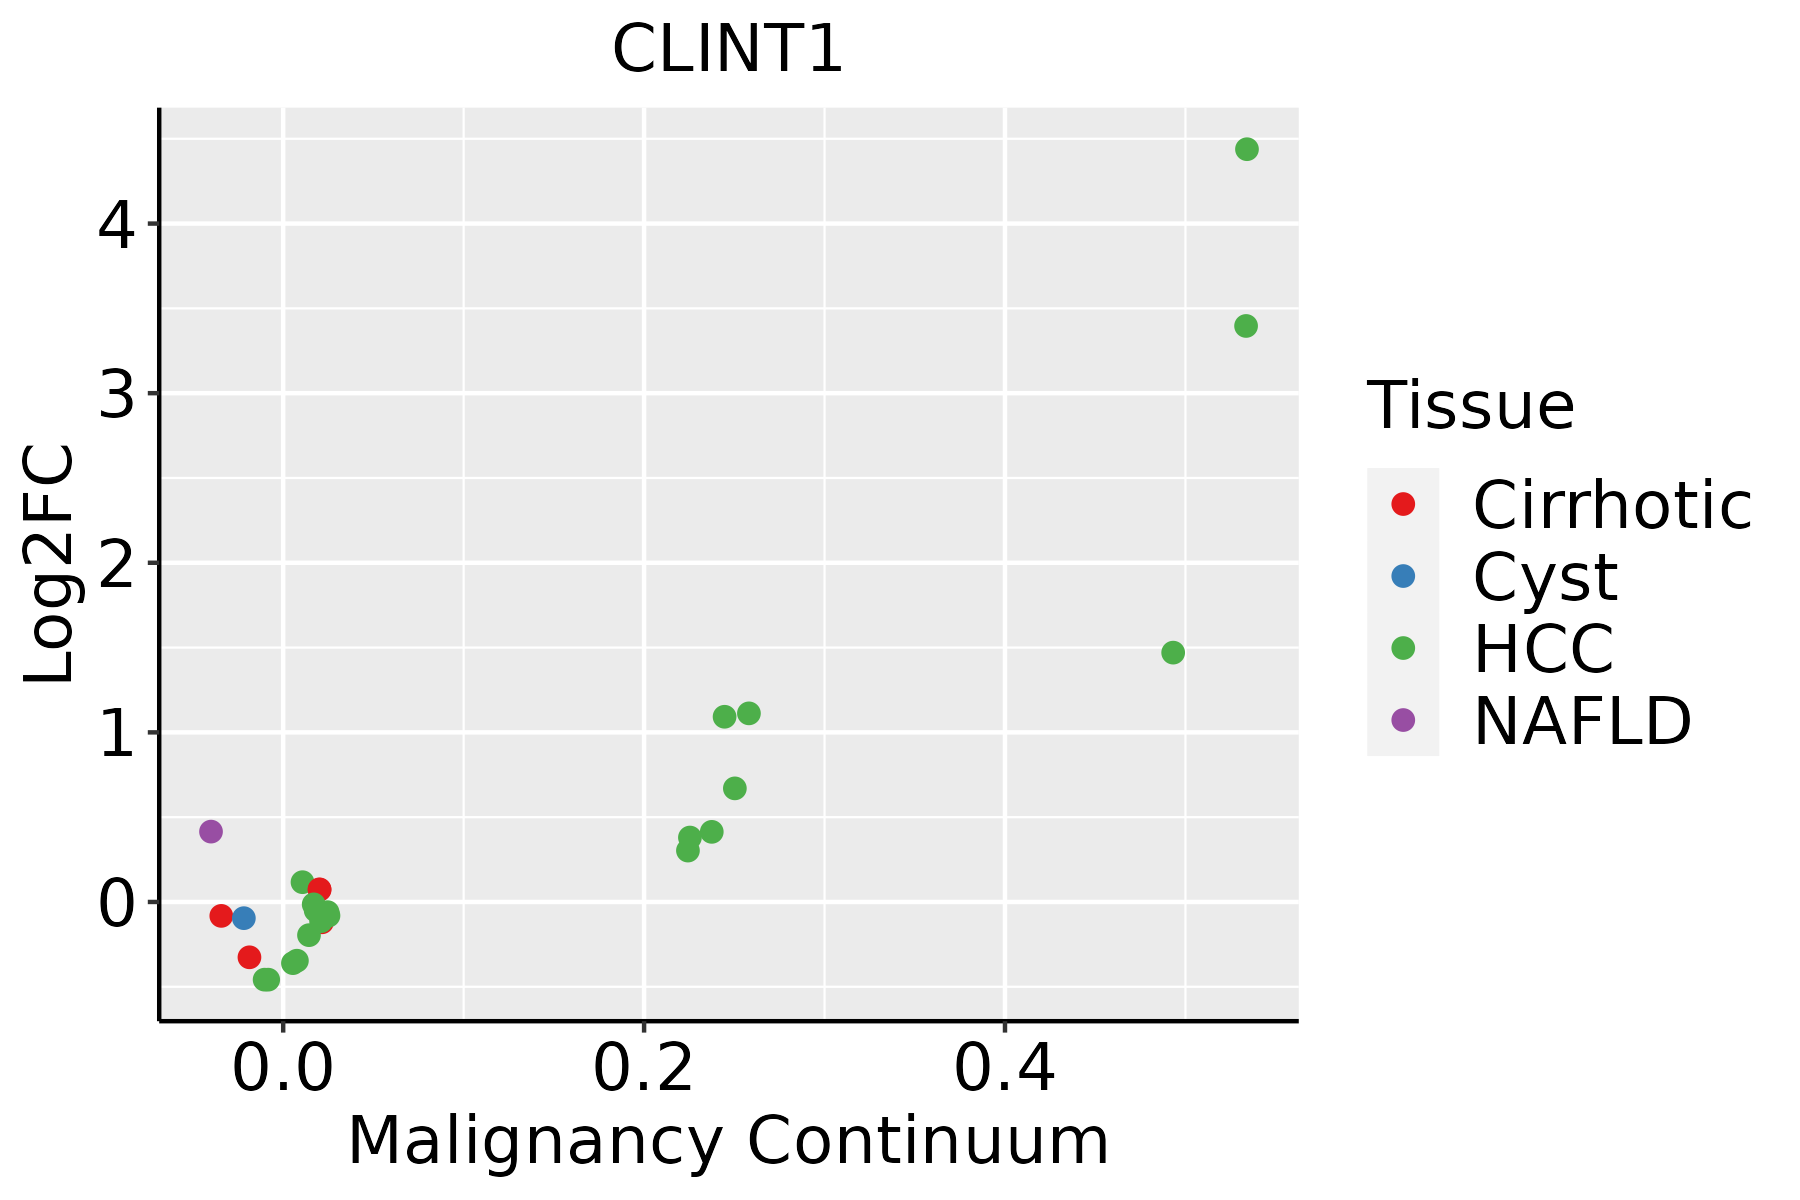 | HCC: Hepatocellular carcinoma |
| NAFLD: Non-alcoholic fatty liver disease | ||
| Oral Cavity |  | EOLP: Erosive Oral lichen planus |
| LP: leukoplakia | ||
| NEOLP: Non-erosive oral lichen planus | ||
| OSCC: Oral squamous cell carcinoma | ||
| Prostate | 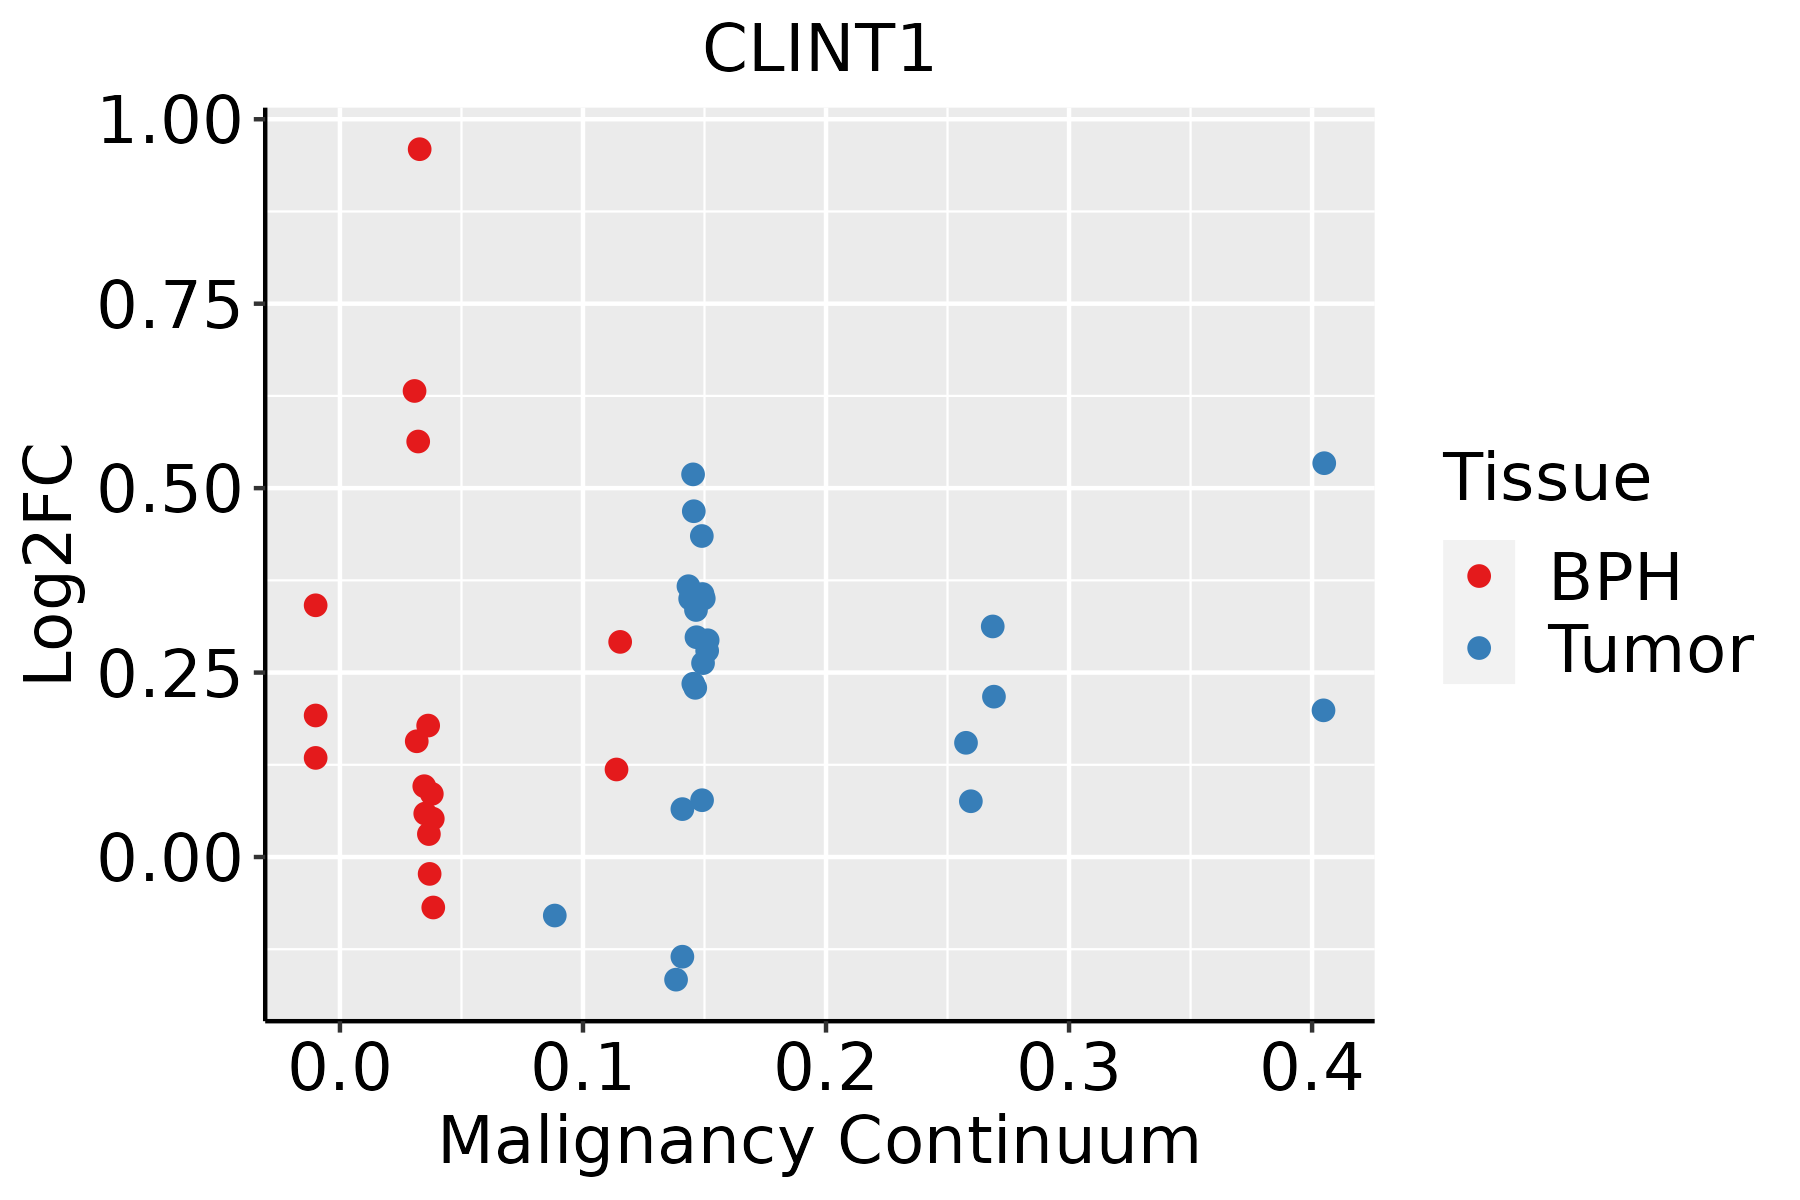 | BPH: Benign Prostatic Hyperplasia |
| Skin |  | AK: Actinic keratosis |
| cSCC: Cutaneous squamous cell carcinoma | ||
| SCCIS:squamous cell carcinoma in situ | ||
| Thyroid | 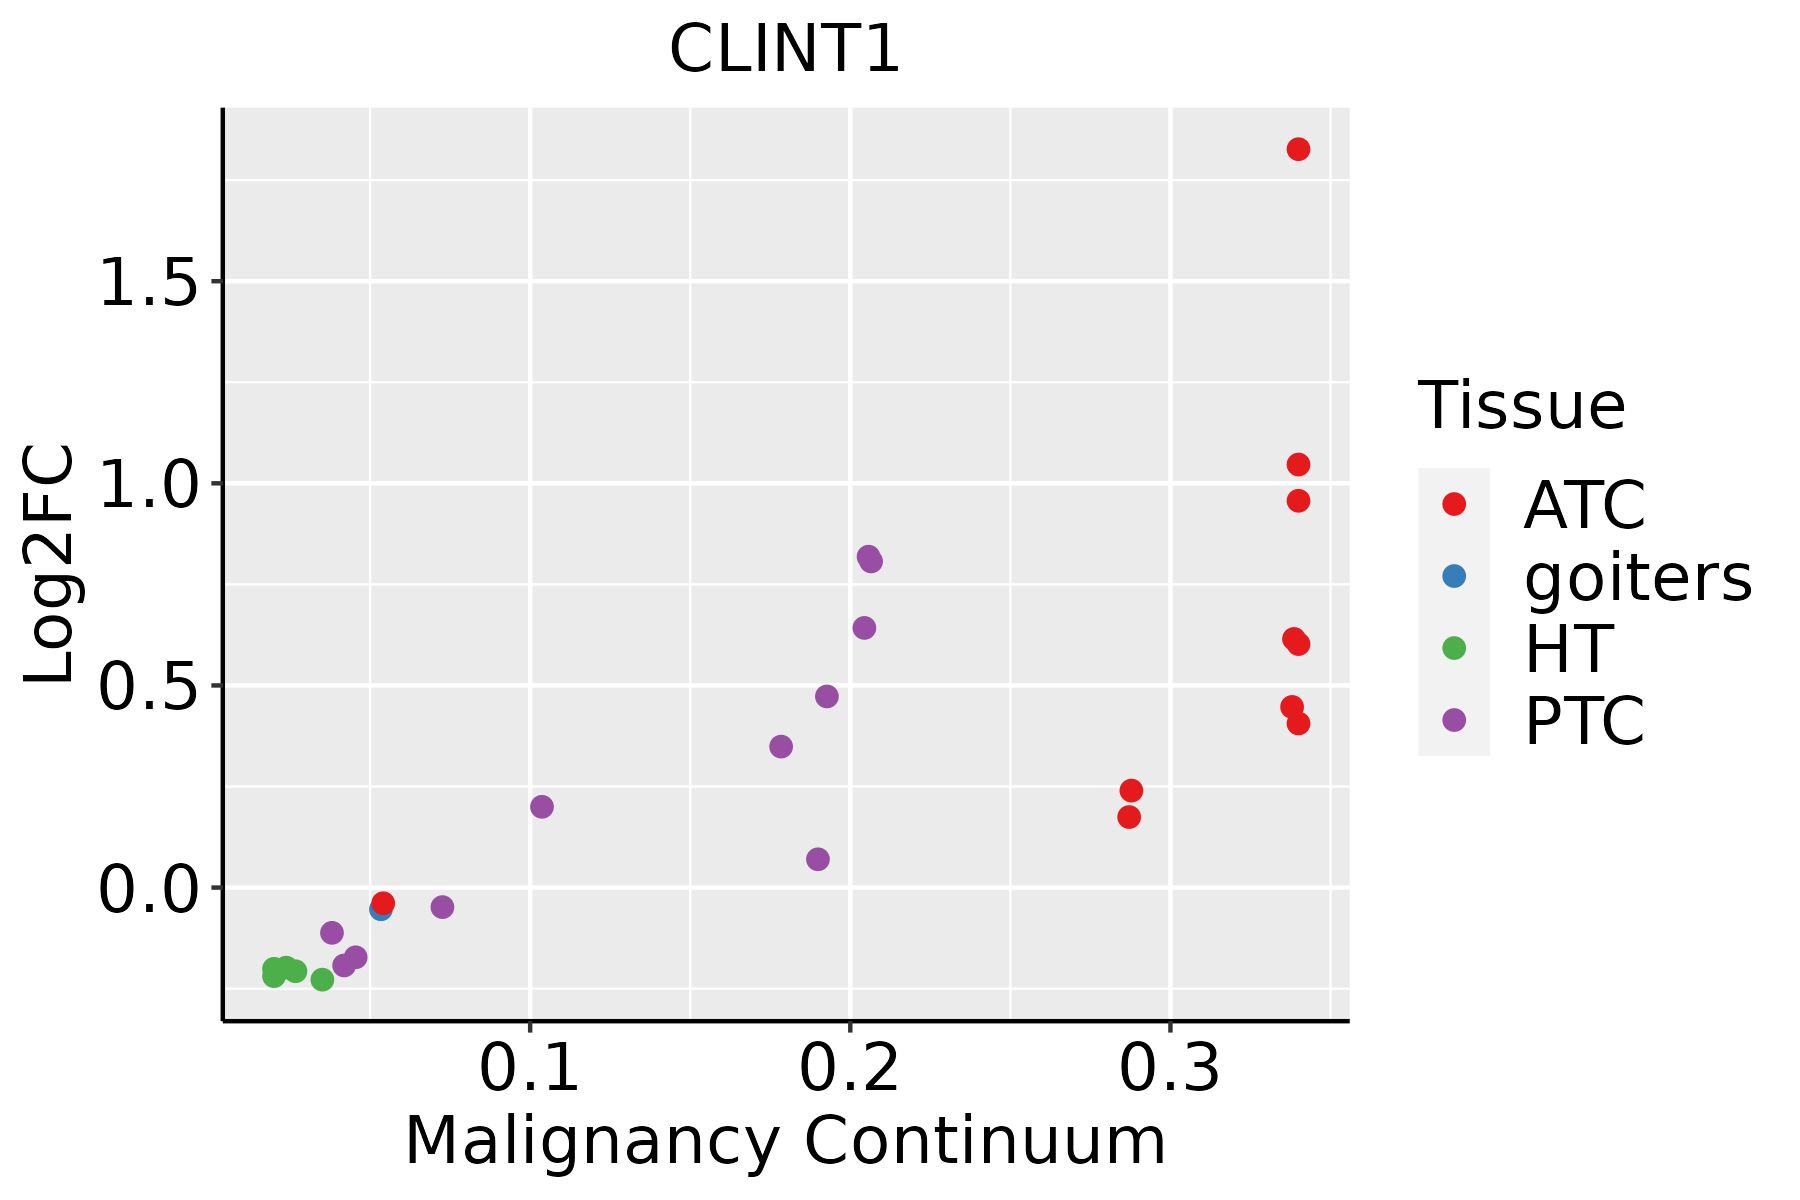 | ATC: Anaplastic thyroid cancer |
| HT: Hashimoto's thyroiditis | ||
| PTC: Papillary thyroid cancer |
| ∗log2FC in expression of this searched gene in stem-like cells from each diseased tissue sample relative to stem-like cells in normal samples in each tissue plotted against the malignancy continuum. Samples are colored based on if they are from different disease stage. |
Top |
Malignant transformation related pathway analysis |
| Find out the enriched GO biological processes and KEGG pathways involved in transition from healthy to precancer to cancer |
| Tissue | Disease Stage | Enriched GO biological Processes |
| Colorectum | AD |  |
| Colorectum | SER |  |
| Colorectum | MSS |  |
| Colorectum | MSI-H |  |
| Colorectum | FAP |  |
| ∗Top 15 enriched GO BP terms are showed in the bar plot of each disease state in each tissue. Each row represents a significant GO biological process which is colored according to the -log10(p.adjust). |
| Page: 1 2 3 4 5 6 7 8 9 |
| GO ID | Tissue | Disease Stage | Description | Gene Ratio | Bg Ratio | pvalue | p.adjust | Count |
| GO:0048268 | Colorectum | AD | clathrin coat assembly | 10/3918 | 18/18723 | 1.31e-03 | 1.15e-02 | 10 |
| GO:00482681 | Colorectum | MSS | clathrin coat assembly | 10/3467 | 18/18723 | 4.76e-04 | 5.58e-03 | 10 |
| GO:00482682 | Colorectum | FAP | clathrin coat assembly | 8/2622 | 18/18723 | 1.72e-03 | 1.51e-02 | 8 |
| GO:00482683 | Colorectum | CRC | clathrin coat assembly | 7/2078 | 18/18723 | 2.16e-03 | 2.11e-02 | 7 |
| GO:00482689 | Oral cavity | EOLP | clathrin coat assembly | 8/2218 | 18/18723 | 5.58e-04 | 4.74e-03 | 8 |
| GO:004826813 | Oral cavity | NEOLP | clathrin coat assembly | 9/2005 | 18/18723 | 3.59e-05 | 5.21e-04 | 9 |
| GO:00482688 | Prostate | BPH | clathrin coat assembly | 10/3107 | 18/18723 | 1.87e-04 | 1.55e-03 | 10 |
| GO:004826812 | Prostate | Tumor | clathrin coat assembly | 10/3246 | 18/18723 | 2.72e-04 | 2.24e-03 | 10 |
| GO:004826810 | Skin | AK | clathrin coat assembly | 6/1910 | 18/18723 | 7.04e-03 | 3.63e-02 | 6 |
| GO:004826814 | Skin | cSCC | clathrin coat assembly | 10/4864 | 18/18723 | 7.25e-03 | 3.44e-02 | 10 |
| GO:004826815 | Thyroid | PTC | clathrin coat assembly | 12/5968 | 18/18723 | 2.55e-03 | 1.31e-02 | 12 |
| GO:004826816 | Thyroid | ATC | clathrin coat assembly | 12/6293 | 18/18723 | 4.22e-03 | 1.79e-02 | 12 |
| Page: 1 |
| Pathway ID | Tissue | Disease Stage | Description | Gene Ratio | Bg Ratio | pvalue | p.adjust | qvalue | Count |
| Page: 1 |
Top |
Cell-cell communication analysis |
| Identification of potential cell-cell interactions between two cell types and their ligand-receptor pairs for different disease states |
| Ligand | Receptor | LRpair | Pathway | Tissue | Disease Stage |
| Page: 1 |
Top |
Single-cell gene regulatory network inference analysis |
| Find out the significant the regulons (TFs) and the target genes of each regulon across cell types for different disease states |
| TF | Cell Type | Tissue | Disease Stage | Target Gene | RSS | Regulon Activity |
| ∗The dot plots of a searched regulon are shown for all cell subpopulations in each disease state of each tissue based on the regulon specific score inferred using pySCENIC and by calculating the average expression. |
| Page: 1 |
Top |
Somatic mutation of malignant transformation related genes |
| Annotation of somatic variants for genes involved in malignant transformation |
| Hugo Symbol | Variant Class | Variant Classification | dbSNP RS | HGVSc | HGVSp | HGVSp Short | SWISSPROT | BIOTYPE | SIFT | PolyPhen | Tumor Sample Barcode | Tissue | Histology | Sex | Age | Stage | Therapy Types | Drugs | Outcome |
| CLINT1 | SNV | Missense_Mutation | novel | c.1521A>C | p.Leu507Phe | p.L507F | Q14677 | protein_coding | deleterious(0.01) | probably_damaging(0.999) | TCGA-AC-A8OP-01 | Breast | breast invasive carcinoma | Female | >=65 | I/II | Unknown | Unknown | SD |
| CLINT1 | SNV | Missense_Mutation | rs764235760 | c.95N>T | p.Thr32Met | p.T32M | Q14677 | protein_coding | deleterious(0) | probably_damaging(1) | TCGA-AR-A0TZ-01 | Breast | breast invasive carcinoma | Female | <65 | III/IV | Unspecific | Doxorubicin | PD |
| CLINT1 | SNV | Missense_Mutation | novel | c.968C>T | p.Ser323Phe | p.S323F | Q14677 | protein_coding | tolerated(0.53) | probably_damaging(0.969) | TCGA-BH-A42U-01 | Breast | breast invasive carcinoma | Female | >=65 | I/II | Unknown | Unknown | SD |
| CLINT1 | SNV | Missense_Mutation | rs751842472 | c.1696N>T | p.Pro566Ser | p.P566S | Q14677 | protein_coding | tolerated_low_confidence(0.48) | benign(0.001) | TCGA-EW-A1IZ-01 | Breast | breast invasive carcinoma | Female | <65 | III/IV | Chemotherapy | taxotere | SD |
| CLINT1 | insertion | Frame_Shift_Ins | novel | c.1807_1808insATGCAAAATTAATTGTTTTACCCTCA | p.Met603AsnfsTer17 | p.M603Nfs*17 | Q14677 | protein_coding | TCGA-AR-A0TY-01 | Breast | breast invasive carcinoma | Female | <65 | I/II | Unspecific | Paclitaxel | PD | ||
| CLINT1 | deletion | Frame_Shift_Del | novel | c.1668delN | p.Gln558LysfsTer5 | p.Q558Kfs*5 | Q14677 | protein_coding | TCGA-D8-A27V-01 | Breast | breast invasive carcinoma | Female | <65 | I/II | Hormone Therapy | tamoxiphen | SD | ||
| CLINT1 | deletion | Frame_Shift_Del | novel | c.886delN | p.Asp296ThrfsTer68 | p.D296Tfs*68 | Q14677 | protein_coding | TCGA-D8-A27V-01 | Breast | breast invasive carcinoma | Female | <65 | I/II | Hormone Therapy | tamoxiphen | SD | ||
| CLINT1 | SNV | Missense_Mutation | novel | c.1843G>A | p.Gly615Arg | p.G615R | Q14677 | protein_coding | tolerated(0.07) | benign(0.08) | TCGA-2W-A8YY-01 | Cervix | cervical & endocervical cancer | Female | <65 | I/II | Chemotherapy | cisplatin | CR |
| CLINT1 | SNV | Missense_Mutation | c.932N>G | p.Ser311Cys | p.S311C | Q14677 | protein_coding | deleterious(0.05) | possibly_damaging(0.479) | TCGA-Q1-A6DV-01 | Cervix | cervical & endocervical cancer | Female | <65 | I/II | Unknown | Unknown | SD | |
| CLINT1 | SNV | Missense_Mutation | c.431G>T | p.Arg144Met | p.R144M | Q14677 | protein_coding | deleterious(0) | probably_damaging(0.912) | TCGA-AA-3492-01 | Colorectum | colon adenocarcinoma | Female | >=65 | I/II | Unknown | Unknown | SD |
| Page: 1 2 3 4 5 6 |
Top |
Related drugs of malignant transformation related genes |
| Identification of chemicals and drugs interact with genes involved in malignant transfromation |
| (DGIdb 4.0) |
| Entrez ID | Symbol | Category | Interaction Types | Drug Claim Name | Drug Name | PMIDs |
| Page: 1 |

Copyright 2023-Present -The University of Texas Health Science Center at Houston |