
|
|||||
|
 | |
| |
| |
| |
| |
| |
|
Gene: CHORDC1 |
Gene summary for CHORDC1 |
| Gene information | Species | Human | Gene symbol | CHORDC1 | Gene ID | 26973 |
| Gene name | cysteine and histidine rich domain containing 1 | |
| Gene Alias | CHP1 | |
| Cytomap | 11q14.3 | |
| Gene Type | protein-coding | GO ID | GO:0000226 | UniProtAcc | Q9UHD1 |
Top |
Malignant transformation analysis |
| Identification of the aberrant gene expression in precancerous and cancerous lesions by comparing the gene expression of stem-like cells in diseased tissues with normal stem cells |
| Entrez ID | Symbol | Replicates | Species | Organ | Tissue | Adj P-value | Log2FC | Malignancy |
| 26973 | CHORDC1 | GSM5353232_PA_PR5249_T1_S3_L001 | Human | Prostate | Tumor | 3.17e-02 | -3.83e-01 | 0.1439 |
| 26973 | CHORDC1 | GSM5353240_PA_PR5254_T1_S15_L001 | Human | Prostate | Tumor | 2.76e-06 | -4.07e-01 | 0.1575 |
| 26973 | CHORDC1 | GSM5353243_PA_PR5261_T1_S23_L002 | Human | Prostate | Tumor | 1.46e-12 | -4.63e-01 | 0.1545 |
| 26973 | CHORDC1 | GSM5353244_PA_PR5261_T2_S24_L002 | Human | Prostate | Tumor | 3.95e-07 | -4.17e-01 | 0.1569 |
| 26973 | CHORDC1 | P1_S1_AK | Human | Skin | AK | 2.06e-02 | 3.18e-01 | -0.3399 |
| 26973 | CHORDC1 | P2_S3_AK | Human | Skin | AK | 8.97e-04 | 3.47e-01 | -0.3287 |
| 26973 | CHORDC1 | P3_S6_AK | Human | Skin | AK | 2.31e-11 | 4.71e-01 | -0.3256 |
| 26973 | CHORDC1 | P4_S8_cSCC | Human | Skin | cSCC | 1.43e-03 | 1.88e-01 | -0.3095 |
| 26973 | CHORDC1 | P5_S10_cSCC | Human | Skin | cSCC | 7.37e-14 | 4.16e-01 | -0.299 |
| 26973 | CHORDC1 | P1_cSCC | Human | Skin | cSCC | 2.65e-03 | 3.09e-01 | 0.0292 |
| 26973 | CHORDC1 | P2_cSCC | Human | Skin | cSCC | 1.82e-02 | 2.08e-01 | -0.024 |
| 26973 | CHORDC1 | P10_cSCC | Human | Skin | cSCC | 1.02e-22 | 8.82e-01 | 0.1017 |
| 26973 | CHORDC1 | cSCC_p11 | Human | Skin | cSCC | 8.99e-03 | -1.52e-01 | -0.2102 |
| 26973 | CHORDC1 | cSCC_p6 | Human | Skin | cSCC | 1.71e-03 | -1.73e-01 | -0.1989 |
| 26973 | CHORDC1 | cSCC_p7 | Human | Skin | cSCC | 5.51e-05 | -1.66e-01 | -0.2332 |
| 26973 | CHORDC1 | PTCwithHT_8 | Human | Thyroid | HT | 4.03e-02 | -2.54e-01 | 0.0351 |
| 26973 | CHORDC1 | male-WTA | Human | Thyroid | PTC | 4.54e-23 | -5.05e-02 | 0.1037 |
| 26973 | CHORDC1 | PTC01 | Human | Thyroid | PTC | 1.35e-08 | 2.25e-02 | 0.1899 |
| 26973 | CHORDC1 | PTC04 | Human | Thyroid | PTC | 4.93e-10 | 2.06e-01 | 0.1927 |
| 26973 | CHORDC1 | PTC05 | Human | Thyroid | PTC | 8.08e-15 | 1.13e+00 | 0.2065 |
| Page: 1 2 3 4 5 6 7 |
| Tissue | Expression Dynamics | Abbreviation |
| Esophagus |  | ESCC: Esophageal squamous cell carcinoma |
| HGIN: High-grade intraepithelial neoplasias | ||
| LGIN: Low-grade intraepithelial neoplasias | ||
| Liver |  | HCC: Hepatocellular carcinoma |
| NAFLD: Non-alcoholic fatty liver disease | ||
| Oral Cavity |  | EOLP: Erosive Oral lichen planus |
| LP: leukoplakia | ||
| NEOLP: Non-erosive oral lichen planus | ||
| OSCC: Oral squamous cell carcinoma | ||
| Prostate | 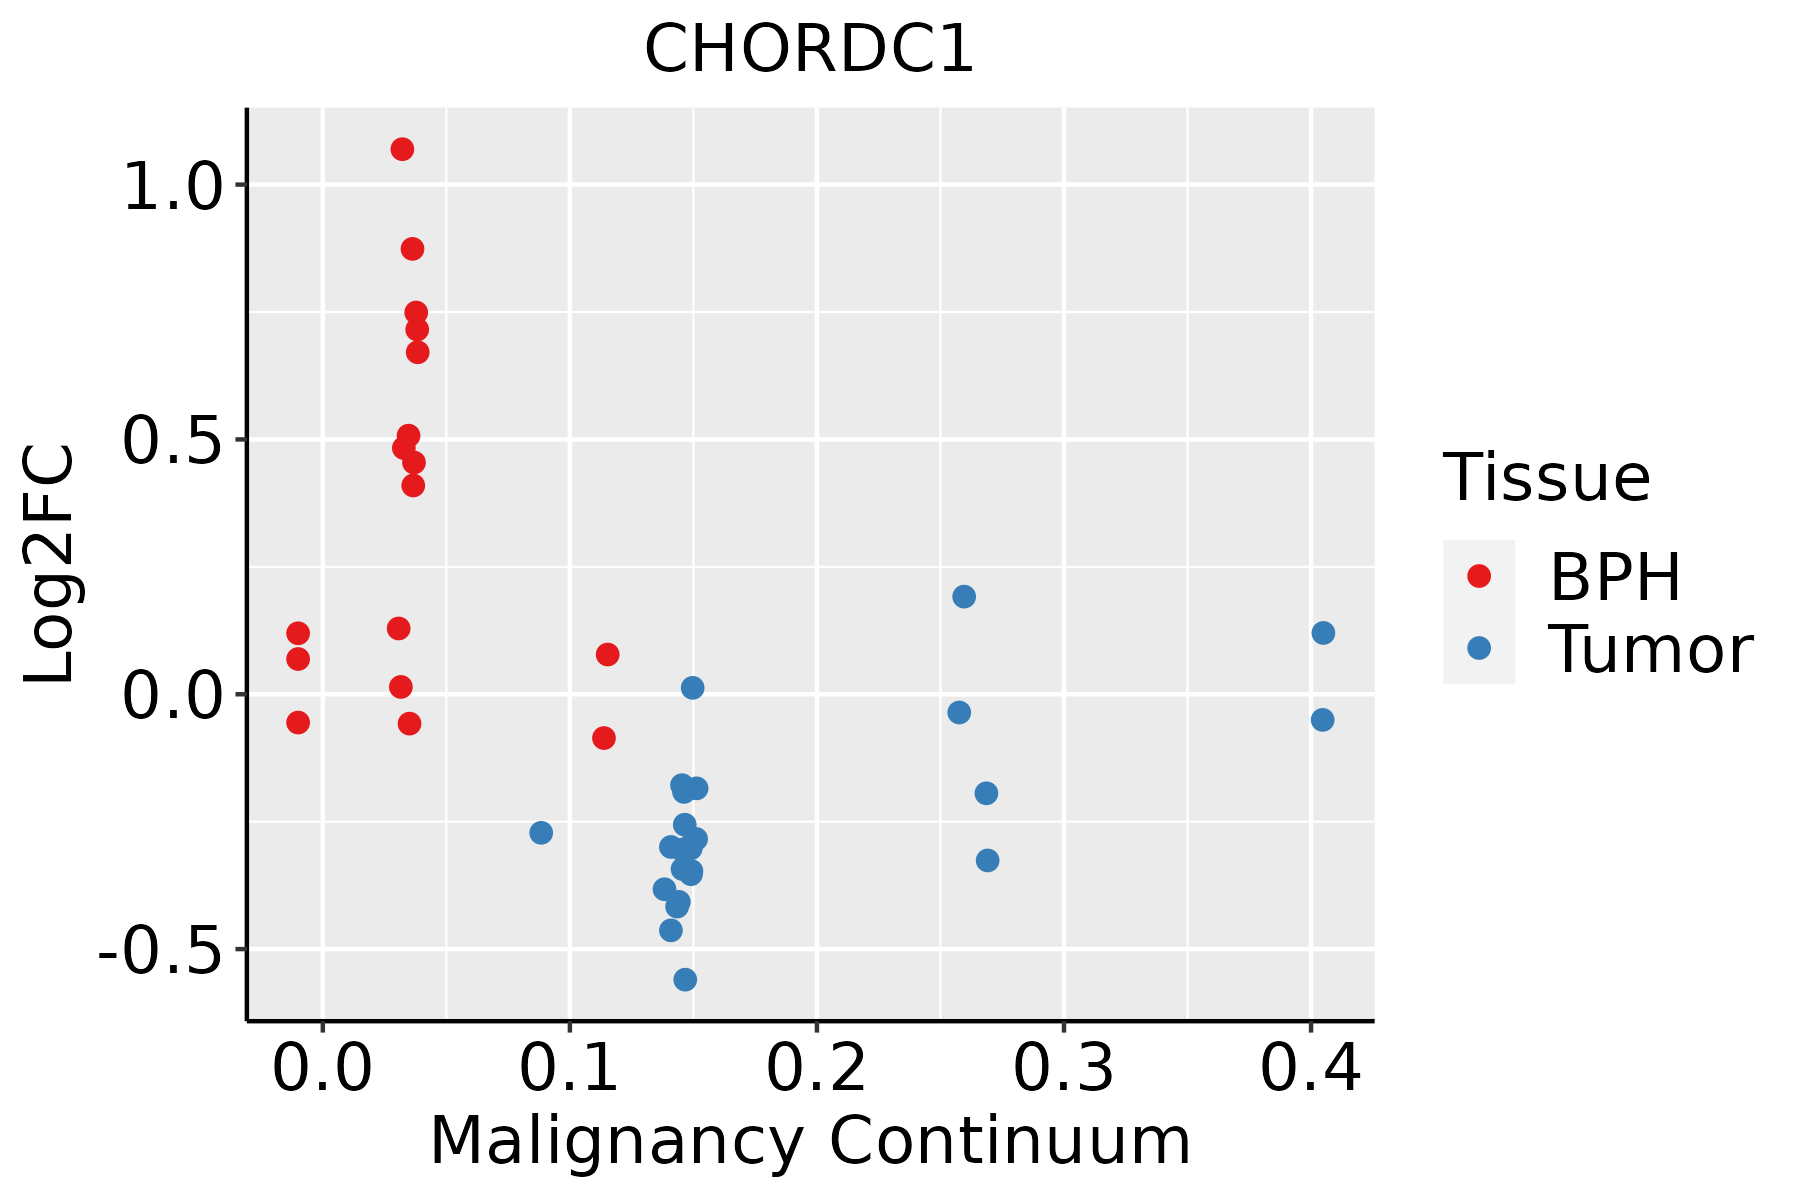 | BPH: Benign Prostatic Hyperplasia |
| Skin | 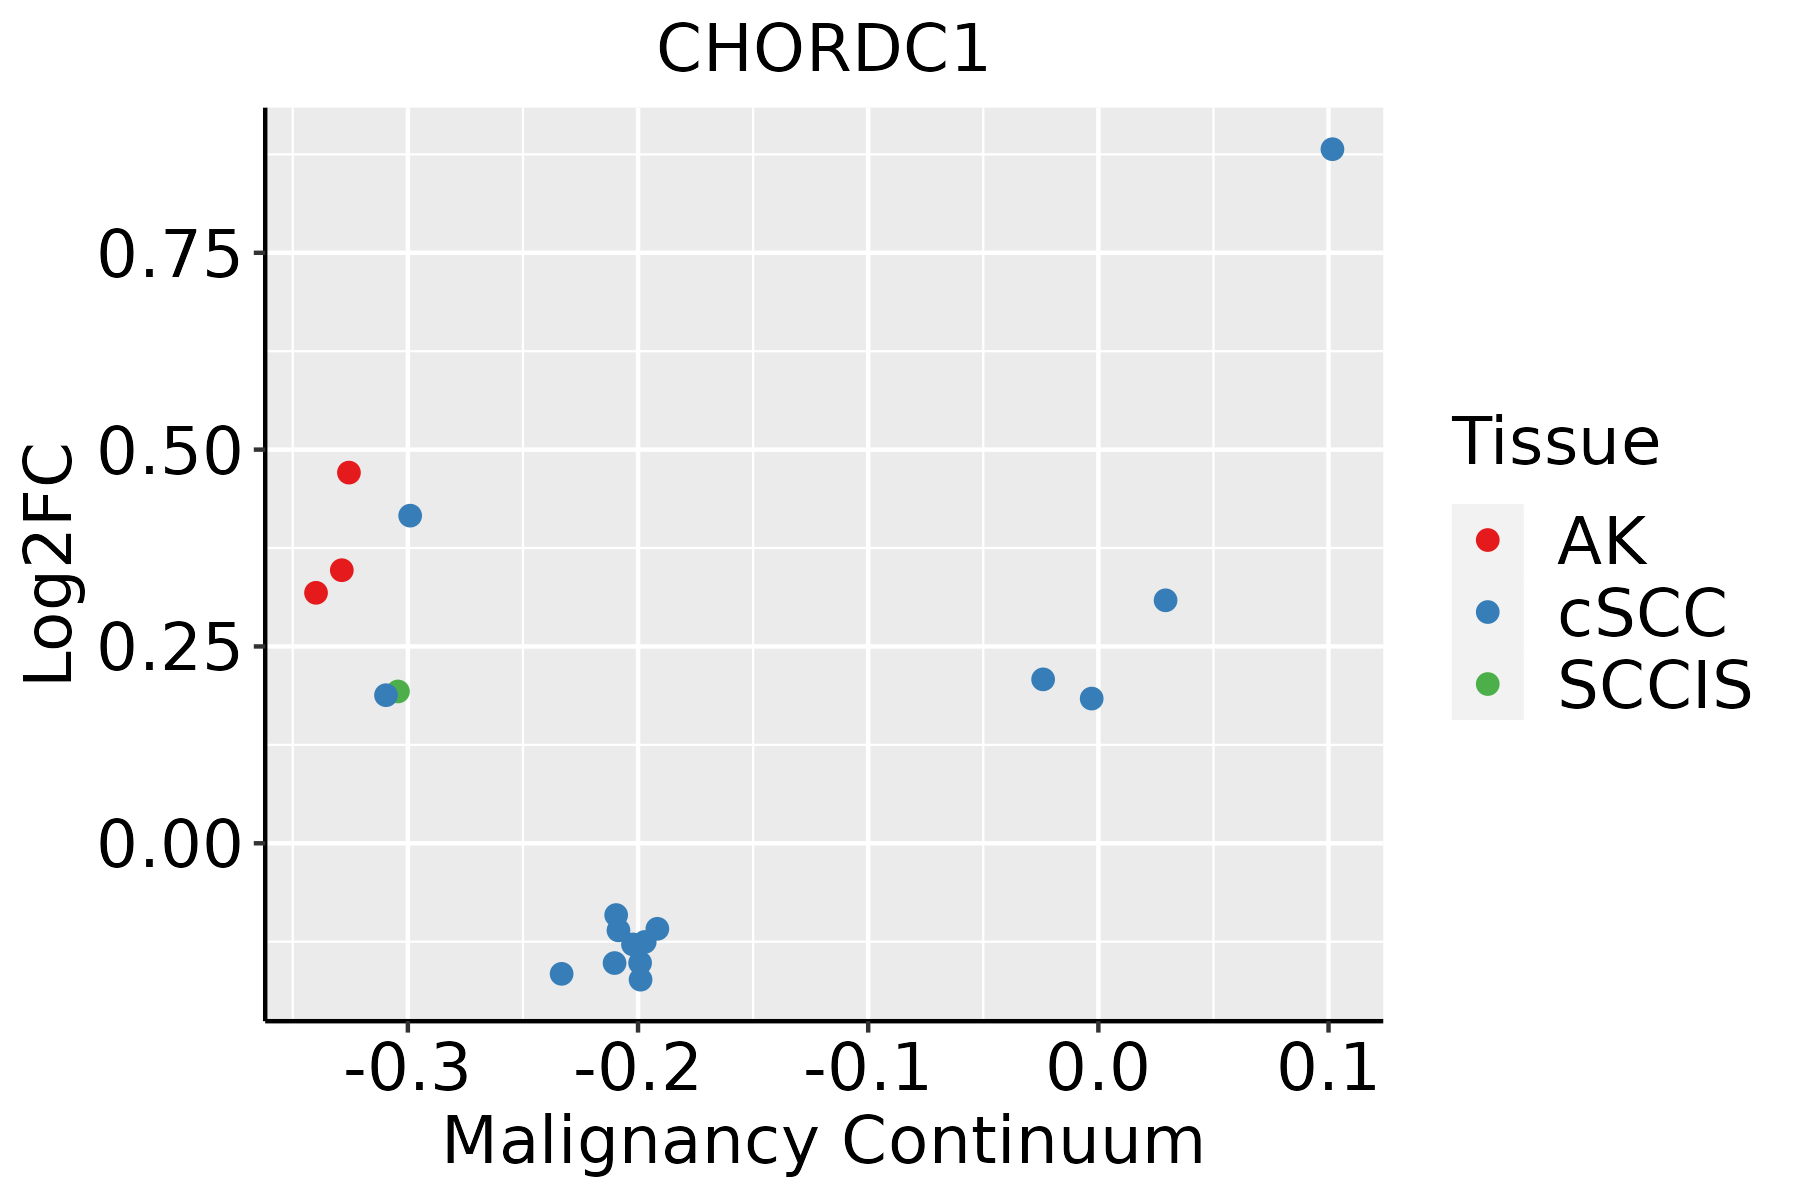 | AK: Actinic keratosis |
| cSCC: Cutaneous squamous cell carcinoma | ||
| SCCIS:squamous cell carcinoma in situ | ||
| Thyroid | 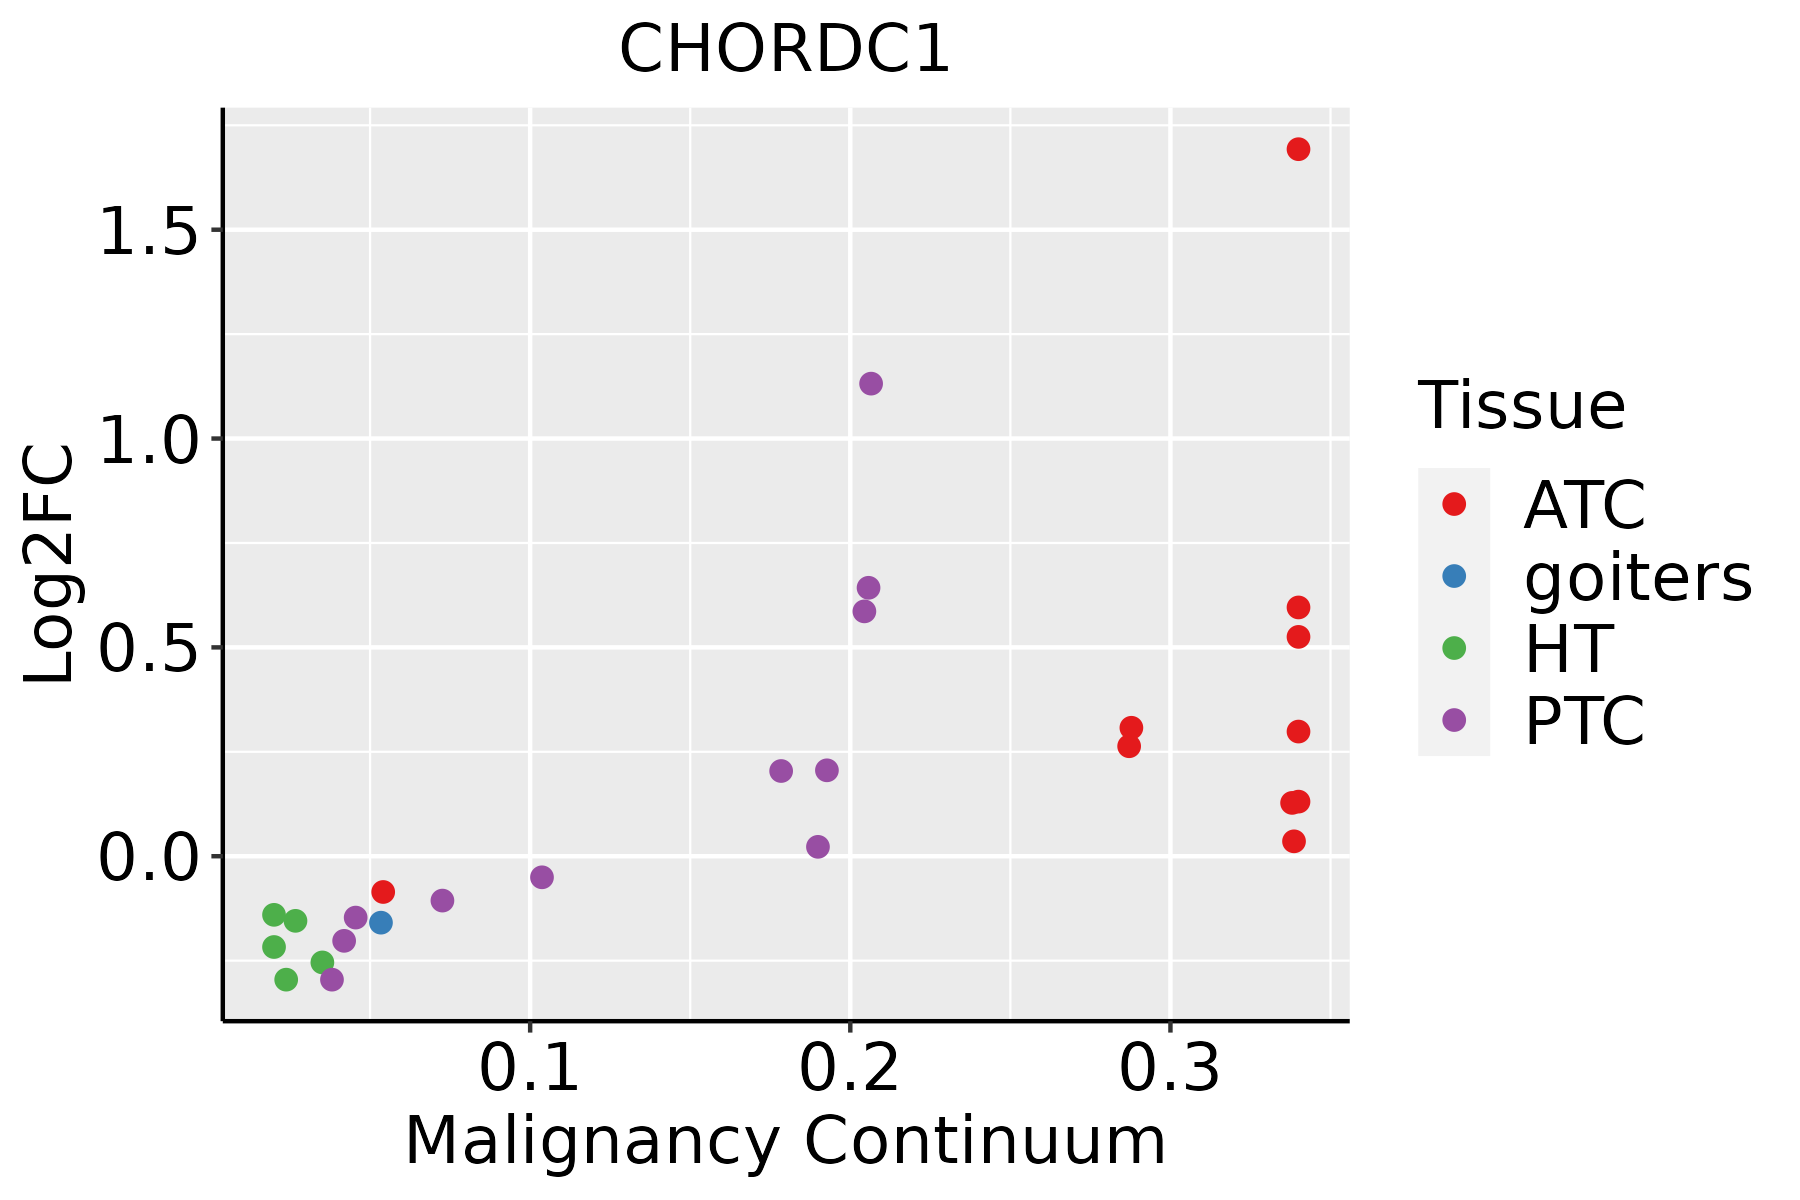 | ATC: Anaplastic thyroid cancer |
| HT: Hashimoto's thyroiditis | ||
| PTC: Papillary thyroid cancer |
| ∗log2FC in expression of this searched gene in stem-like cells from each diseased tissue sample relative to stem-like cells in normal samples in each tissue plotted against the malignancy continuum. Samples are colored based on if they are from different disease stage. |
Top |
Malignant transformation related pathway analysis |
| Find out the enriched GO biological processes and KEGG pathways involved in transition from healthy to precancer to cancer |
| Tissue | Disease Stage | Enriched GO biological Processes |
| Colorectum | AD |  |
| Colorectum | SER |  |
| Colorectum | MSS |  |
| Colorectum | MSI-H |  |
| Colorectum | FAP |  |
| ∗Top 15 enriched GO BP terms are showed in the bar plot of each disease state in each tissue. Each row represents a significant GO biological process which is colored according to the -log10(p.adjust). |
| Page: 1 2 3 4 5 6 7 8 9 |
| GO ID | Tissue | Disease Stage | Description | Gene Ratio | Bg Ratio | pvalue | p.adjust | Count |
| GO:000645720 | Esophagus | HGIN | protein folding | 75/2587 | 212/18723 | 1.61e-15 | 3.86e-13 | 75 |
| GO:003460520 | Esophagus | HGIN | cellular response to heat | 30/2587 | 69/18723 | 1.78e-09 | 1.35e-07 | 30 |
| GO:006107720 | Esophagus | HGIN | chaperone-mediated protein folding | 27/2587 | 67/18723 | 7.99e-08 | 4.20e-06 | 27 |
| GO:000940819 | Esophagus | HGIN | response to heat | 34/2587 | 110/18723 | 2.94e-06 | 1.01e-04 | 34 |
| GO:004593626 | Esophagus | HGIN | negative regulation of phosphate metabolic process | 89/2587 | 441/18723 | 1.24e-04 | 2.54e-03 | 89 |
| GO:001056326 | Esophagus | HGIN | negative regulation of phosphorus metabolic process | 89/2587 | 442/18723 | 1.34e-04 | 2.71e-03 | 89 |
| GO:004232620 | Esophagus | HGIN | negative regulation of phosphorylation | 78/2587 | 385/18723 | 2.77e-04 | 4.77e-03 | 78 |
| GO:000926618 | Esophagus | HGIN | response to temperature stimulus | 42/2587 | 178/18723 | 2.91e-04 | 4.98e-03 | 42 |
| GO:000193320 | Esophagus | HGIN | negative regulation of protein phosphorylation | 69/2587 | 342/18723 | 6.81e-04 | 9.26e-03 | 69 |
| GO:005134827 | Esophagus | HGIN | negative regulation of transferase activity | 55/2587 | 268/18723 | 1.51e-03 | 1.74e-02 | 55 |
| GO:19000344 | Esophagus | HGIN | regulation of cellular response to heat | 7/2587 | 17/18723 | 5.21e-03 | 4.30e-02 | 7 |
| GO:0006457110 | Esophagus | ESCC | protein folding | 163/8552 | 212/18723 | 1.13e-20 | 1.74e-18 | 163 |
| GO:0010563111 | Esophagus | ESCC | negative regulation of phosphorus metabolic process | 274/8552 | 442/18723 | 2.32e-12 | 9.41e-11 | 274 |
| GO:0045936111 | Esophagus | ESCC | negative regulation of phosphate metabolic process | 273/8552 | 441/18723 | 3.18e-12 | 1.25e-10 | 273 |
| GO:0051348111 | Esophagus | ESCC | negative regulation of transferase activity | 177/8552 | 268/18723 | 1.08e-11 | 4.00e-10 | 177 |
| GO:007190016 | Esophagus | ESCC | regulation of protein serine/threonine kinase activity | 227/8552 | 359/18723 | 1.12e-11 | 4.10e-10 | 227 |
| GO:0061077110 | Esophagus | ESCC | chaperone-mediated protein folding | 56/8552 | 67/18723 | 1.52e-10 | 4.36e-09 | 56 |
| GO:0042326111 | Esophagus | ESCC | negative regulation of phosphorylation | 237/8552 | 385/18723 | 1.86e-10 | 5.33e-09 | 237 |
| GO:0001933111 | Esophagus | ESCC | negative regulation of protein phosphorylation | 213/8552 | 342/18723 | 3.54e-10 | 9.76e-09 | 213 |
| GO:003367319 | Esophagus | ESCC | negative regulation of kinase activity | 154/8552 | 237/18723 | 1.38e-09 | 3.27e-08 | 154 |
| Page: 1 2 3 4 5 6 7 8 9 10 11 |
| Pathway ID | Tissue | Disease Stage | Description | Gene Ratio | Bg Ratio | pvalue | p.adjust | qvalue | Count |
| Page: 1 |
Top |
Cell-cell communication analysis |
| Identification of potential cell-cell interactions between two cell types and their ligand-receptor pairs for different disease states |
| Ligand | Receptor | LRpair | Pathway | Tissue | Disease Stage |
| Page: 1 |
Top |
Single-cell gene regulatory network inference analysis |
| Find out the significant the regulons (TFs) and the target genes of each regulon across cell types for different disease states |
| TF | Cell Type | Tissue | Disease Stage | Target Gene | RSS | Regulon Activity |
| ∗The dot plots of a searched regulon are shown for all cell subpopulations in each disease state of each tissue based on the regulon specific score inferred using pySCENIC and by calculating the average expression. |
| Page: 1 |
Top |
Somatic mutation of malignant transformation related genes |
| Annotation of somatic variants for genes involved in malignant transformation |
| Hugo Symbol | Variant Class | Variant Classification | dbSNP RS | HGVSc | HGVSp | HGVSp Short | SWISSPROT | BIOTYPE | SIFT | PolyPhen | Tumor Sample Barcode | Tissue | Histology | Sex | Age | Stage | Therapy Types | Drugs | Outcome |
| CHORDC1 | SNV | Missense_Mutation | c.418N>A | p.Glu140Lys | p.E140K | Q9UHD1 | protein_coding | tolerated(0.2) | benign(0.001) | TCGA-5L-AAT1-01 | Breast | breast invasive carcinoma | Female | <65 | III/IV | Hormone Therapy | letrozol | SD | |
| CHORDC1 | SNV | Missense_Mutation | c.49G>C | p.Glu17Gln | p.E17Q | Q9UHD1 | protein_coding | tolerated(0.14) | benign(0.062) | TCGA-AC-A23H-01 | Breast | breast invasive carcinoma | Female | >=65 | I/II | Unknown | Unknown | PD | |
| CHORDC1 | SNV | Missense_Mutation | novel | c.859G>A | p.Asp287Asn | p.D287N | Q9UHD1 | protein_coding | tolerated(0.21) | possibly_damaging(0.649) | TCGA-AC-A5XS-01 | Breast | breast invasive carcinoma | Female | >=65 | I/II | Hormone Therapy | femara | SD |
| CHORDC1 | SNV | Missense_Mutation | c.567N>A | p.Met189Ile | p.M189I | Q9UHD1 | protein_coding | deleterious(0.01) | possibly_damaging(0.908) | TCGA-BH-A1FC-01 | Breast | breast invasive carcinoma | Female | >=65 | I/II | Unknown | Unknown | SD | |
| CHORDC1 | SNV | Missense_Mutation | c.391N>A | p.Asp131Asn | p.D131N | Q9UHD1 | protein_coding | deleterious(0.02) | benign(0.187) | TCGA-D8-A1XQ-01 | Breast | breast invasive carcinoma | Female | >=65 | I/II | Unknown | Unknown | SD | |
| CHORDC1 | deletion | Frame_Shift_Del | novel | c.366delN | p.Ser123LeufsTer4 | p.S123Lfs*4 | Q9UHD1 | protein_coding | TCGA-D8-A27V-01 | Breast | breast invasive carcinoma | Female | <65 | I/II | Hormone Therapy | tamoxiphen | SD | ||
| CHORDC1 | SNV | Missense_Mutation | c.567N>A | p.Met189Ile | p.M189I | Q9UHD1 | protein_coding | deleterious(0.01) | possibly_damaging(0.908) | TCGA-ZJ-AAXN-01 | Cervix | cervical & endocervical cancer | Female | <65 | I/II | Unknown | Unknown | SD | |
| CHORDC1 | SNV | Missense_Mutation | novel | c.355N>A | p.Glu119Lys | p.E119K | Q9UHD1 | protein_coding | tolerated(0.33) | benign(0.001) | TCGA-ZJ-AAXT-01 | Cervix | cervical & endocervical cancer | Female | <65 | III/IV | Unknown | Unknown | SD |
| CHORDC1 | SNV | Missense_Mutation | novel | c.950T>C | p.Leu317Pro | p.L317P | Q9UHD1 | protein_coding | tolerated(0.12) | possibly_damaging(0.707) | TCGA-AZ-4315-01 | Colorectum | colon adenocarcinoma | Male | <65 | I/II | Unknown | Unknown | SD |
| CHORDC1 | SNV | Missense_Mutation | c.265A>G | p.Lys89Glu | p.K89E | Q9UHD1 | protein_coding | deleterious(0.01) | possibly_damaging(0.449) | TCGA-AF-2690-01 | Colorectum | rectum adenocarcinoma | Female | >=65 | III/IV | Unknown | Unknown | SD |
| Page: 1 2 3 4 |
Top |
Related drugs of malignant transformation related genes |
| Identification of chemicals and drugs interact with genes involved in malignant transfromation |
| (DGIdb 4.0) |
| Entrez ID | Symbol | Category | Interaction Types | Drug Claim Name | Drug Name | PMIDs |
| Page: 1 |

Copyright 2023-Present -The University of Texas Health Science Center at Houston |