
|
|||||
|
 | |
| |
| |
| |
| |
| |
|
Gene: CAPN1 |
Gene summary for CAPN1 |
| Gene information | Species | Human | Gene symbol | CAPN1 | Gene ID | 823 |
| Gene name | calpain 1 | |
| Gene Alias | CANP | |
| Cytomap | 11q13.1 | |
| Gene Type | protein-coding | GO ID | GO:0006508 | UniProtAcc | B2RDI5 |
Top |
Malignant transformation analysis |
| Identification of the aberrant gene expression in precancerous and cancerous lesions by comparing the gene expression of stem-like cells in diseased tissues with normal stem cells |
| Entrez ID | Symbol | Replicates | Species | Organ | Tissue | Adj P-value | Log2FC | Malignancy |
| 823 | CAPN1 | P127T-E | Human | Esophagus | ESCC | 9.28e-51 | 1.11e+00 | 0.0826 |
| 823 | CAPN1 | P128T-E | Human | Esophagus | ESCC | 4.76e-61 | 2.53e+00 | 0.1241 |
| 823 | CAPN1 | P130T-E | Human | Esophagus | ESCC | 2.11e-98 | 2.36e+00 | 0.1676 |
| 823 | CAPN1 | S43 | Human | Liver | Cirrhotic | 2.93e-05 | -1.93e-01 | -0.0187 |
| 823 | CAPN1 | HCC1_Meng | Human | Liver | HCC | 1.11e-29 | -1.56e-01 | 0.0246 |
| 823 | CAPN1 | HCC2_Meng | Human | Liver | HCC | 3.31e-48 | 2.69e-01 | 0.0107 |
| 823 | CAPN1 | cirrhotic1 | Human | Liver | Cirrhotic | 5.41e-06 | 1.00e-01 | 0.0202 |
| 823 | CAPN1 | cirrhotic2 | Human | Liver | Cirrhotic | 8.48e-14 | 2.95e-01 | 0.0201 |
| 823 | CAPN1 | cirrhotic3 | Human | Liver | Cirrhotic | 2.66e-03 | 1.39e-01 | 0.0215 |
| 823 | CAPN1 | HCC1 | Human | Liver | HCC | 2.53e-06 | 4.11e+00 | 0.5336 |
| 823 | CAPN1 | HCC2 | Human | Liver | HCC | 1.41e-04 | 3.07e+00 | 0.5341 |
| 823 | CAPN1 | Pt13.b | Human | Liver | HCC | 4.14e-04 | -4.77e-02 | 0.0251 |
| 823 | CAPN1 | S014 | Human | Liver | HCC | 1.26e-24 | 1.15e+00 | 0.2254 |
| 823 | CAPN1 | S015 | Human | Liver | HCC | 8.29e-18 | 1.18e+00 | 0.2375 |
| 823 | CAPN1 | S016 | Human | Liver | HCC | 3.51e-25 | 1.07e+00 | 0.2243 |
| 823 | CAPN1 | S027 | Human | Liver | HCC | 4.60e-12 | 1.41e+00 | 0.2446 |
| 823 | CAPN1 | S028 | Human | Liver | HCC | 1.07e-27 | 1.41e+00 | 0.2503 |
| 823 | CAPN1 | S029 | Human | Liver | HCC | 8.17e-27 | 1.42e+00 | 0.2581 |
| 823 | CAPN1 | C04 | Human | Oral cavity | OSCC | 1.89e-32 | 1.97e+00 | 0.2633 |
| 823 | CAPN1 | C21 | Human | Oral cavity | OSCC | 2.48e-84 | 3.92e+00 | 0.2678 |
| Page: 1 2 3 4 5 6 7 8 9 |
| Tissue | Expression Dynamics | Abbreviation |
| Colorectum (GSE201348) |  | FAP: Familial adenomatous polyposis |
| CRC: Colorectal cancer | ||
| Colorectum (HTA11) |  | AD: Adenomas |
| SER: Sessile serrated lesions | ||
| MSI-H: Microsatellite-high colorectal cancer | ||
| MSS: Microsatellite stable colorectal cancer | ||
| Esophagus | 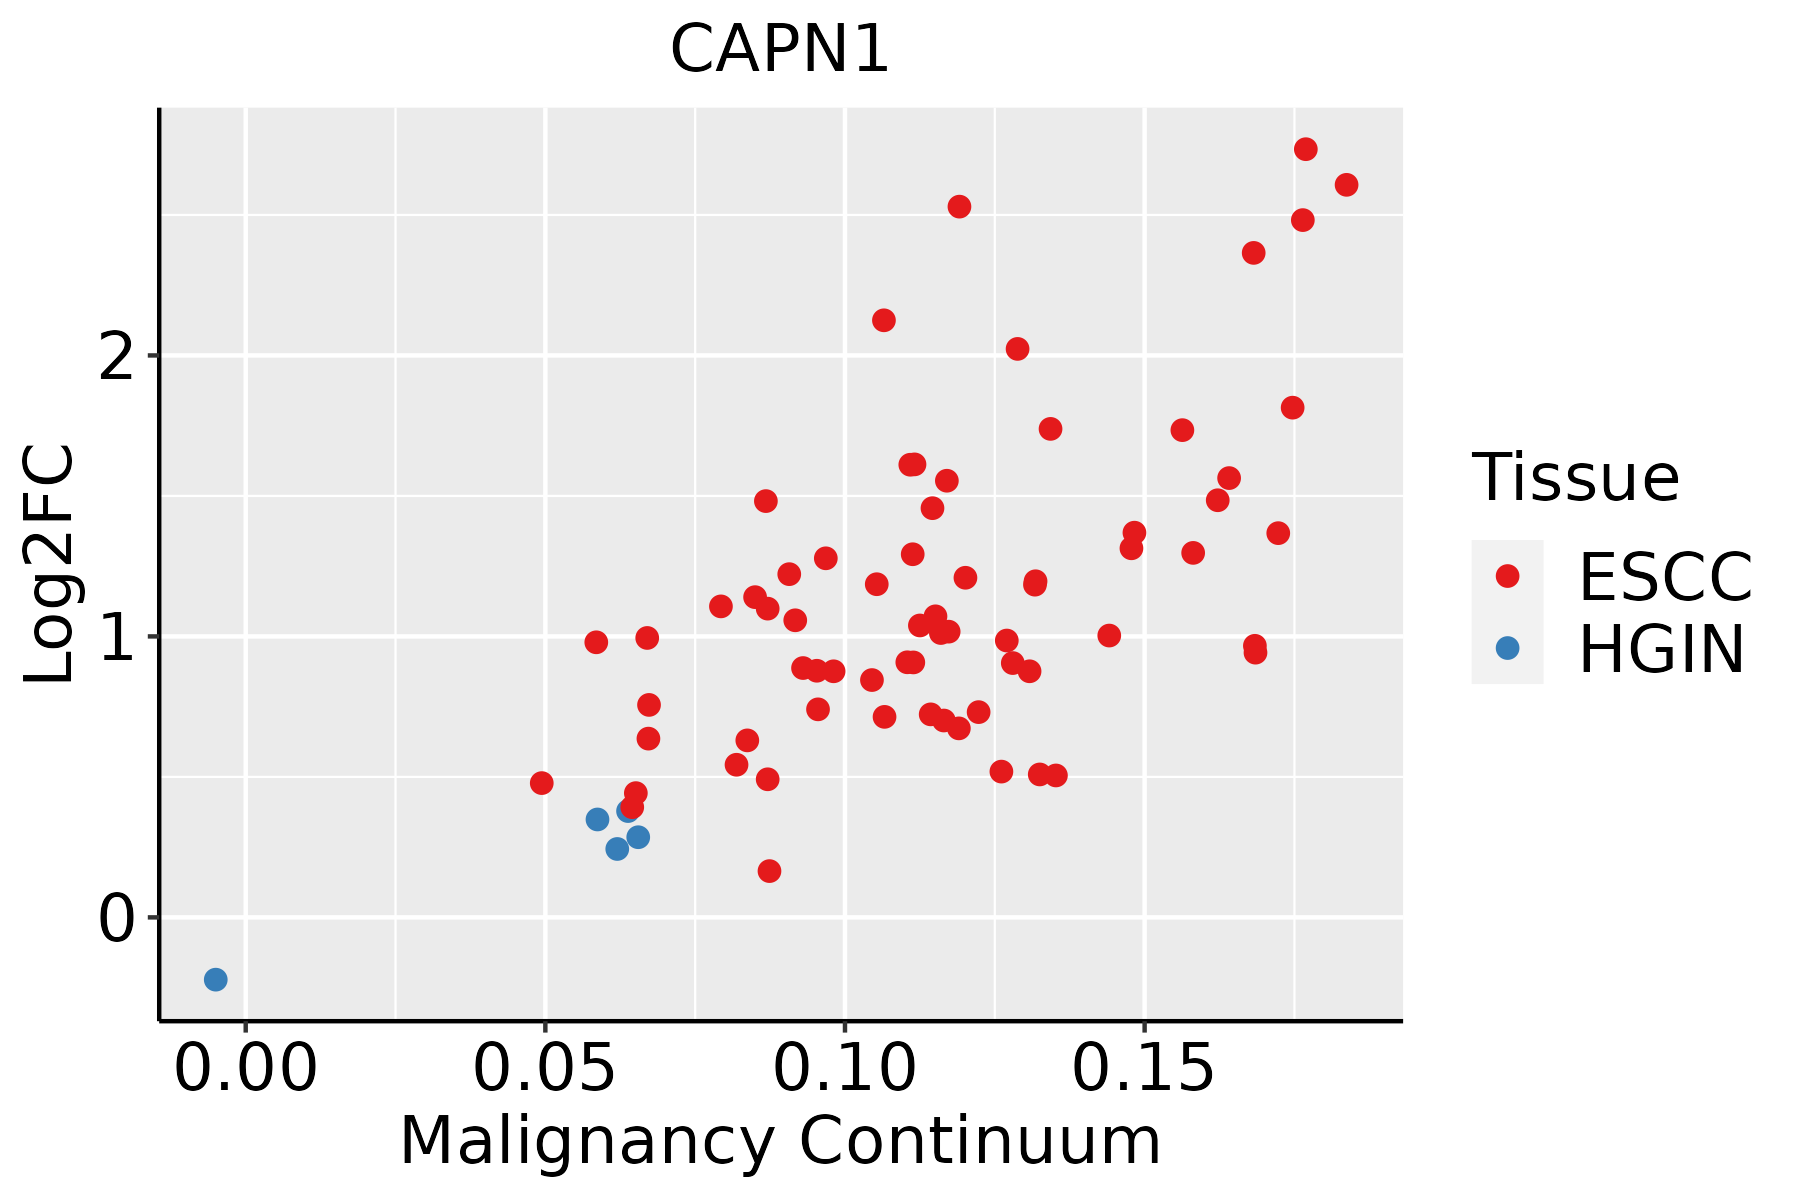 | ESCC: Esophageal squamous cell carcinoma |
| HGIN: High-grade intraepithelial neoplasias | ||
| LGIN: Low-grade intraepithelial neoplasias | ||
| Liver | 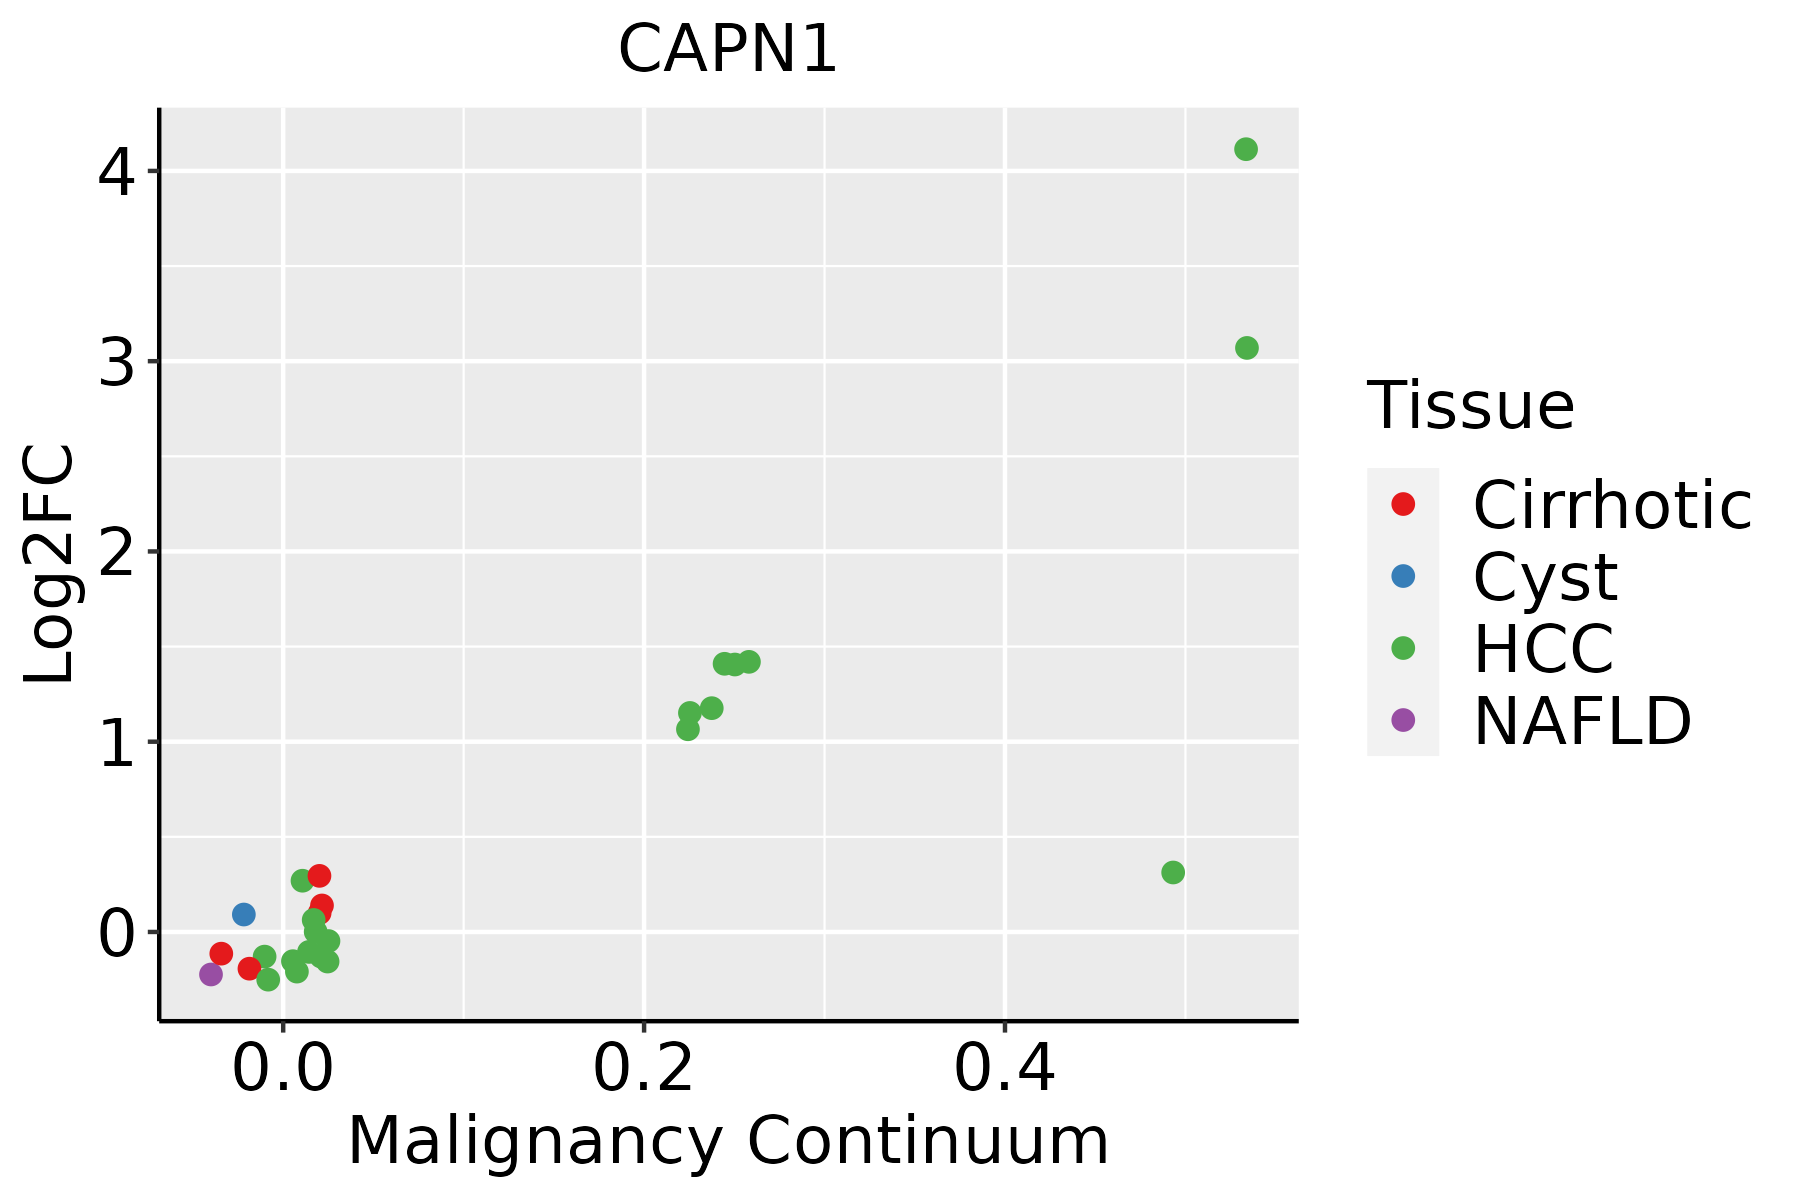 | HCC: Hepatocellular carcinoma |
| NAFLD: Non-alcoholic fatty liver disease | ||
| Oral Cavity | 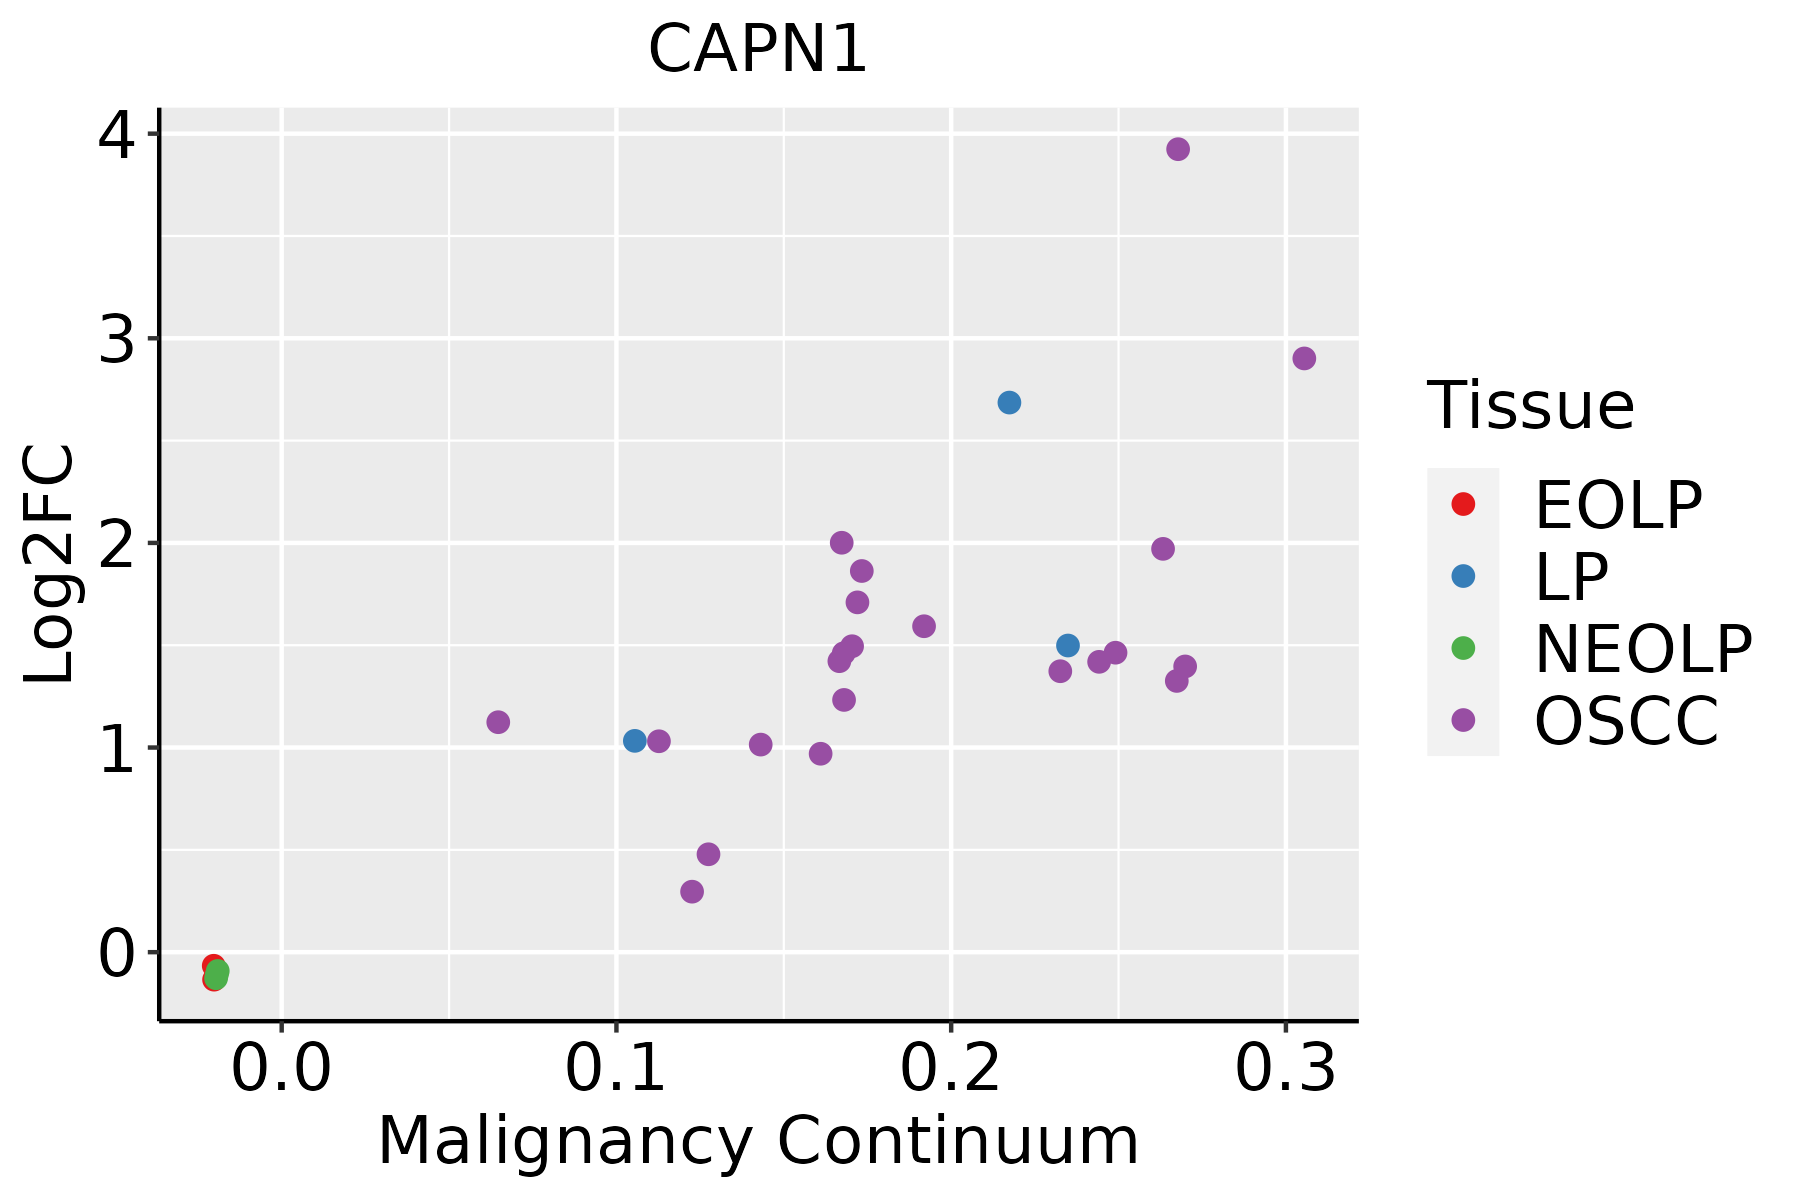 | EOLP: Erosive Oral lichen planus |
| LP: leukoplakia | ||
| NEOLP: Non-erosive oral lichen planus | ||
| OSCC: Oral squamous cell carcinoma | ||
| Skin | 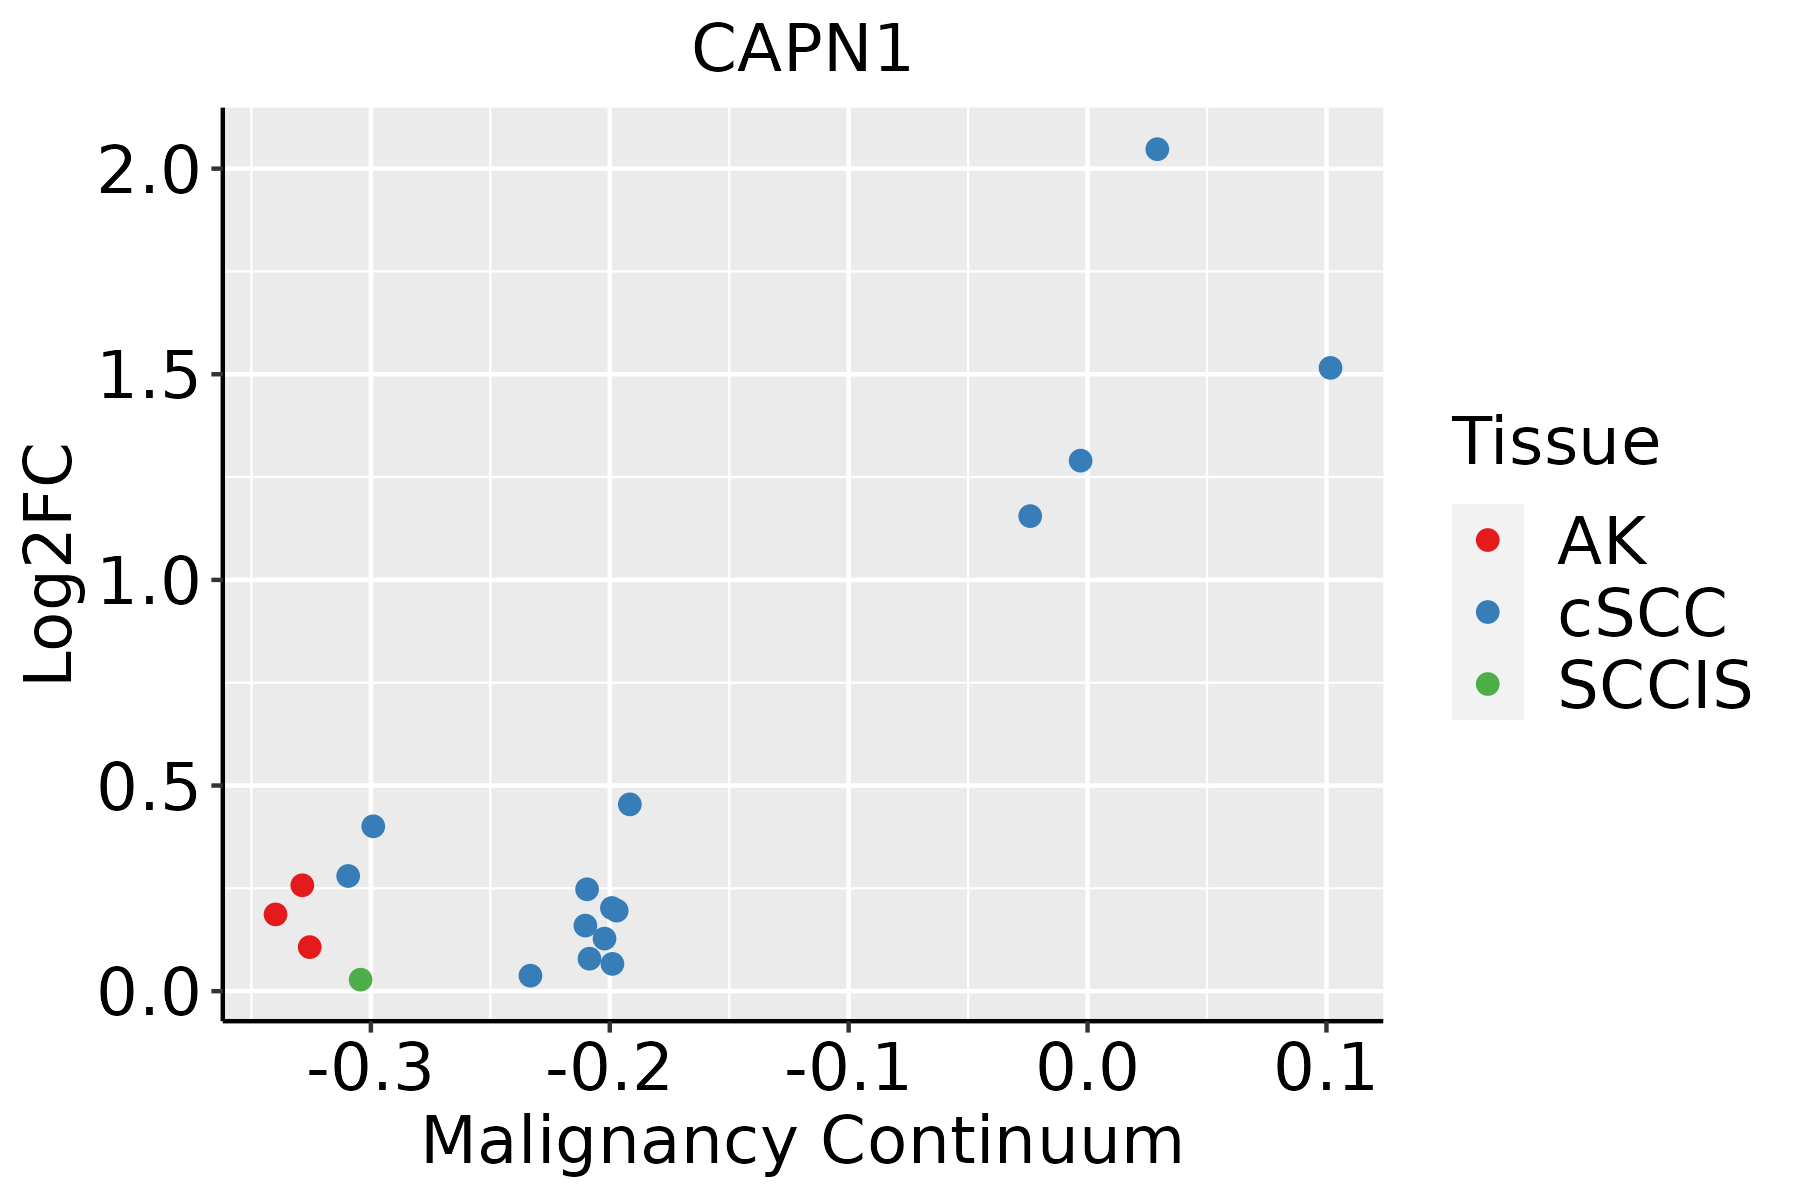 | AK: Actinic keratosis |
| cSCC: Cutaneous squamous cell carcinoma | ||
| SCCIS:squamous cell carcinoma in situ | ||
| Thyroid | 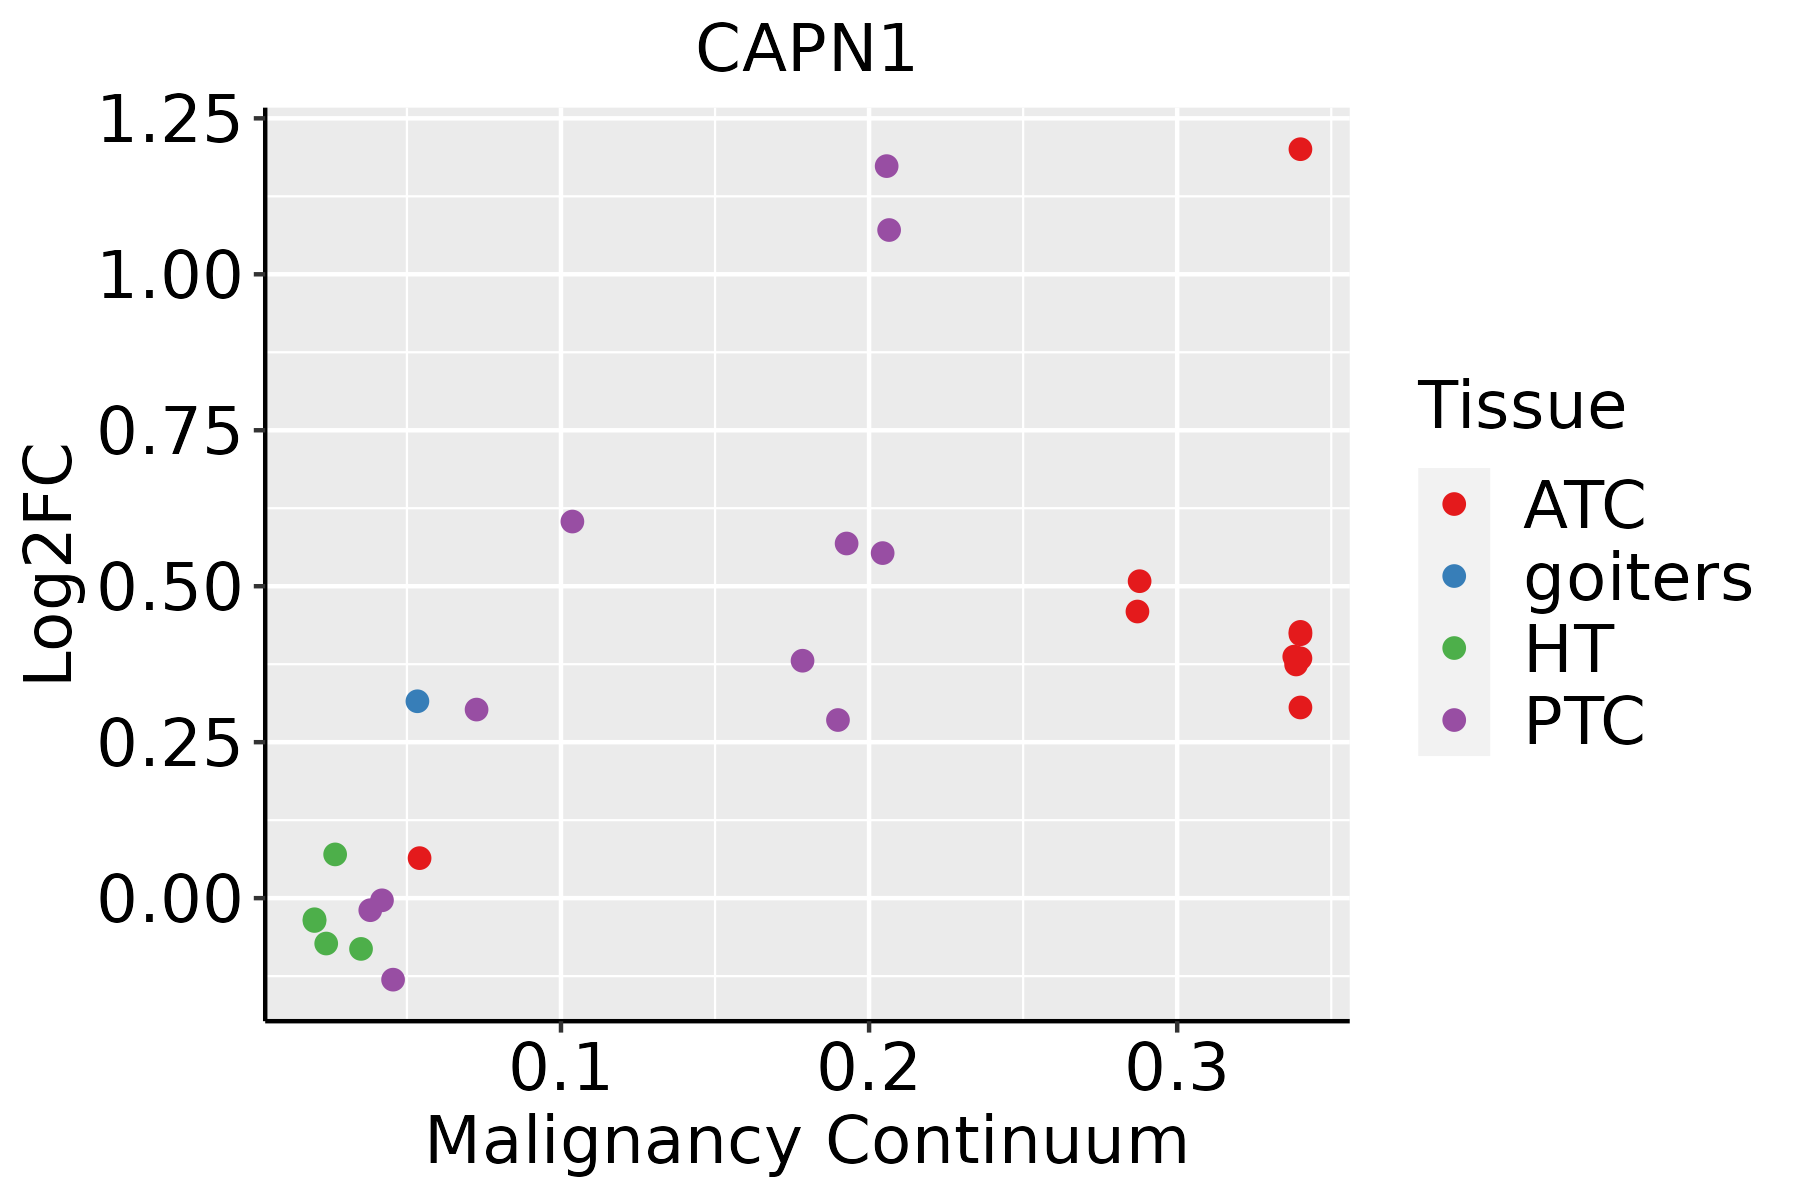 | ATC: Anaplastic thyroid cancer |
| HT: Hashimoto's thyroiditis | ||
| PTC: Papillary thyroid cancer |
| ∗log2FC in expression of this searched gene in stem-like cells from each diseased tissue sample relative to stem-like cells in normal samples in each tissue plotted against the malignancy continuum. Samples are colored based on if they are from different disease stage. |
Top |
Malignant transformation related pathway analysis |
| Find out the enriched GO biological processes and KEGG pathways involved in transition from healthy to precancer to cancer |
| Tissue | Disease Stage | Enriched GO biological Processes |
| Colorectum | AD |  |
| Colorectum | SER |  |
| Colorectum | MSS |  |
| Colorectum | MSI-H |  |
| Colorectum | FAP |  |
| ∗Top 15 enriched GO BP terms are showed in the bar plot of each disease state in each tissue. Each row represents a significant GO biological process which is colored according to the -log10(p.adjust). |
| Page: 1 2 3 4 5 6 7 8 9 |
| GO ID | Tissue | Disease Stage | Description | Gene Ratio | Bg Ratio | pvalue | p.adjust | Count |
| GO:0048732 | Colorectum | AD | gland development | 149/3918 | 436/18723 | 6.07e-11 | 6.33e-09 | 149 |
| GO:0010506 | Colorectum | AD | regulation of autophagy | 111/3918 | 317/18723 | 3.57e-09 | 2.35e-07 | 111 |
| GO:0016236 | Colorectum | AD | macroautophagy | 103/3918 | 291/18723 | 6.76e-09 | 4.15e-07 | 103 |
| GO:0043112 | Colorectum | AD | receptor metabolic process | 62/3918 | 166/18723 | 8.18e-07 | 2.85e-05 | 62 |
| GO:0030879 | Colorectum | AD | mammary gland development | 53/3918 | 137/18723 | 1.46e-06 | 4.58e-05 | 53 |
| GO:0016241 | Colorectum | AD | regulation of macroautophagy | 50/3918 | 141/18723 | 4.55e-05 | 7.92e-04 | 50 |
| GO:0022612 | Colorectum | AD | gland morphogenesis | 42/3918 | 118/18723 | 1.62e-04 | 2.23e-03 | 42 |
| GO:0060443 | Colorectum | AD | mammary gland morphogenesis | 18/3918 | 43/18723 | 1.51e-03 | 1.27e-02 | 18 |
| GO:0032801 | Colorectum | AD | receptor catabolic process | 12/3918 | 28/18723 | 7.21e-03 | 4.39e-02 | 12 |
| GO:00487321 | Colorectum | SER | gland development | 112/2897 | 436/18723 | 1.75e-08 | 1.28e-06 | 112 |
| GO:00162361 | Colorectum | SER | macroautophagy | 79/2897 | 291/18723 | 1.97e-07 | 1.10e-05 | 79 |
| GO:00105061 | Colorectum | SER | regulation of autophagy | 74/2897 | 317/18723 | 1.39e-04 | 2.77e-03 | 74 |
| GO:00308791 | Colorectum | SER | mammary gland development | 37/2897 | 137/18723 | 3.61e-04 | 5.61e-03 | 37 |
| GO:00162411 | Colorectum | SER | regulation of macroautophagy | 34/2897 | 141/18723 | 4.74e-03 | 3.72e-02 | 34 |
| GO:0032409 | Colorectum | SER | regulation of transporter activity | 65/2897 | 310/18723 | 5.71e-03 | 4.19e-02 | 65 |
| GO:00226121 | Colorectum | SER | gland morphogenesis | 29/2897 | 118/18723 | 6.54e-03 | 4.68e-02 | 29 |
| GO:00487322 | Colorectum | MSS | gland development | 143/3467 | 436/18723 | 3.85e-13 | 8.01e-11 | 143 |
| GO:00162362 | Colorectum | MSS | macroautophagy | 93/3467 | 291/18723 | 2.08e-08 | 1.17e-06 | 93 |
| GO:00308792 | Colorectum | MSS | mammary gland development | 51/3467 | 137/18723 | 1.88e-07 | 8.26e-06 | 51 |
| GO:00105062 | Colorectum | MSS | regulation of autophagy | 95/3467 | 317/18723 | 4.36e-07 | 1.71e-05 | 95 |
| Page: 1 2 3 4 5 6 |
| Pathway ID | Tissue | Disease Stage | Description | Gene Ratio | Bg Ratio | pvalue | p.adjust | qvalue | Count |
| hsa05010 | Colorectum | AD | Alzheimer disease | 174/2092 | 384/8465 | 1.82e-19 | 9.26e-18 | 5.91e-18 | 174 |
| hsa05022 | Colorectum | AD | Pathways of neurodegeneration - multiple diseases | 201/2092 | 476/8465 | 4.54e-18 | 1.27e-16 | 8.09e-17 | 201 |
| hsa05131 | Colorectum | AD | Shigellosis | 109/2092 | 247/8465 | 1.09e-11 | 2.44e-10 | 1.55e-10 | 109 |
| hsa04141 | Colorectum | AD | Protein processing in endoplasmic reticulum | 80/2092 | 174/8465 | 5.96e-10 | 1.25e-08 | 7.96e-09 | 80 |
| hsa04218 | Colorectum | AD | Cellular senescence | 53/2092 | 156/8465 | 5.55e-03 | 2.48e-02 | 1.58e-02 | 53 |
| hsa050101 | Colorectum | AD | Alzheimer disease | 174/2092 | 384/8465 | 1.82e-19 | 9.26e-18 | 5.91e-18 | 174 |
| hsa050221 | Colorectum | AD | Pathways of neurodegeneration - multiple diseases | 201/2092 | 476/8465 | 4.54e-18 | 1.27e-16 | 8.09e-17 | 201 |
| hsa051311 | Colorectum | AD | Shigellosis | 109/2092 | 247/8465 | 1.09e-11 | 2.44e-10 | 1.55e-10 | 109 |
| hsa041411 | Colorectum | AD | Protein processing in endoplasmic reticulum | 80/2092 | 174/8465 | 5.96e-10 | 1.25e-08 | 7.96e-09 | 80 |
| hsa042181 | Colorectum | AD | Cellular senescence | 53/2092 | 156/8465 | 5.55e-03 | 2.48e-02 | 1.58e-02 | 53 |
| hsa050102 | Colorectum | SER | Alzheimer disease | 146/1580 | 384/8465 | 6.52e-20 | 2.40e-18 | 1.75e-18 | 146 |
| hsa050222 | Colorectum | SER | Pathways of neurodegeneration - multiple diseases | 168/1580 | 476/8465 | 6.23e-19 | 2.07e-17 | 1.50e-17 | 168 |
| hsa051312 | Colorectum | SER | Shigellosis | 87/1580 | 247/8465 | 3.07e-10 | 7.27e-09 | 5.28e-09 | 87 |
| hsa041412 | Colorectum | SER | Protein processing in endoplasmic reticulum | 60/1580 | 174/8465 | 4.20e-07 | 7.33e-06 | 5.32e-06 | 60 |
| hsa04217 | Colorectum | SER | Necroptosis | 47/1580 | 159/8465 | 5.21e-04 | 4.44e-03 | 3.22e-03 | 47 |
| hsa050103 | Colorectum | SER | Alzheimer disease | 146/1580 | 384/8465 | 6.52e-20 | 2.40e-18 | 1.75e-18 | 146 |
| hsa050223 | Colorectum | SER | Pathways of neurodegeneration - multiple diseases | 168/1580 | 476/8465 | 6.23e-19 | 2.07e-17 | 1.50e-17 | 168 |
| hsa051313 | Colorectum | SER | Shigellosis | 87/1580 | 247/8465 | 3.07e-10 | 7.27e-09 | 5.28e-09 | 87 |
| hsa041413 | Colorectum | SER | Protein processing in endoplasmic reticulum | 60/1580 | 174/8465 | 4.20e-07 | 7.33e-06 | 5.32e-06 | 60 |
| hsa042171 | Colorectum | SER | Necroptosis | 47/1580 | 159/8465 | 5.21e-04 | 4.44e-03 | 3.22e-03 | 47 |
| Page: 1 2 3 4 5 6 |
Top |
Cell-cell communication analysis |
| Identification of potential cell-cell interactions between two cell types and their ligand-receptor pairs for different disease states |
| Ligand | Receptor | LRpair | Pathway | Tissue | Disease Stage |
| Page: 1 |
Top |
Single-cell gene regulatory network inference analysis |
| Find out the significant the regulons (TFs) and the target genes of each regulon across cell types for different disease states |
| TF | Cell Type | Tissue | Disease Stage | Target Gene | RSS | Regulon Activity |
| ∗The dot plots of a searched regulon are shown for all cell subpopulations in each disease state of each tissue based on the regulon specific score inferred using pySCENIC and by calculating the average expression. |
| Page: 1 |
Top |
Somatic mutation of malignant transformation related genes |
| Annotation of somatic variants for genes involved in malignant transformation |
| Hugo Symbol | Variant Class | Variant Classification | dbSNP RS | HGVSc | HGVSp | HGVSp Short | SWISSPROT | BIOTYPE | SIFT | PolyPhen | Tumor Sample Barcode | Tissue | Histology | Sex | Age | Stage | Therapy Types | Drugs | Outcome |
| CAPN1 | SNV | Missense_Mutation | c.491N>C | p.Val164Ala | p.V164A | P07384 | protein_coding | deleterious(0) | benign(0.435) | TCGA-AN-A0XP-01 | Breast | breast invasive carcinoma | Female | >=65 | III/IV | Unknown | Unknown | SD | |
| CAPN1 | SNV | Missense_Mutation | novel | c.1444G>A | p.Glu482Lys | p.E482K | P07384 | protein_coding | deleterious(0) | possibly_damaging(0.901) | TCGA-BH-A5J0-01 | Breast | breast invasive carcinoma | Female | <65 | I/II | Unknown | Unknown | SD |
| CAPN1 | SNV | Missense_Mutation | rs762252249 | c.1417N>T | p.Arg473Cys | p.R473C | P07384 | protein_coding | deleterious(0.05) | probably_damaging(0.985) | TCGA-C8-A135-01 | Breast | breast invasive carcinoma | Female | <65 | I/II | Chemotherapy | 5-fluorouracil | CR |
| CAPN1 | SNV | Missense_Mutation | c.2079N>A | p.Asp693Glu | p.D693E | P07384 | protein_coding | deleterious(0.03) | benign(0.062) | TCGA-D8-A1XK-01 | Breast | breast invasive carcinoma | Female | <65 | I/II | Chemotherapy | doxorubicine+cyclophosphamide | SD | |
| CAPN1 | SNV | Missense_Mutation | c.1304N>A | p.Gly435Asp | p.G435D | P07384 | protein_coding | deleterious(0.01) | probably_damaging(0.971) | TCGA-E2-A14W-01 | Breast | breast invasive carcinoma | Male | >=65 | I/II | Chemotherapy | cytoxan | SD | |
| CAPN1 | SNV | Missense_Mutation | c.595N>C | p.Asn199His | p.N199H | P07384 | protein_coding | tolerated(0.17) | possibly_damaging(0.522) | TCGA-E2-A1LS-01 | Breast | breast invasive carcinoma | Female | <65 | I/II | Unspecific | Cyclophosphamide | SD | |
| CAPN1 | SNV | Missense_Mutation | c.824N>G | p.Ser275Cys | p.S275C | P07384 | protein_coding | deleterious(0) | probably_damaging(0.987) | TCGA-EK-A3GK-01 | Cervix | cervical & endocervical cancer | Female | <65 | I/II | Unknown | Unknown | SD | |
| CAPN1 | SNV | Missense_Mutation | c.1461N>A | p.Phe487Leu | p.F487L | P07384 | protein_coding | tolerated(0.32) | benign(0.003) | TCGA-EK-A3GK-01 | Cervix | cervical & endocervical cancer | Female | <65 | I/II | Unknown | Unknown | SD | |
| CAPN1 | SNV | Missense_Mutation | novel | c.1576N>A | p.Asp526Asn | p.D526N | P07384 | protein_coding | tolerated(0.23) | benign(0.219) | TCGA-JW-A5VL-01 | Cervix | cervical & endocervical cancer | Female | <65 | I/II | Unknown | Unknown | SD |
| CAPN1 | SNV | Missense_Mutation | c.127N>C | p.Glu43Gln | p.E43Q | P07384 | protein_coding | tolerated(0.06) | benign(0.013) | TCGA-Q1-A73O-01 | Cervix | cervical & endocervical cancer | Female | <65 | I/II | Chemotherapy | cisplatin | CR |
| Page: 1 2 3 4 5 6 |
Top |
Related drugs of malignant transformation related genes |
| Identification of chemicals and drugs interact with genes involved in malignant transfromation |
| (DGIdb 4.0) |
| Entrez ID | Symbol | Category | Interaction Types | Drug Claim Name | Drug Name | PMIDs |
| 823 | CAPN1 | PROTEASE, DRUGGABLE GENOME, ENZYME | Undecylenic acid derivative 1 | |||
| 823 | CAPN1 | PROTEASE, DRUGGABLE GENOME, ENZYME | BORTEZOMIB | BORTEZOMIB | 20875739 |
| Page: 1 |

Copyright 2023-Present -The University of Texas Health Science Center at Houston |