Schematic overview of the cellular and molecular mechanisms involved in the cancer progression, including the proposed cellular and molecular mechanisms in cancer cells trajectory. AT1: alveolar type 1 cells; AT2: alveolar type 2 cells; AAH: atypical adenomatous hyperplasia; AIS: adenocarcinoma in situ; MIA: minimally invasive adenocarcinoma; IA: invasive adenocarcinoma; EMT: epithelial-mesenchymal transition

Home

Download

Statistics

Help

Contact

Center for Computational Systems Medicine
leaf

Gene summary

leaf

Malignant transformation analysis

leaf

Malignant transformation related pathway analysis

leaf

Cell-cell communication analysis

leaf

Single-cell gene regulatory network inference analysis

leaf

Somatic mutation of malignant transformation related genes

leaf

Related drugs of malignant transformation related genes

Gene: CAND1

Gene summary for CAND1

check button Gene summary.

Gene informationSpeciesHuman
Gene symbol

CAND1

Gene ID

55832

Gene namecullin associated and neddylation dissociated 1
Gene AliasTIP120
Cytomap12q14.3-q15
Gene Typeprotein-coding
GO ID

GO:0006139

UniProtAcc

Q86VP6


Top

Malignant transformation analysis

check button Identification of the aberrant gene expression in precancerous and cancerous lesions by comparing the gene expression of stem-like cells in diseased tissues with normal stem cells
check button Malignant transformation involving gene list.
Entrez IDSymbolReplicatesSpeciesOrganTissueAdj P-valueLog2FCMalignancy
55832CAND1GSM5353223_PA_PB2B_Pool_2_S26_L001HumanProstateTumor3.97e-076.49e-010.1604
55832CAND1GSM5353227_PA_PR5199-193K_Pool_1_2_3_S55_L002HumanProstateTumor2.19e-033.69e-010.1602
55832CAND1GSM5353232_PA_PR5249_T1_S3_L001HumanProstateTumor8.17e-053.07e-010.1439
55832CAND1GSM5353240_PA_PR5254_T1_S15_L001HumanProstateTumor1.00e-023.00e-010.1575
55832CAND1GSM5353243_PA_PR5261_T1_S23_L002HumanProstateTumor8.56e-051.67e-010.1545
55832CAND1GSM5353244_PA_PR5261_T2_S24_L002HumanProstateTumor1.71e-042.40e-010.1569
55832CAND1P4_S8_cSCCHumanSkincSCC7.79e-061.18e-01-0.3095
55832CAND1P5_S10_cSCCHumanSkincSCC1.63e-081.22e-01-0.299
55832CAND1P1_cSCCHumanSkincSCC6.50e-217.51e-010.0292
55832CAND1P2_cSCCHumanSkincSCC9.54e-134.72e-01-0.024
55832CAND1P4_cSCCHumanSkincSCC4.46e-288.39e-01-0.00290000000000005
55832CAND1P10_cSCCHumanSkincSCC1.46e-411.10e+000.1017
55832CAND1cSCC_p8HumanSkincSCC6.47e-055.06e-02-0.1971
55832CAND1male-WTAHumanThyroidPTC3.75e-564.10e-010.1037
55832CAND1PTC01HumanThyroidPTC1.67e-072.97e-010.1899
55832CAND1PTC03HumanThyroidPTC9.03e-093.76e-010.1784
55832CAND1PTC04HumanThyroidPTC1.68e-295.61e-010.1927
55832CAND1PTC05HumanThyroidPTC6.77e-231.05e+000.2065
55832CAND1PTC06HumanThyroidPTC3.42e-461.28e+000.2057
55832CAND1PTC07HumanThyroidPTC3.21e-387.39e-010.2044
Page: 1 2 3 4 5 6 7 

check button Transcriptomic changes along malignancy continuum.
TissueExpression DynamicsAbbreviation
EsophagusThe image shows the transcriptomic changes along malignancy continuum.log2FC in expression of this searched gene in stem-like cells from each diseased tissue sample relative to stem-like cells in normal samples in each tissue plotted against the malignancy continuum. Samples are colored based on if they are from different disease stage.
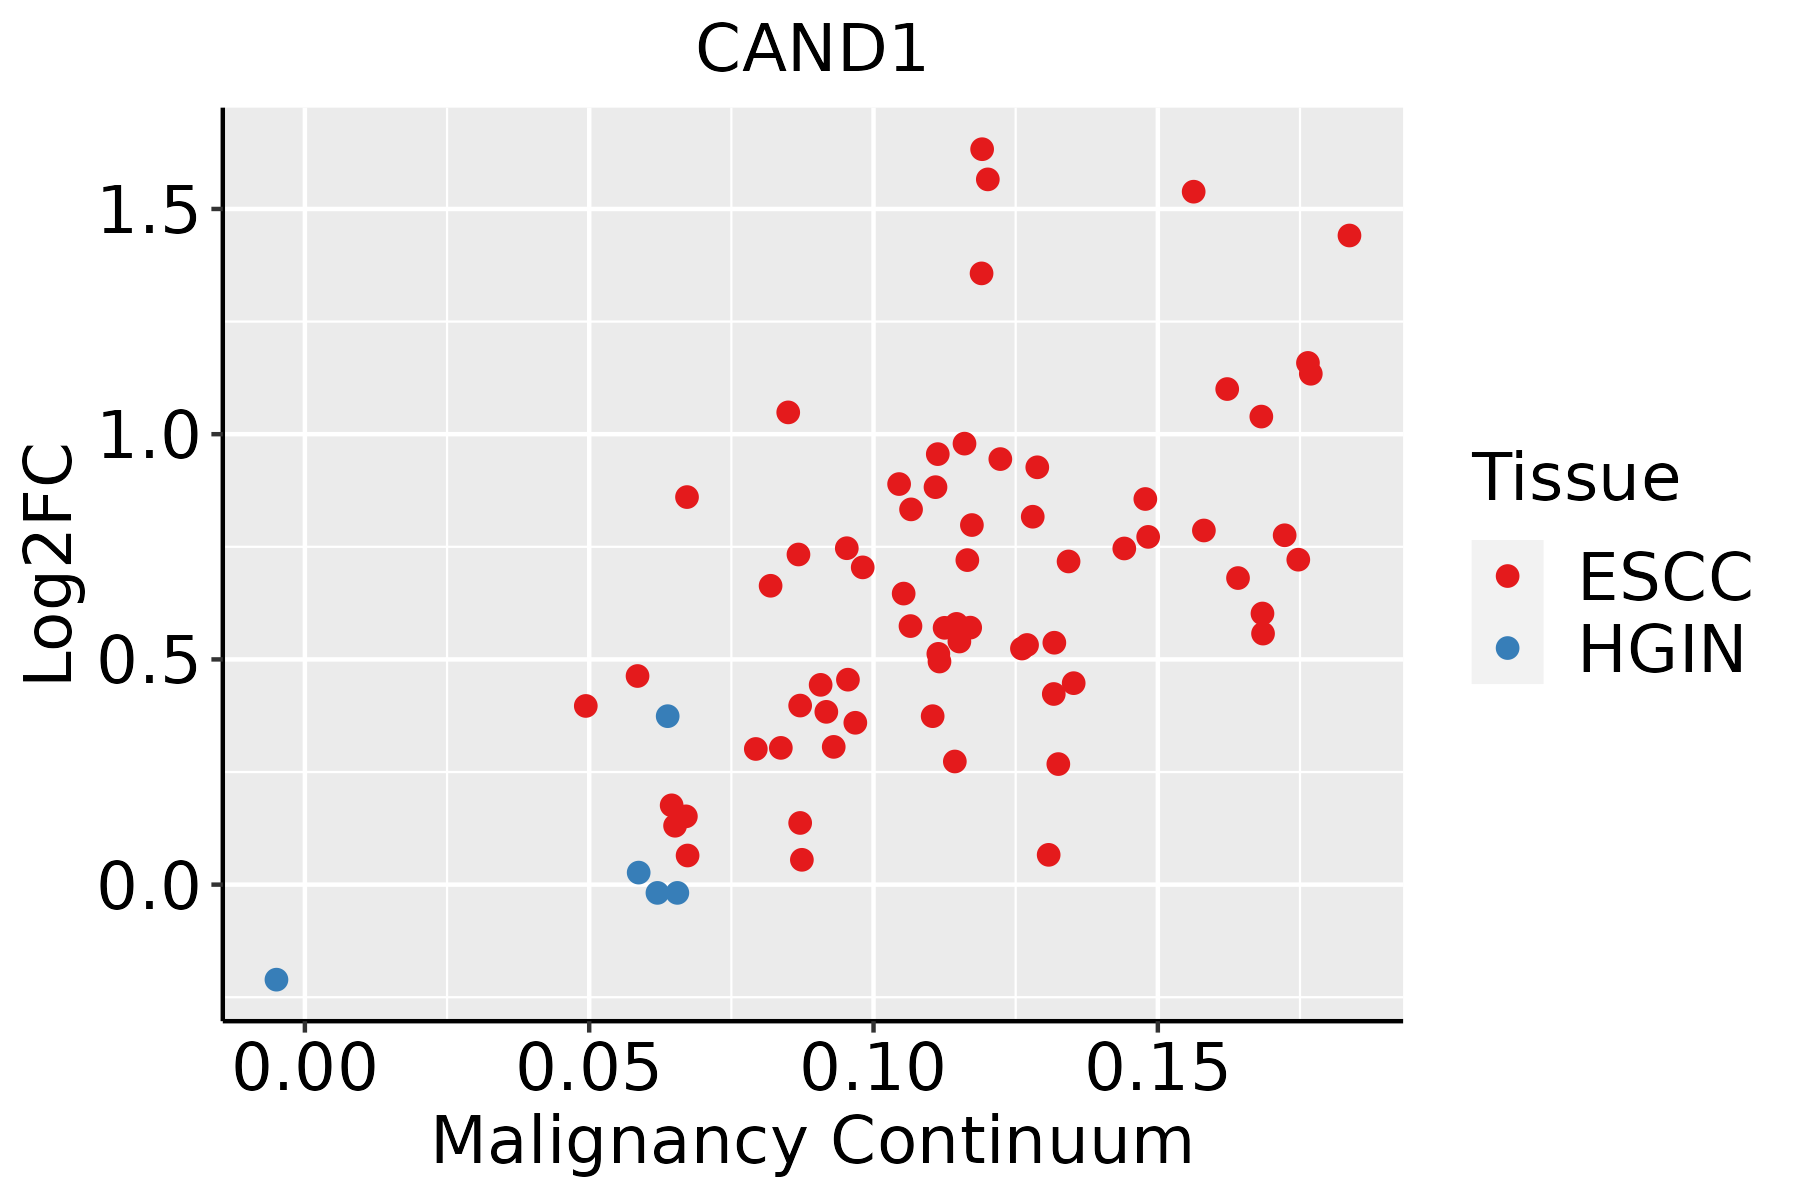
ESCC: Esophageal squamous cell carcinoma
HGIN: High-grade intraepithelial neoplasias
LGIN: Low-grade intraepithelial neoplasias
LiverThe image shows the transcriptomic changes along malignancy continuum.log2FC in expression of this searched gene in stem-like cells from each diseased tissue sample relative to stem-like cells in normal samples in each tissue plotted against the malignancy continuum. Samples are colored based on if they are from different disease stage.
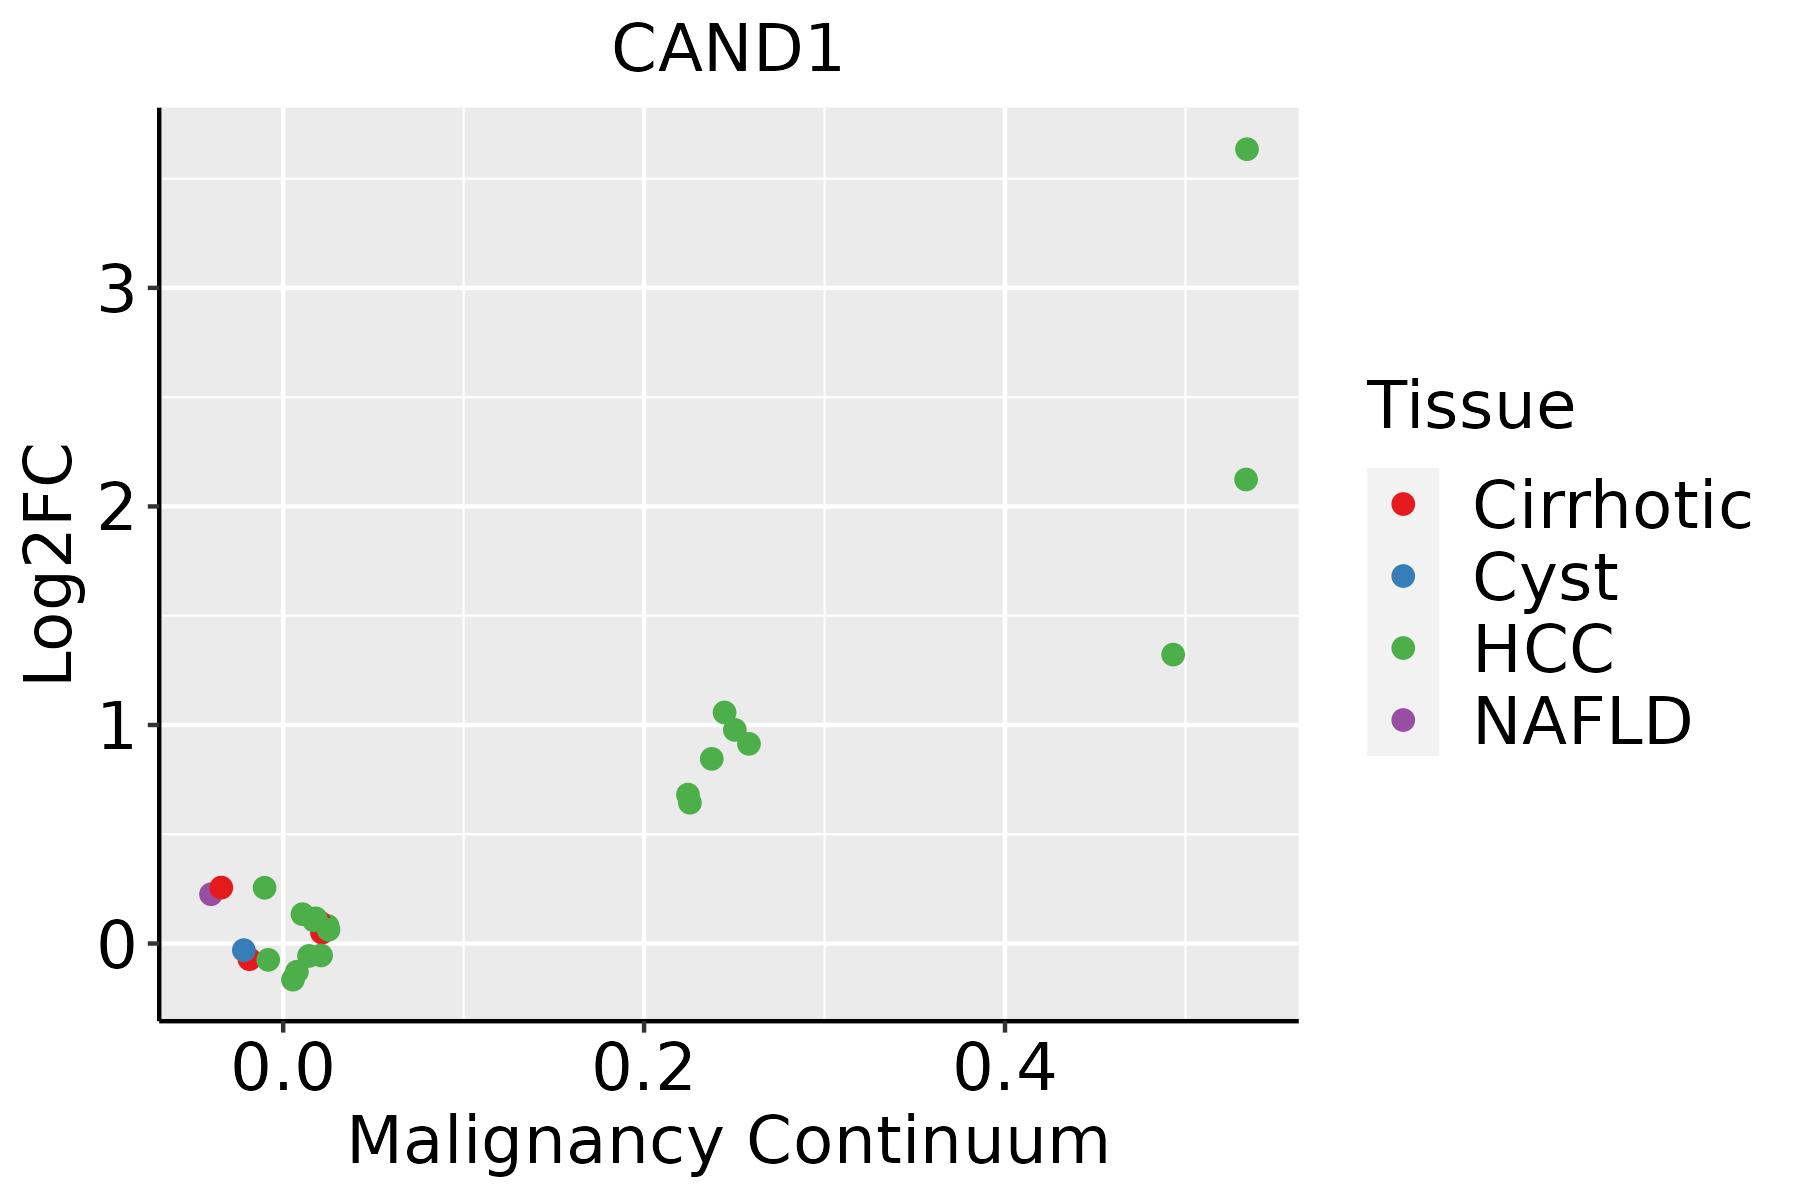
HCC: Hepatocellular carcinoma
NAFLD: Non-alcoholic fatty liver disease
Oral CavityThe image shows the transcriptomic changes along malignancy continuum.log2FC in expression of this searched gene in stem-like cells from each diseased tissue sample relative to stem-like cells in normal samples in each tissue plotted against the malignancy continuum. Samples are colored based on if they are from different disease stage.
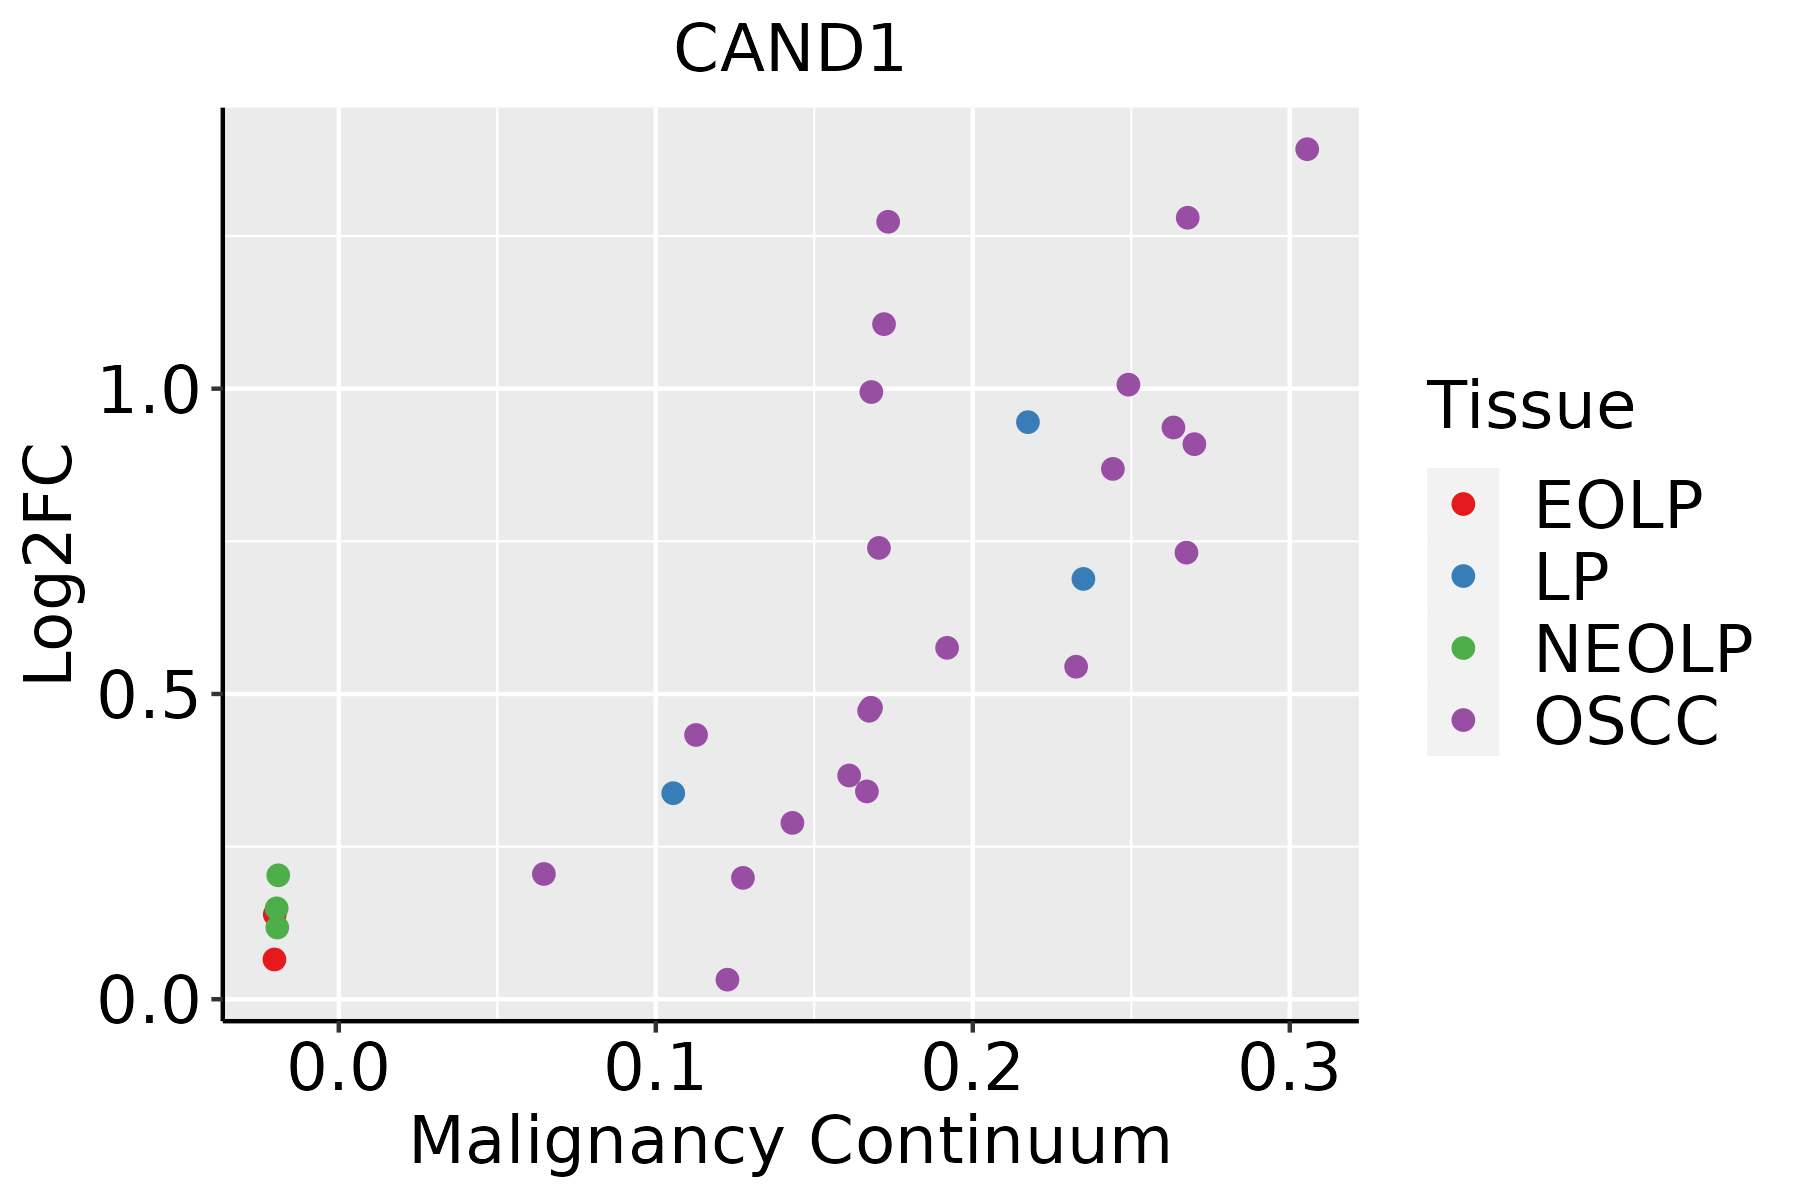
EOLP: Erosive Oral lichen planus
LP: leukoplakia
NEOLP: Non-erosive oral lichen planus
OSCC: Oral squamous cell carcinoma
ProstateThe image shows the transcriptomic changes along malignancy continuum.log2FC in expression of this searched gene in stem-like cells from each diseased tissue sample relative to stem-like cells in normal samples in each tissue plotted against the malignancy continuum. Samples are colored based on if they are from different disease stage.BPH: Benign Prostatic Hyperplasia
SkinThe image shows the transcriptomic changes along malignancy continuum.log2FC in expression of this searched gene in stem-like cells from each diseased tissue sample relative to stem-like cells in normal samples in each tissue plotted against the malignancy continuum. Samples are colored based on if they are from different disease stage.AK: Actinic keratosis
cSCC: Cutaneous squamous cell carcinoma
SCCIS:squamous cell carcinoma in situ
ThyroidThe image shows the transcriptomic changes along malignancy continuum.log2FC in expression of this searched gene in stem-like cells from each diseased tissue sample relative to stem-like cells in normal samples in each tissue plotted against the malignancy continuum. Samples are colored based on if they are from different disease stage.
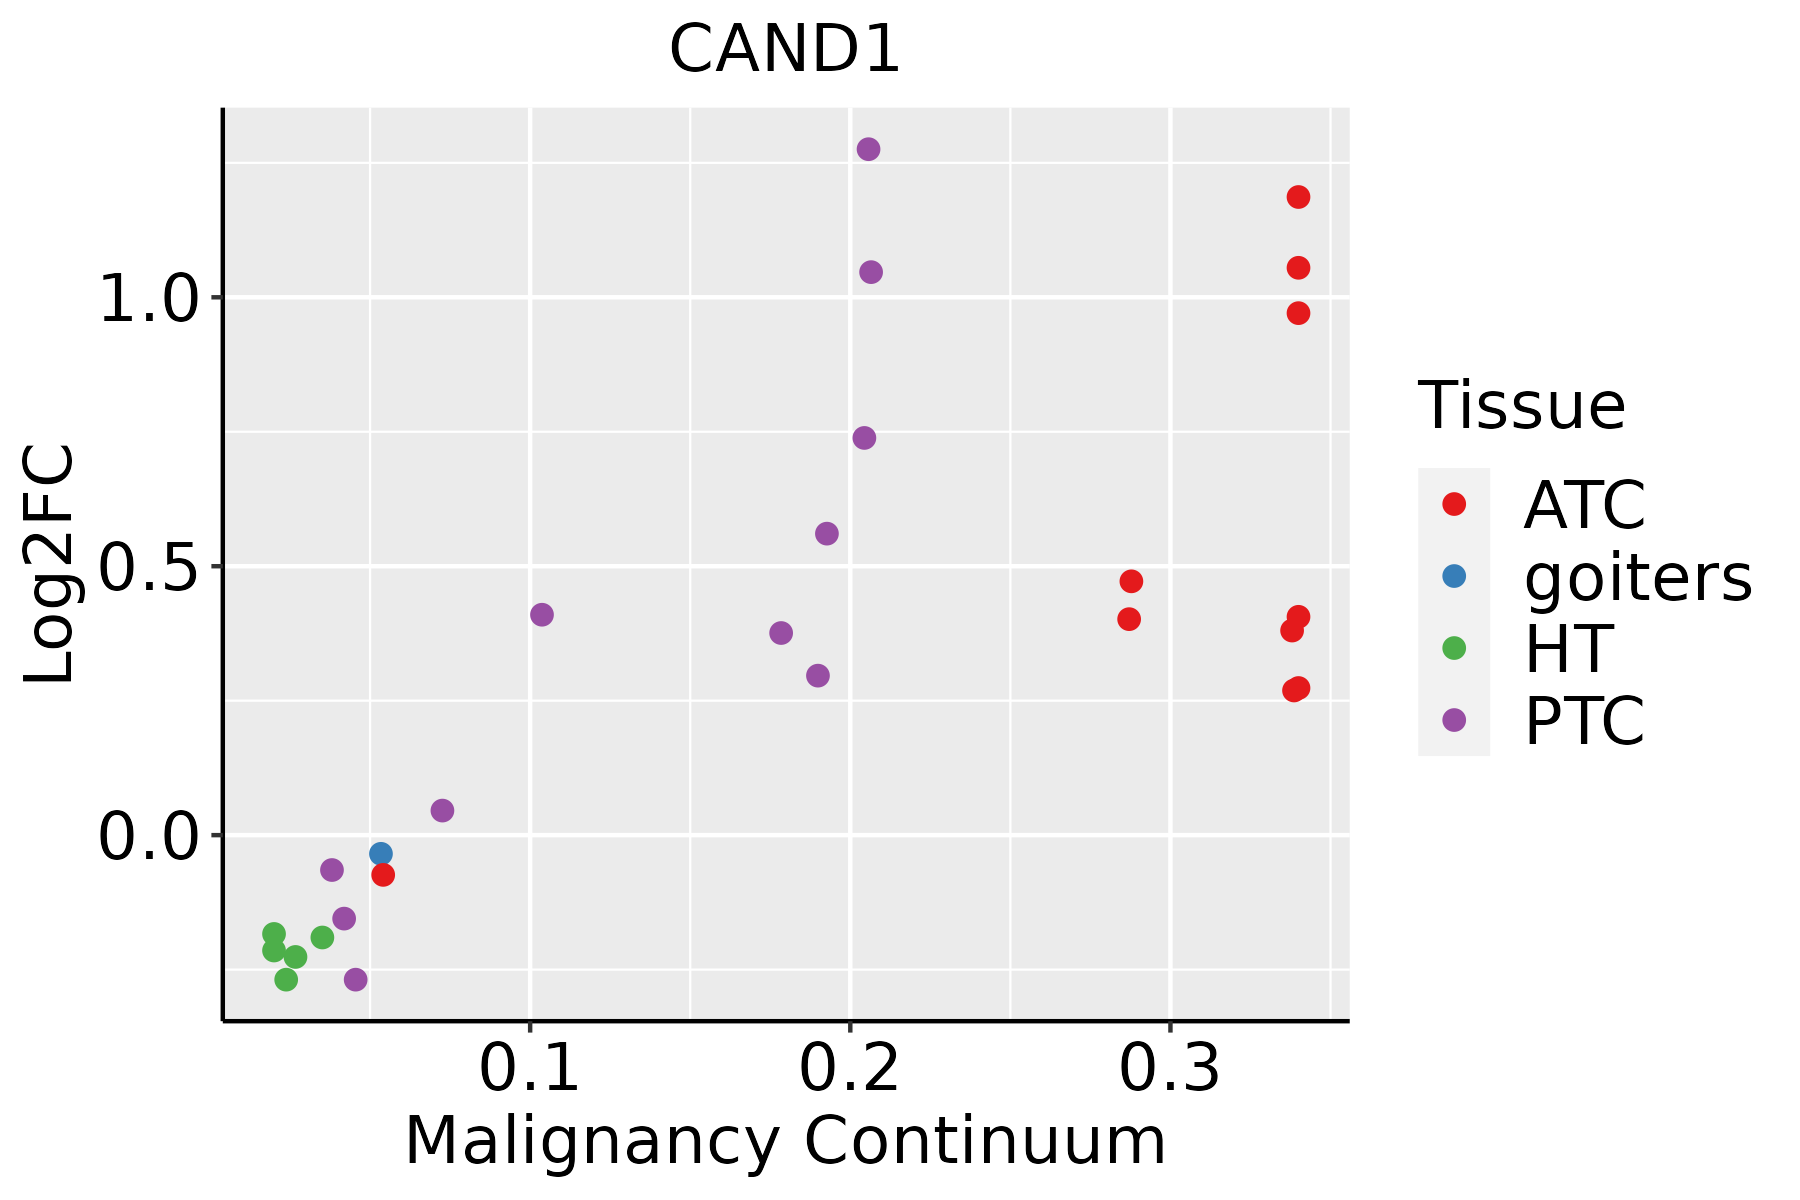
ATC: Anaplastic thyroid cancer
HT: Hashimoto's thyroiditis
PTC: Papillary thyroid cancer
∗log2FC in expression of this searched gene in stem-like cells from each diseased tissue sample relative to stem-like cells in normal samples in each tissue plotted against the malignancy continuum. Samples are colored based on if they are from different disease stage.

Top

Malignant transformation related pathway analysis

check buttonFind out the enriched GO biological processes and KEGG pathways involved in transition from healthy to precancer to cancer
check button Figure of enriched GO biological processes.
TissueDisease StageEnriched GO biological Processes
ColorectumADGO analysis - Figure of enriched GO biological processes: Top 15 enriched GO BP terms are showed in the bar plot of each disease state in each tissue. Each row represents a significant GO biological process which is colored according to the -log10(p.adjust).
ColorectumSERGO analysis - Figure of enriched GO biological processes: Top 15 enriched GO BP terms are showed in the bar plot of each disease state in each tissue. Each row represents a significant GO biological process which is colored according to the -log10(p.adjust).
ColorectumMSSGO analysis - Figure of enriched GO biological processes: Top 15 enriched GO BP terms are showed in the bar plot of each disease state in each tissue. Each row represents a significant GO biological process which is colored according to the -log10(p.adjust).
ColorectumMSI-HGO analysis - Figure of enriched GO biological processes: Top 15 enriched GO BP terms are showed in the bar plot of each disease state in each tissue. Each row represents a significant GO biological process which is colored according to the -log10(p.adjust).
ColorectumFAPGO analysis - Figure of enriched GO biological processes: Top 15 enriched GO BP terms are showed in the bar plot of each disease state in each tissue. Each row represents a significant GO biological process which is colored according to the -log10(p.adjust).
∗Top 15 enriched GO BP terms are showed in the bar plot of each disease state in each tissue. Each row represents a significant GO biological process which is colored according to the -log10(p.adjust).
Page: 1 2 3 4 5 6 7 8 9 

check button Enriched GO biological processes.
GO IDTissueDisease StageDescriptionGene RatioBg Ratiopvaluep.adjustCount
GO:0043254111EsophagusESCCregulation of protein-containing complex assembly278/8552428/187233.81e-162.77e-14278
GO:0031334111EsophagusESCCpositive regulation of protein-containing complex assembly166/8552237/187232.06e-141.07e-12166
GO:00063673EsophagusESCCtranscription initiation from RNA polymerase II promoter56/855277/187231.30e-061.59e-0556
GO:000635211EsophagusESCCDNA-templated transcription, initiation86/8552130/187231.88e-062.19e-0586
GO:00708973EsophagusESCCtranscription preinitiation complex assembly30/855236/187233.60e-063.95e-0530
GO:00602603EsophagusESCCregulation of transcription initiation from RNA polymerase II promoter25/855233/187234.30e-042.43e-0325
GO:200014212EsophagusESCCregulation of DNA-templated transcription, initiation29/855240/187235.32e-042.93e-0329
GO:00511232EsophagusESCCRNA polymerase II preinitiation complex assembly18/855224/187233.43e-031.41e-0218
GO:20001443EsophagusESCCpositive regulation of DNA-templated transcription, initiation21/855231/187231.10e-023.70e-0221
GO:004325412LiverCirrhoticregulation of protein-containing complex assembly169/4634428/187237.40e-124.99e-10169
GO:00313347LiverCirrhoticpositive regulation of protein-containing complex assembly95/4634237/187231.21e-073.39e-0695
GO:0006367LiverCirrhotictranscription initiation from RNA polymerase II promoter31/463477/187231.91e-031.20e-0231
GO:0070897LiverCirrhotictranscription preinitiation complex assembly17/463436/187232.82e-031.63e-0217
GO:0051123LiverCirrhoticRNA polymerase II preinitiation complex assembly12/463424/187236.58e-033.25e-0212
GO:0060260LiverCirrhoticregulation of transcription initiation from RNA polymerase II promoter15/463433/187237.61e-033.60e-0215
GO:2000142LiverCirrhoticregulation of DNA-templated transcription, initiation17/463440/187231.04e-024.61e-0217
GO:004325422LiverHCCregulation of protein-containing complex assembly264/7958428/187235.47e-164.39e-14264
GO:003133412LiverHCCpositive regulation of protein-containing complex assembly150/7958237/187237.35e-112.63e-09150
GO:00063671LiverHCCtranscription initiation from RNA polymerase II promoter52/795877/187237.87e-069.27e-0552
GO:0006352LiverHCCDNA-templated transcription, initiation78/7958130/187234.19e-054.11e-0478
Page: 1 2 3 4 

check button Enriched KEGG pathways.
Pathway IDTissueDisease StageDescriptionGene RatioBg Ratiopvaluep.adjustqvalueCount
Page: 1 

Top

Cell-cell communication analysis

check buttonIdentification of potential cell-cell interactions between two cell types and their ligand-receptor pairs for different disease states
LigandReceptorLRpairPathwayTissueDisease Stage
Page: 1 

Top

Single-cell gene regulatory network inference analysis

check buttonFind out the significant the regulons (TFs) and the target genes of each regulon across cell types for different disease states
TFCell TypeTissueDisease StageTarget GeneRSSRegulon Activity
∗The dot plots of a searched regulon are shown for all cell subpopulations in each disease state of each tissue based on the regulon specific score inferred using pySCENIC and by calculating the average expression.
Page: 1 

Top

Somatic mutation of malignant transformation related genes

check buttonAnnotation of somatic variants for genes involved in malignant transformation
Hugo SymbolVariant ClassVariant ClassificationdbSNP RSHGVScHGVSpHGVSp ShortSWISSPROTBIOTYPESIFTPolyPhenTumor Sample BarcodeTissueHistologySexAgeStageTherapy TypesDrugsOutcome
CAND1SNVMissense_Mutationc.486N>Cp.Leu162Phep.L162FQ86VP6protein_codingdeleterious(0.01)benign(0.384)TCGA-AC-A23H-01Breastbreast invasive carcinomaFemale>=65I/IIUnknownUnknownPD
CAND1SNVMissense_Mutationnovelc.3425N>Cp.Leu1142Serp.L1142SQ86VP6protein_codingdeleterious(0)probably_damaging(0.971)TCGA-AN-A046-01Breastbreast invasive carcinomaFemale>=65I/IIUnknownUnknownSD
CAND1SNVMissense_Mutationrs199801743c.3152A>Gp.His1051Argp.H1051RQ86VP6protein_codingtolerated(0.42)benign(0.007)TCGA-AO-A128-01Breastbreast invasive carcinomaFemale<65I/IIChemotherapydoxorubicinSD
CAND1SNVMissense_Mutationc.520N>Tp.Pro174Serp.P174SQ86VP6protein_codingtolerated(1)benign(0.003)TCGA-BH-A0B6-01Breastbreast invasive carcinomaFemale<65I/IIUnknownUnknownSD
CAND1SNVMissense_Mutationrs773906312c.1673C>Tp.Ser558Leup.S558LQ86VP6protein_codingtolerated(0.31)benign(0)TCGA-BH-A0DK-01Breastbreast invasive carcinomaFemale<65I/IIHormone TherapytamoxiphenSD
CAND1SNVMissense_Mutationc.292N>Ap.Asp98Asnp.D98NQ86VP6protein_codingtolerated(0.2)benign(0.055)TCGA-BH-A18U-01Breastbreast invasive carcinomaFemale>=65III/IVUnknownUnknownSD
CAND1SNVMissense_Mutationc.541N>Tp.Leu181Phep.L181FQ86VP6protein_codingdeleterious(0.03)possibly_damaging(0.839)TCGA-D8-A27G-01Breastbreast invasive carcinomaFemale>=65I/IIUnknownUnknownSD
CAND1insertionFrame_Shift_Insnovelc.2485_2486insACCAGAGAGCTTTGAAACTGGGTACTCTTTCTGCCCTTp.Arg829AsnfsTer22p.R829Nfs*22Q86VP6protein_codingTCGA-A8-A09E-01Breastbreast invasive carcinomaFemale>=65III/IVHormone TherapyanastrozoleSD
CAND1insertionNonsense_Mutationnovelc.3349_3350insAp.Tyr1117Terp.Y1117*Q86VP6protein_codingTCGA-AO-A0JE-01Breastbreast invasive carcinomaFemale<65III/IVChemotherapydoxorubicinSD
CAND1insertionFrame_Shift_Insnovelc.3154_3155insAACTGGTGp.Leu1052GlnfsTer15p.L1052Qfs*15Q86VP6protein_codingTCGA-AO-A128-01Breastbreast invasive carcinomaFemale<65I/IIChemotherapydoxorubicinSD
Page: 1 2 3 4 5 6 7 8 9 10 11 12 13 14 15 

Top

Related drugs of malignant transformation related genes

check buttonIdentification of chemicals and drugs interact with genes involved in malignant transfromation
(DGIdb 4.0)
Entrez IDSymbolCategoryInteraction TypesDrug Claim NameDrug NamePMIDs
Page: 1