| Tissue | Expression Dynamics | Abbreviation |
| Cervix | 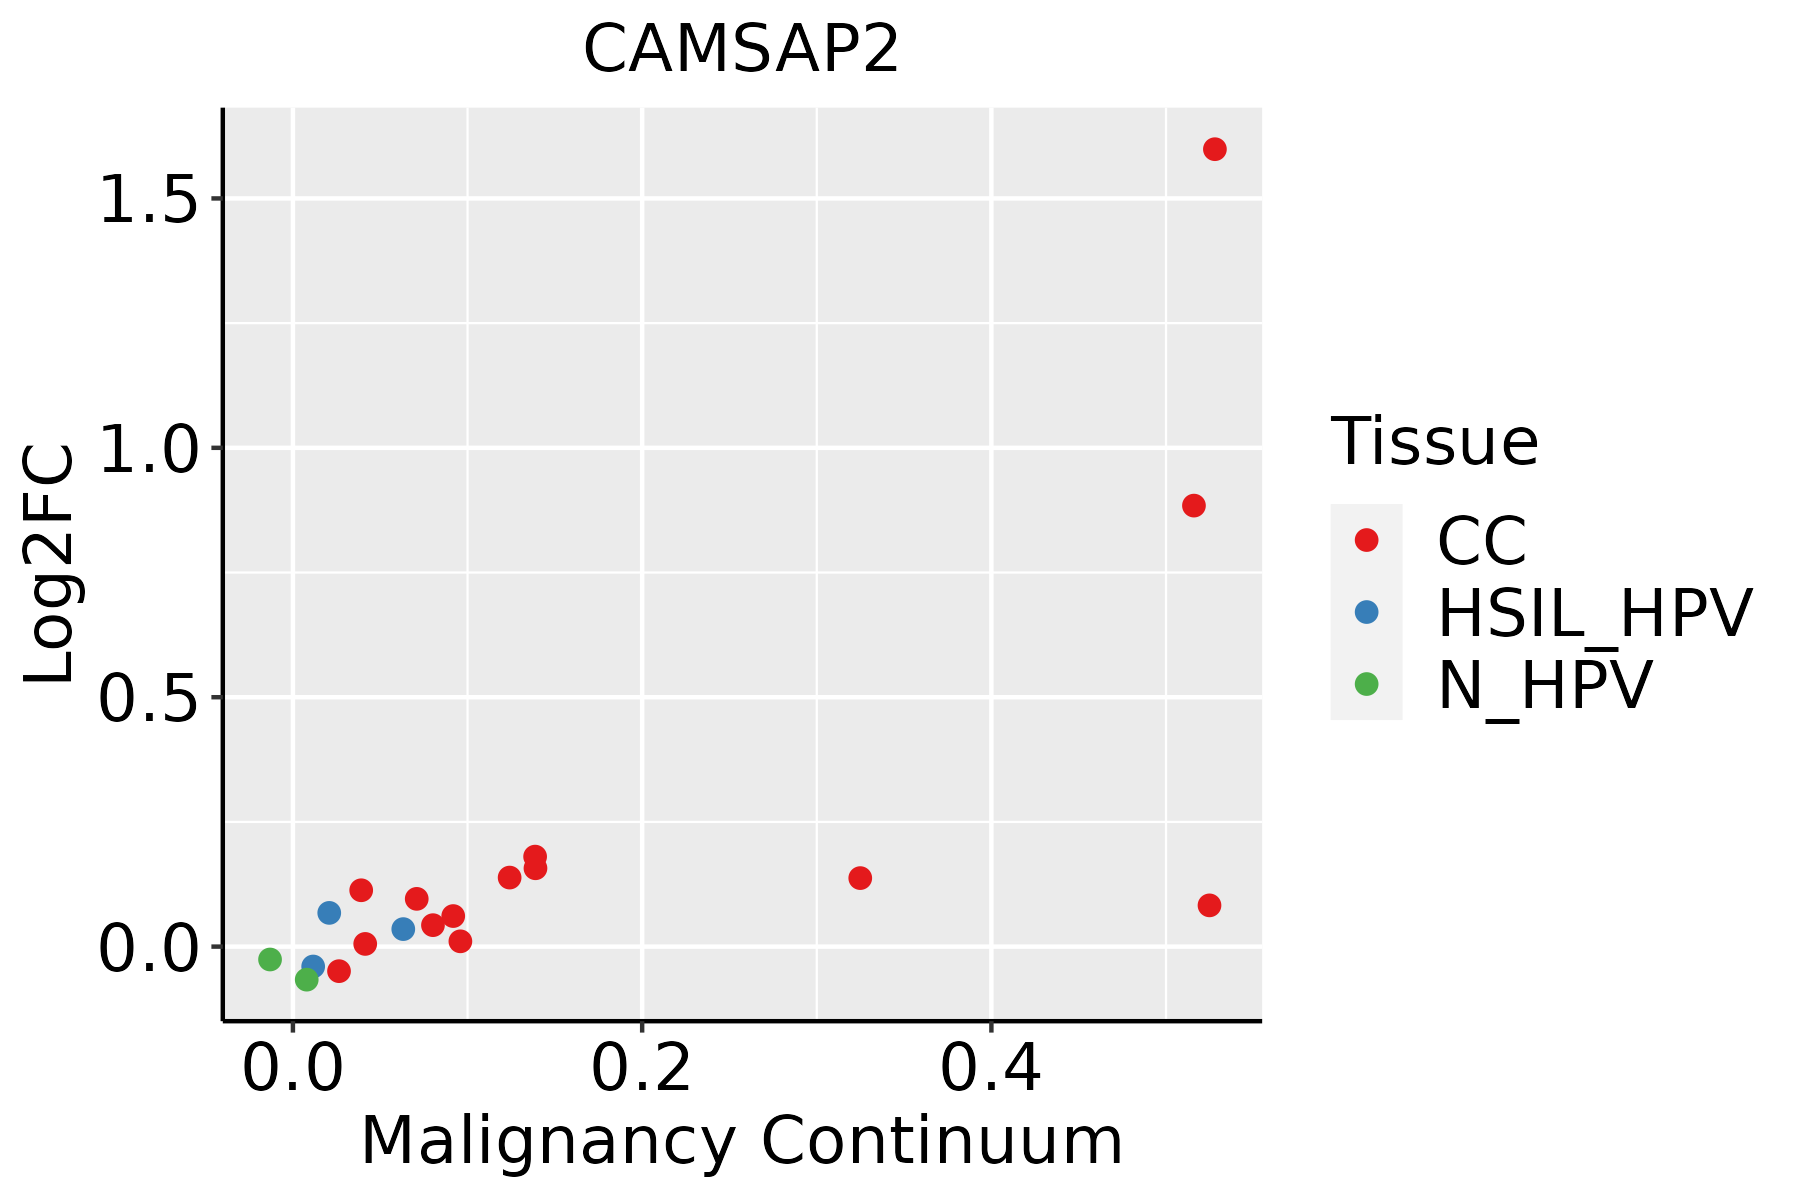 | CC: Cervix cancer |
| HSIL_HPV: HPV-infected high-grade squamous intraepithelial lesions |
| N_HPV: HPV-infected normal cervix |
| Esophagus | 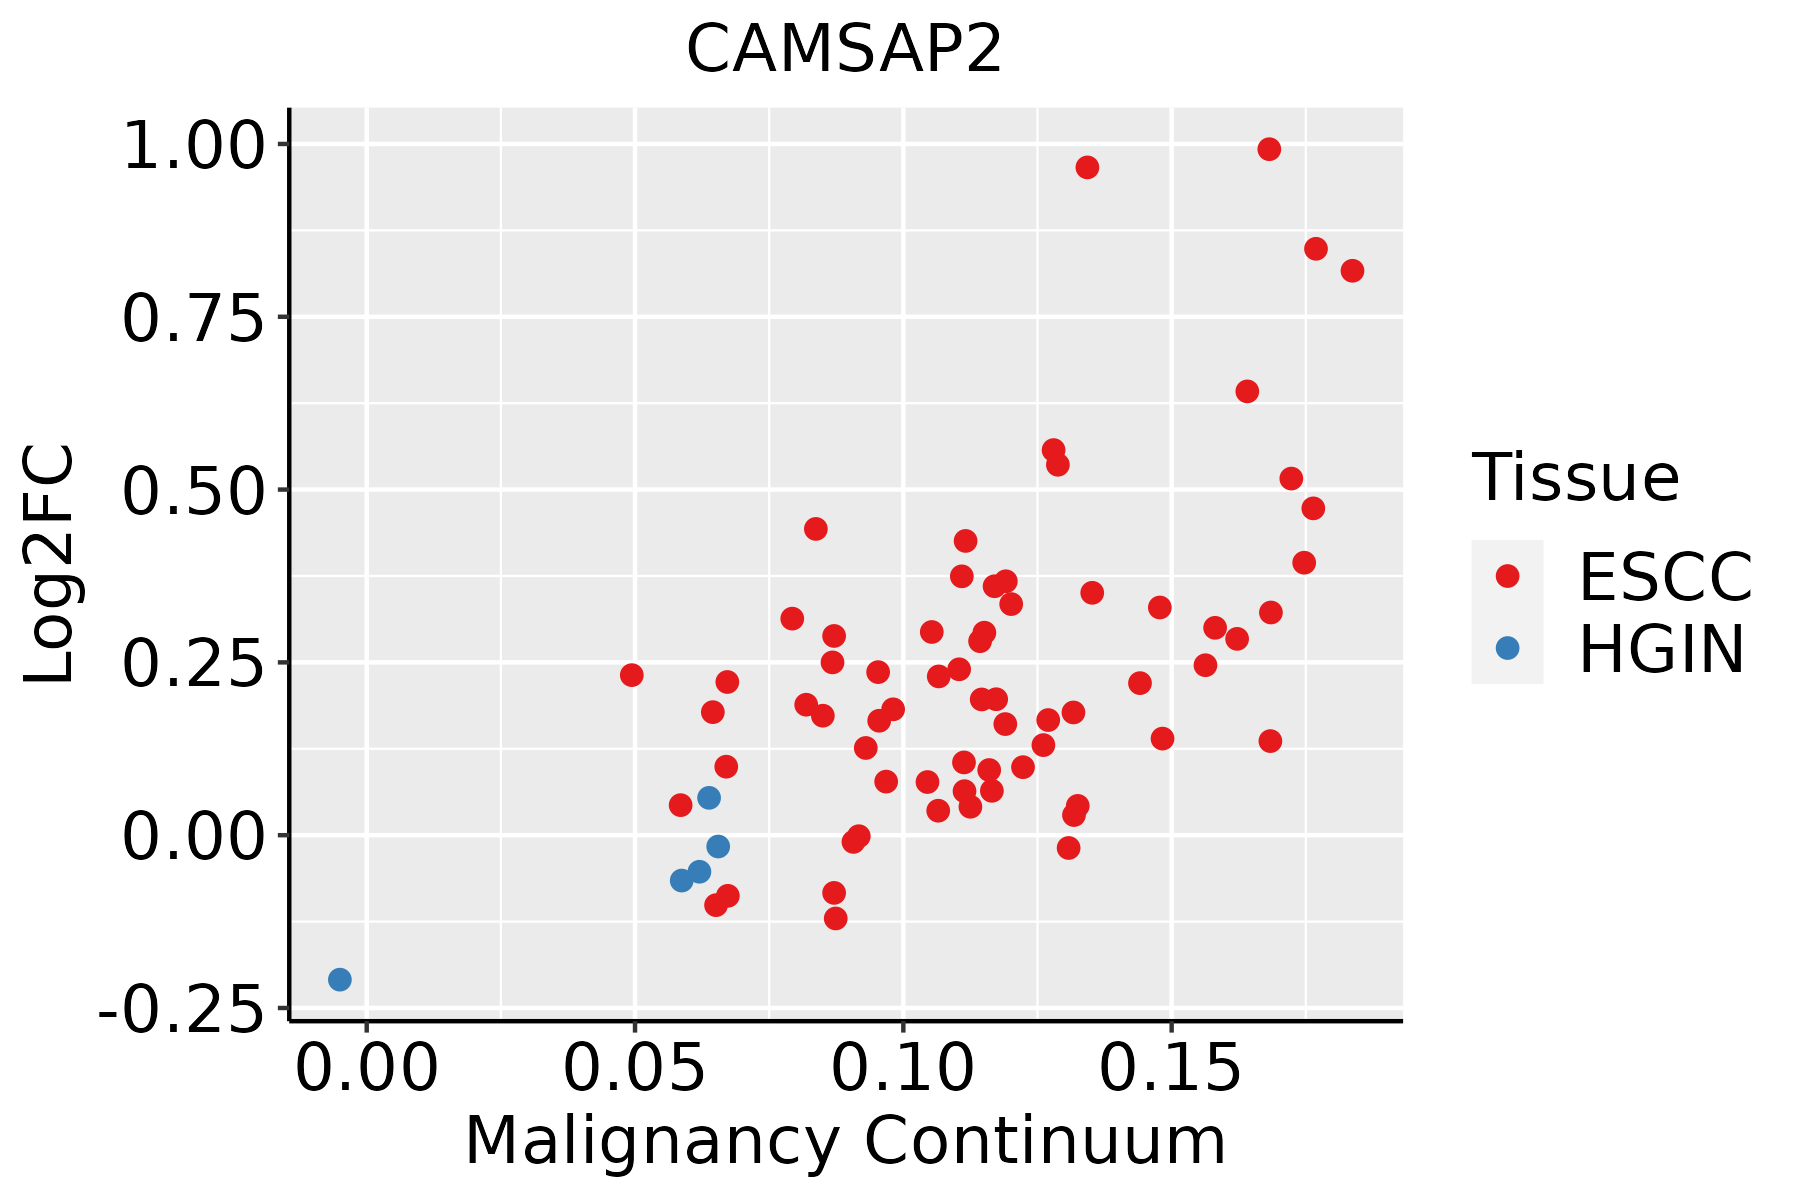 | ESCC: Esophageal squamous cell carcinoma |
| HGIN: High-grade intraepithelial neoplasias |
| LGIN: Low-grade intraepithelial neoplasias |
| Liver |  | HCC: Hepatocellular carcinoma |
| NAFLD: Non-alcoholic fatty liver disease |
| Lung | 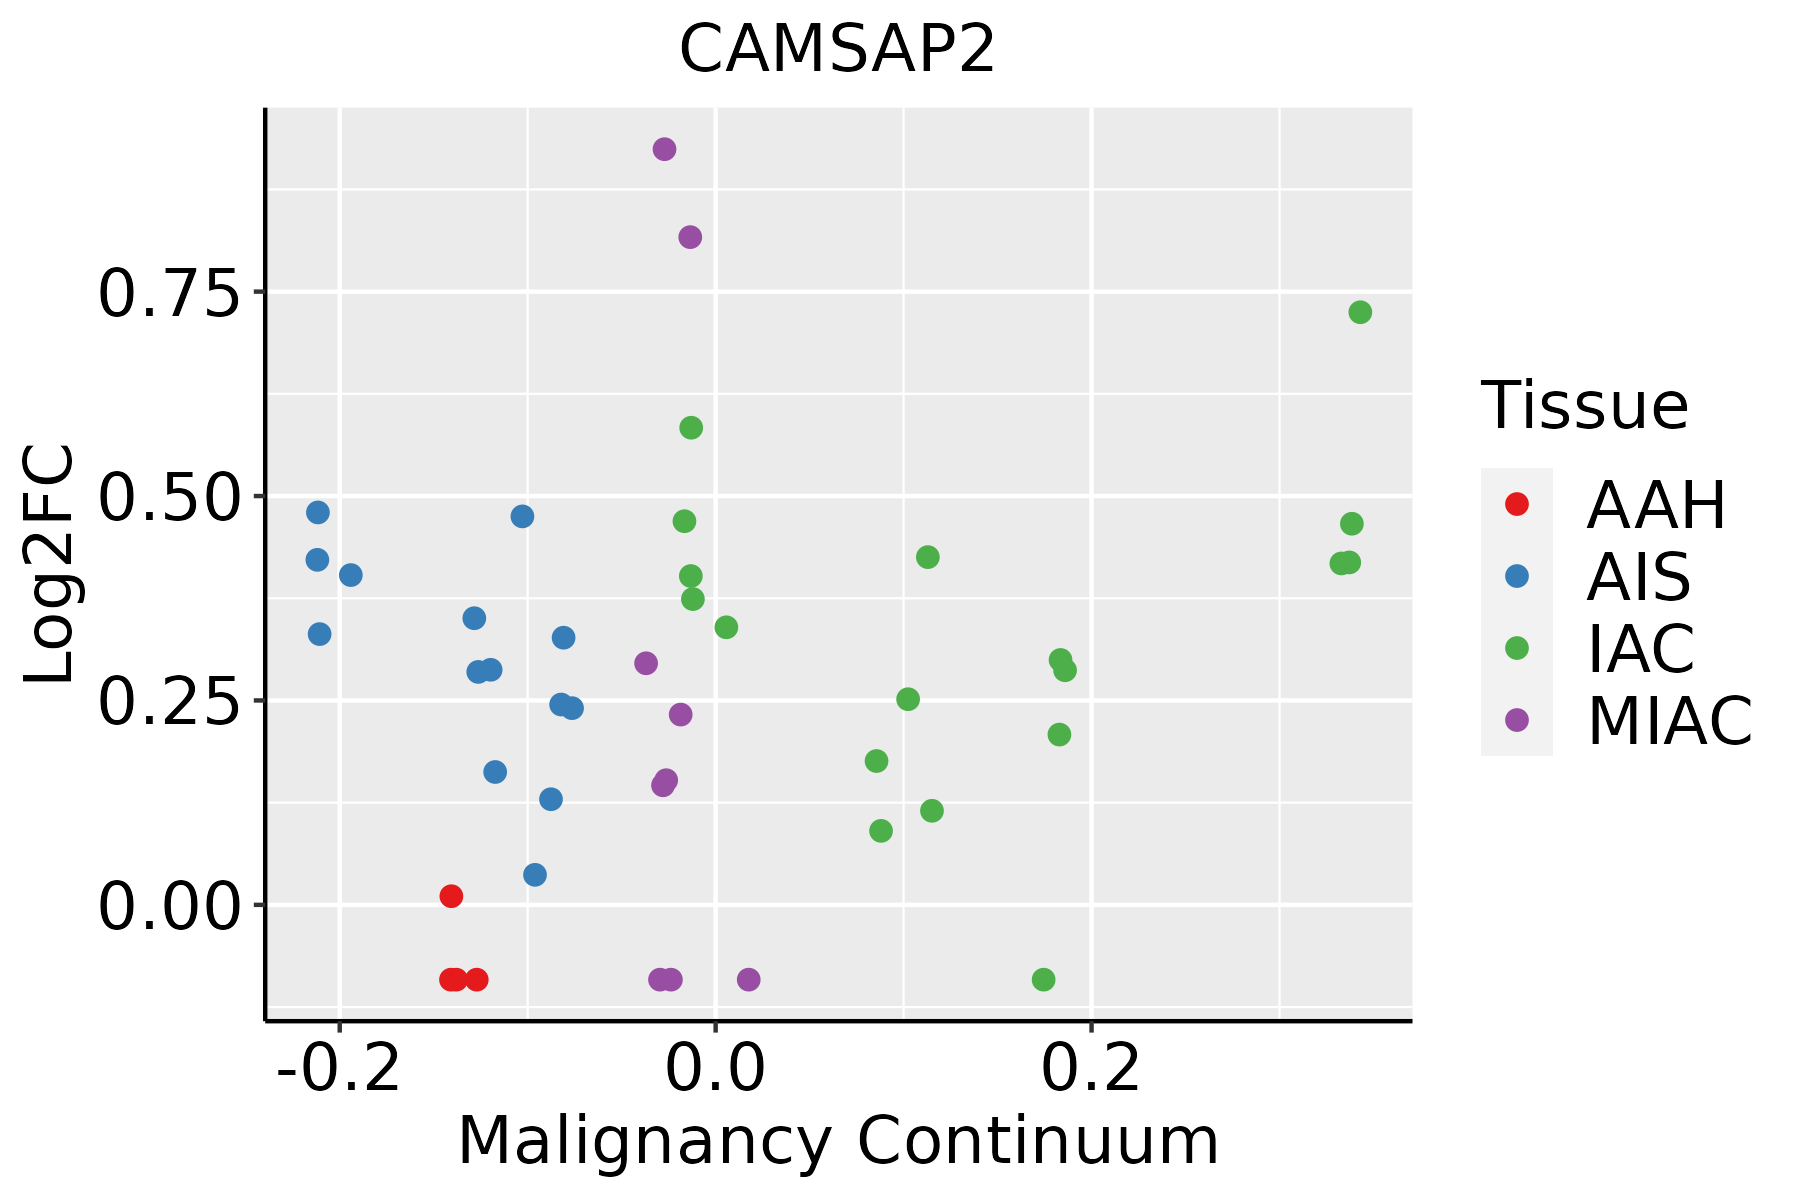 | AAH: Atypical adenomatous hyperplasia |
| AIS: Adenocarcinoma in situ |
| IAC: Invasive lung adenocarcinoma |
| MIA: Minimally invasive adenocarcinoma |
| Oral Cavity | 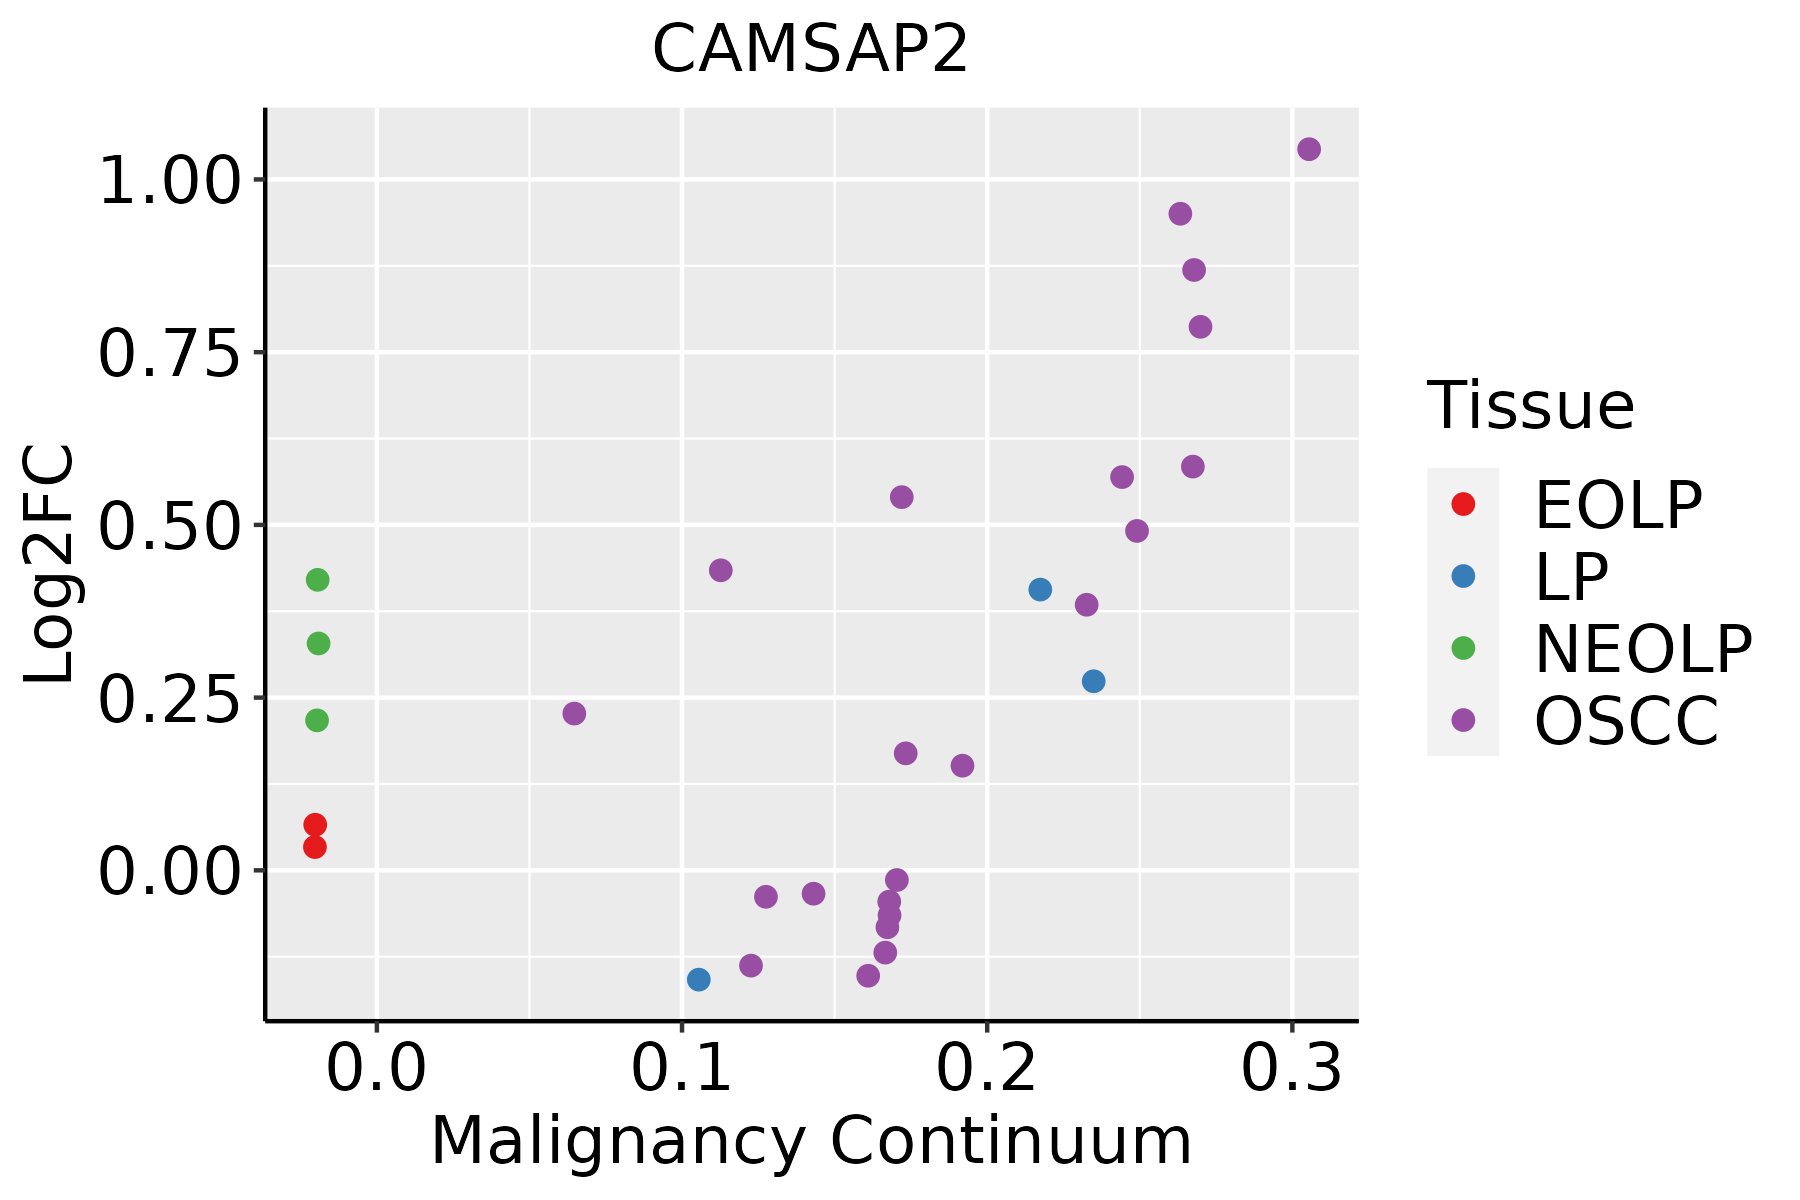 | EOLP: Erosive Oral lichen planus |
| LP: leukoplakia |
| NEOLP: Non-erosive oral lichen planus |
| OSCC: Oral squamous cell carcinoma |
| Prostate | 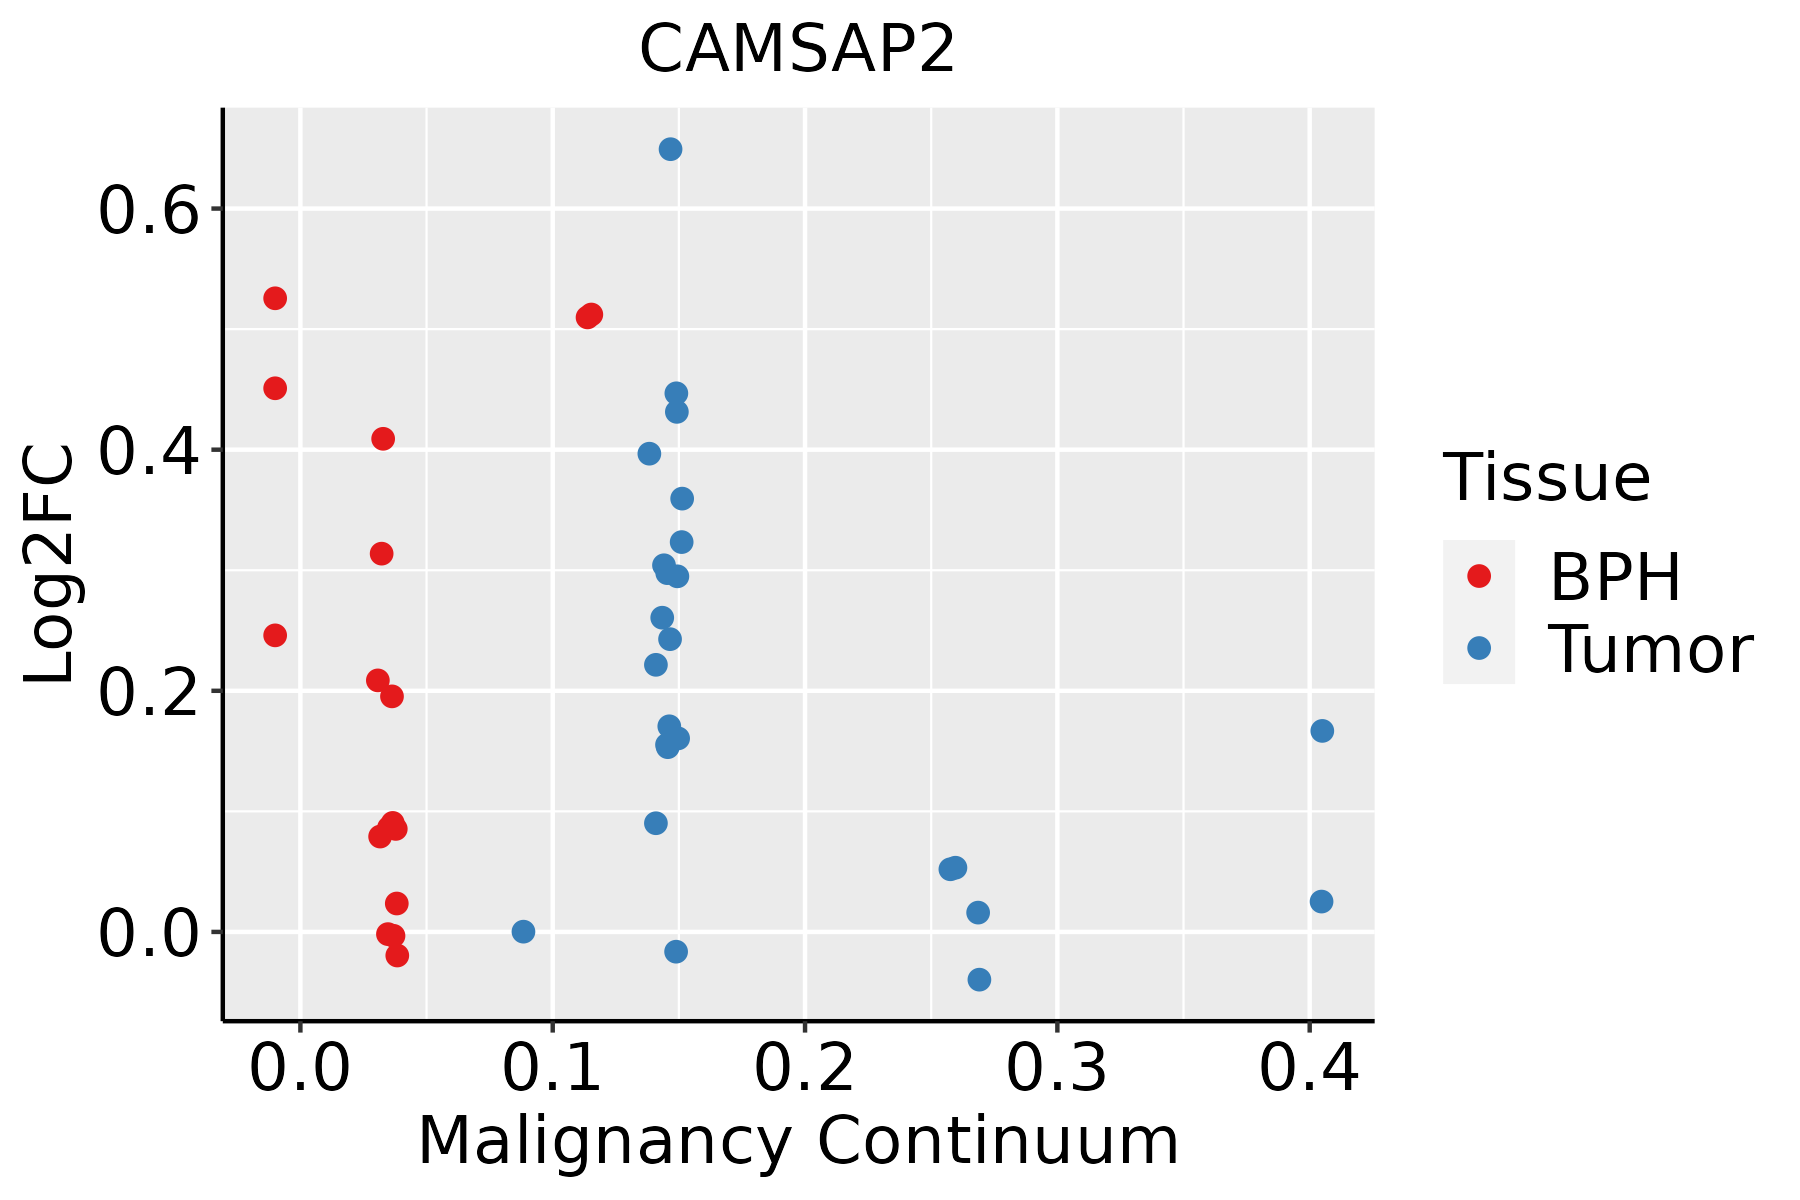 | BPH: Benign Prostatic Hyperplasia |
| Skin | 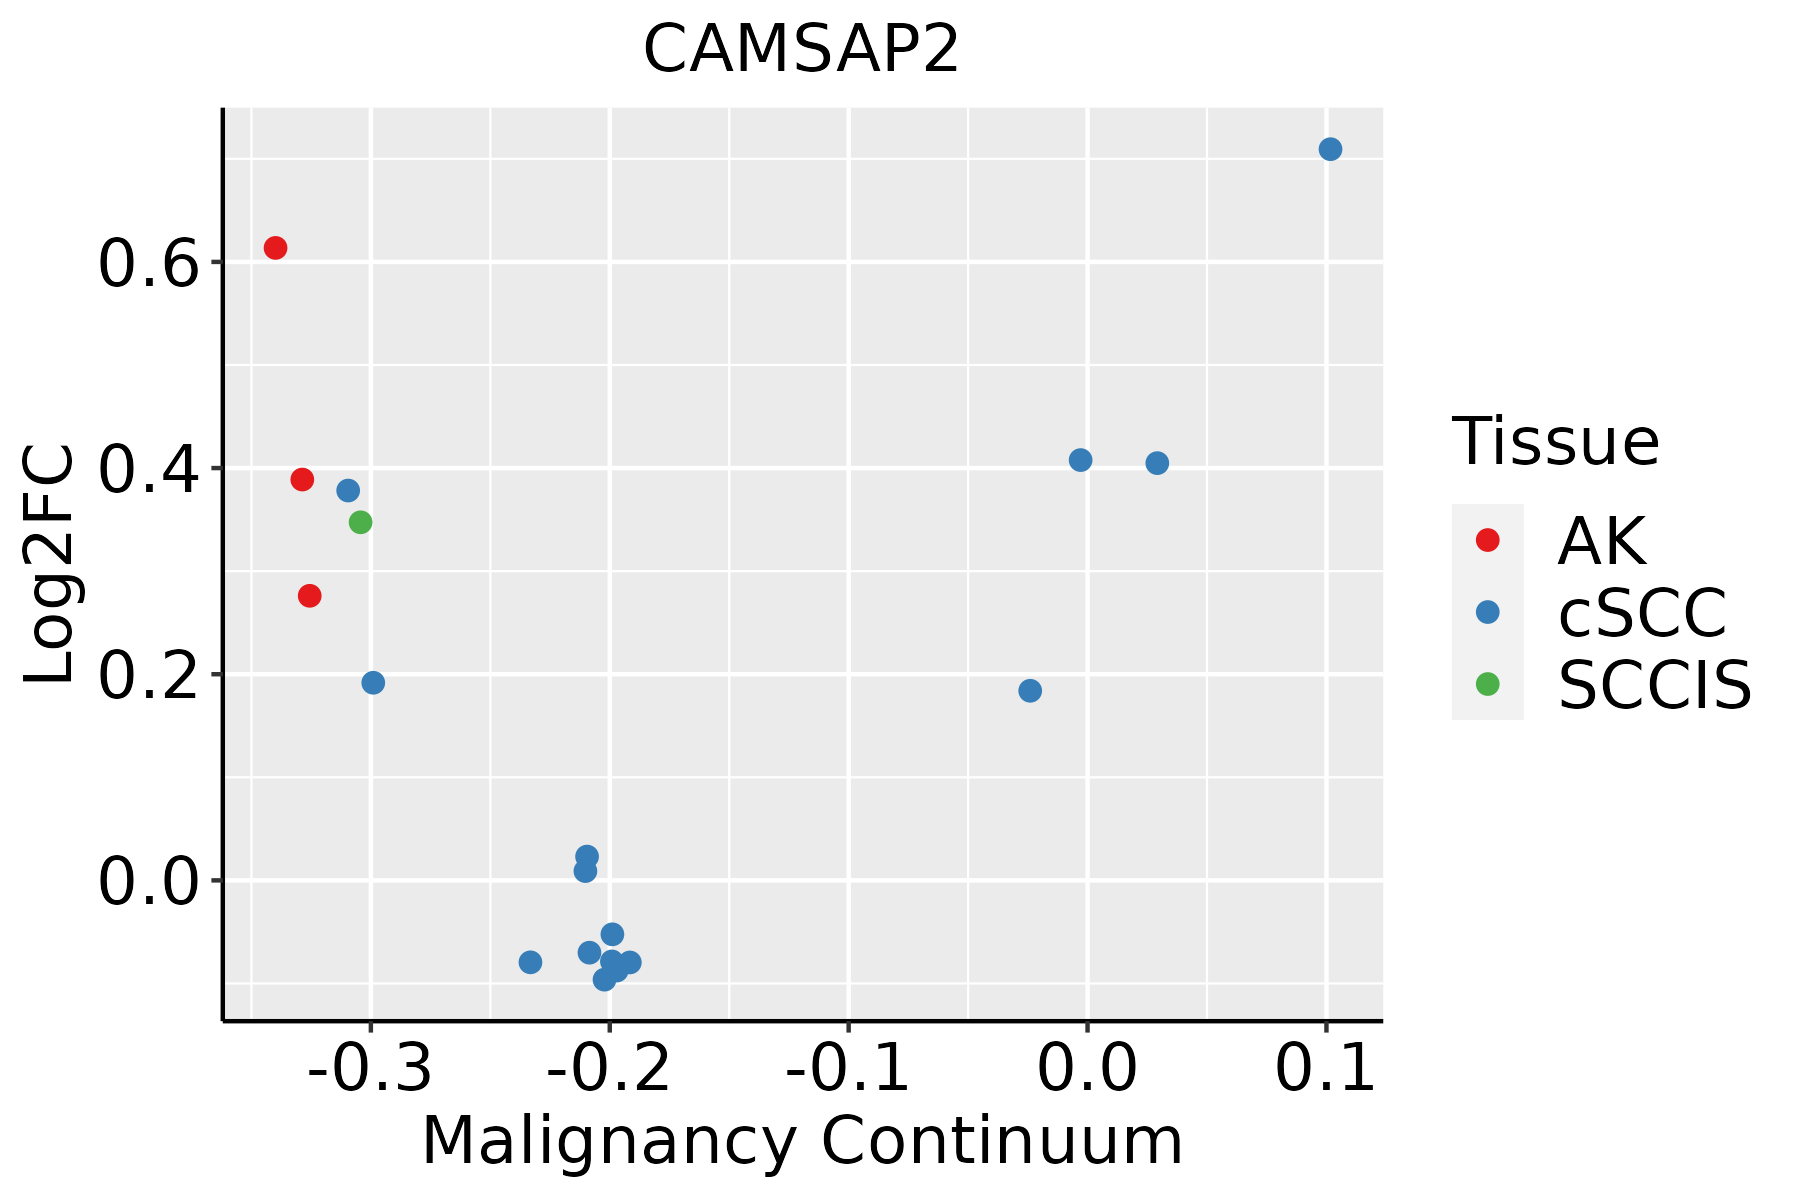 | AK: Actinic keratosis |
| cSCC: Cutaneous squamous cell carcinoma |
| SCCIS:squamous cell carcinoma in situ |
| Thyroid |  | ATC: Anaplastic thyroid cancer |
| HT: Hashimoto's thyroiditis |
| PTC: Papillary thyroid cancer |
| GO ID | Tissue | Disease Stage | Description | Gene Ratio | Bg Ratio | pvalue | p.adjust | Count |
| GO:190290310 | Cervix | CC | regulation of supramolecular fiber organization | 92/2311 | 383/18723 | 1.49e-10 | 2.48e-08 | 92 |
| GO:004325410 | Cervix | CC | regulation of protein-containing complex assembly | 96/2311 | 428/18723 | 2.91e-09 | 3.05e-07 | 96 |
| GO:005125810 | Cervix | CC | protein polymerization | 70/2311 | 297/18723 | 5.20e-08 | 3.11e-06 | 70 |
| GO:003227110 | Cervix | CC | regulation of protein polymerization | 57/2311 | 233/18723 | 2.37e-07 | 1.03e-05 | 57 |
| GO:00163587 | Cervix | CC | dendrite development | 58/2311 | 243/18723 | 4.52e-07 | 1.76e-05 | 58 |
| GO:00109757 | Cervix | CC | regulation of neuron projection development | 88/2311 | 445/18723 | 4.26e-06 | 1.09e-04 | 88 |
| GO:00615647 | Cervix | CC | axon development | 89/2311 | 467/18723 | 1.71e-05 | 3.27e-04 | 89 |
| GO:19029048 | Cervix | CC | negative regulation of supramolecular fiber organization | 40/2311 | 167/18723 | 2.39e-05 | 4.17e-04 | 40 |
| GO:002241110 | Cervix | CC | cellular component disassembly | 83/2311 | 443/18723 | 6.04e-05 | 8.68e-04 | 83 |
| GO:00106399 | Cervix | CC | negative regulation of organelle organization | 68/2311 | 348/18723 | 7.40e-05 | 1.03e-03 | 68 |
| GO:00514948 | Cervix | CC | negative regulation of cytoskeleton organization | 37/2311 | 163/18723 | 1.57e-04 | 1.88e-03 | 37 |
| GO:00705074 | Cervix | CC | regulation of microtubule cytoskeleton organization | 32/2311 | 148/18723 | 1.02e-03 | 8.51e-03 | 32 |
| GO:00311134 | Cervix | CC | regulation of microtubule polymerization | 15/2311 | 55/18723 | 2.14e-03 | 1.54e-02 | 15 |
| GO:19033583 | Cervix | CC | regulation of Golgi organization | 7/2311 | 17/18723 | 2.72e-03 | 1.85e-02 | 7 |
| GO:00070304 | Cervix | CC | Golgi organization | 32/2311 | 157/18723 | 2.78e-03 | 1.87e-02 | 32 |
| GO:00467853 | Cervix | CC | microtubule polymerization | 19/2311 | 83/18723 | 5.25e-03 | 3.08e-02 | 19 |
| GO:00329847 | Cervix | CC | protein-containing complex disassembly | 41/2311 | 224/18723 | 6.13e-03 | 3.48e-02 | 41 |
| GO:00507733 | Cervix | CC | regulation of dendrite development | 22/2311 | 103/18723 | 6.75e-03 | 3.71e-02 | 22 |
| GO:00311224 | Cervix | CC | cytoplasmic microtubule organization | 14/2311 | 56/18723 | 6.93e-03 | 3.74e-02 | 14 |
| GO:0031111 | Cervix | CC | negative regulation of microtubule polymerization or depolymerization | 11/2311 | 40/18723 | 7.54e-03 | 4.02e-02 | 11 |
| Hugo Symbol | Variant Class | Variant Classification | dbSNP RS | HGVSc | HGVSp | HGVSp Short | SWISSPROT | BIOTYPE | SIFT | PolyPhen | Tumor Sample Barcode | Tissue | Histology | Sex | Age | Stage | Therapy Types | Drugs | Outcome |
| CAMSAP2 | SNV | Missense_Mutation | | c.2559N>C | p.Glu853Asp | p.E853D | Q08AD1 | protein_coding | tolerated(0.23) | benign(0.006) | TCGA-A2-A0YD-01 | Breast | breast invasive carcinoma | Female | <65 | I/II | Chemotherapy | cytoxan | SD |
| CAMSAP2 | SNV | Missense_Mutation | | c.2455N>T | p.Ala819Ser | p.A819S | Q08AD1 | protein_coding | tolerated(0.34) | benign(0.012) | TCGA-A8-A085-01 | Breast | breast invasive carcinoma | Male | <65 | I/II | Hormone Therapy | tamoxiphen | SD |
| CAMSAP2 | SNV | Missense_Mutation | | c.779N>T | p.Ala260Val | p.A260V | Q08AD1 | protein_coding | tolerated(0.06) | benign(0.285) | TCGA-A8-A09Z-01 | Breast | breast invasive carcinoma | Female | >=65 | I/II | Unknown | Unknown | SD |
| CAMSAP2 | SNV | Missense_Mutation | | c.2123T>G | p.Leu708Arg | p.L708R | Q08AD1 | protein_coding | deleterious(0.01) | possibly_damaging(0.527) | TCGA-AC-A23H-01 | Breast | breast invasive carcinoma | Female | >=65 | I/II | Unknown | Unknown | PD |
| CAMSAP2 | SNV | Missense_Mutation | | c.2539G>A | p.Asp847Asn | p.D847N | Q08AD1 | protein_coding | tolerated(0.42) | benign(0.021) | TCGA-AC-A23H-01 | Breast | breast invasive carcinoma | Female | >=65 | I/II | Unknown | Unknown | PD |
| CAMSAP2 | SNV | Missense_Mutation | | c.2722G>C | p.Glu908Gln | p.E908Q | Q08AD1 | protein_coding | tolerated(0.07) | probably_damaging(0.982) | TCGA-AC-A23H-01 | Breast | breast invasive carcinoma | Female | >=65 | I/II | Unknown | Unknown | PD |
| CAMSAP2 | SNV | Missense_Mutation | novel | c.110C>T | p.Ala37Val | p.A37V | Q08AD1 | protein_coding | deleterious(0.02) | benign(0.057) | TCGA-AN-A046-01 | Breast | breast invasive carcinoma | Female | >=65 | I/II | Unknown | Unknown | SD |
| CAMSAP2 | SNV | Missense_Mutation | novel | c.226C>A | p.Leu76Ile | p.L76I | Q08AD1 | protein_coding | deleterious(0.03) | benign(0.145) | TCGA-AN-A046-01 | Breast | breast invasive carcinoma | Female | >=65 | I/II | Unknown | Unknown | SD |
| CAMSAP2 | SNV | Missense_Mutation | | c.1232T>G | p.Ile411Ser | p.I411S | Q08AD1 | protein_coding | deleterious(0.05) | probably_damaging(0.91) | TCGA-AN-A0FT-01 | Breast | breast invasive carcinoma | Female | <65 | I/II | Unknown | Unknown | SD |
| CAMSAP2 | SNV | Missense_Mutation | novel | c.1976N>T | p.Gln659Leu | p.Q659L | Q08AD1 | protein_coding | tolerated(0.08) | benign(0.013) | TCGA-AO-A128-01 | Breast | breast invasive carcinoma | Female | <65 | I/II | Chemotherapy | doxorubicin | SD |


