
|
|||||
|
 | |
| |
| |
| |
| |
| |
|
Gene: C9orf16 |
Gene summary for C9ORF16 |
| Gene information | Species | Human | Gene symbol | C9orf16 | Gene ID | 79095 |
| Gene name | bublin coiled coil protein | |
| Gene Alias | C9orf16 | |
| Cytomap | 9q34.11 | |
| Gene Type | protein-coding | GO ID | GO:0008150 | UniProtAcc | Q9BUW7 |
Top |
Malignant transformation analysis |
| Identification of the aberrant gene expression in precancerous and cancerous lesions by comparing the gene expression of stem-like cells in diseased tissues with normal stem cells |
| Entrez ID | Symbol | Replicates | Species | Organ | Tissue | Adj P-value | Log2FC | Malignancy |
| 79095 | C9orf16 | P40T-E | Human | Esophagus | ESCC | 5.32e-44 | 1.37e+00 | 0.109 |
| 79095 | C9orf16 | P42T-E | Human | Esophagus | ESCC | 1.09e-56 | 1.64e+00 | 0.1175 |
| 79095 | C9orf16 | P44T-E | Human | Esophagus | ESCC | 5.07e-24 | 1.16e+00 | 0.1096 |
| 79095 | C9orf16 | P47T-E | Human | Esophagus | ESCC | 1.69e-92 | 1.93e+00 | 0.1067 |
| 79095 | C9orf16 | P48T-E | Human | Esophagus | ESCC | 9.31e-71 | 1.53e+00 | 0.0959 |
| 79095 | C9orf16 | P49T-E | Human | Esophagus | ESCC | 4.96e-22 | 2.46e+00 | 0.1768 |
| 79095 | C9orf16 | P52T-E | Human | Esophagus | ESCC | 2.43e-91 | 1.84e+00 | 0.1555 |
| 79095 | C9orf16 | P54T-E | Human | Esophagus | ESCC | 5.04e-65 | 1.49e+00 | 0.0975 |
| 79095 | C9orf16 | P56T-E | Human | Esophagus | ESCC | 1.21e-06 | 1.65e+00 | 0.1613 |
| 79095 | C9orf16 | P57T-E | Human | Esophagus | ESCC | 7.55e-53 | 1.21e+00 | 0.0926 |
| 79095 | C9orf16 | P61T-E | Human | Esophagus | ESCC | 1.02e-47 | 1.21e+00 | 0.099 |
| 79095 | C9orf16 | P62T-E | Human | Esophagus | ESCC | 3.16e-90 | 1.97e+00 | 0.1302 |
| 79095 | C9orf16 | P65T-E | Human | Esophagus | ESCC | 2.69e-68 | 1.47e+00 | 0.0978 |
| 79095 | C9orf16 | P74T-E | Human | Esophagus | ESCC | 1.50e-82 | 3.68e+00 | 0.1479 |
| 79095 | C9orf16 | P75T-E | Human | Esophagus | ESCC | 5.47e-110 | 3.22e+00 | 0.1125 |
| 79095 | C9orf16 | P76T-E | Human | Esophagus | ESCC | 1.79e-84 | 2.02e+00 | 0.1207 |
| 79095 | C9orf16 | P79T-E | Human | Esophagus | ESCC | 3.51e-50 | 1.23e+00 | 0.1154 |
| 79095 | C9orf16 | P80T-E | Human | Esophagus | ESCC | 1.03e-70 | 2.29e+00 | 0.155 |
| 79095 | C9orf16 | P82T-E | Human | Esophagus | ESCC | 3.13e-39 | 2.97e+00 | 0.1072 |
| 79095 | C9orf16 | P83T-E | Human | Esophagus | ESCC | 3.87e-85 | 3.06e+00 | 0.1738 |
| Page: 1 2 3 4 5 6 7 8 9 10 11 12 13 |
| Tissue | Expression Dynamics | Abbreviation |
| Breast | 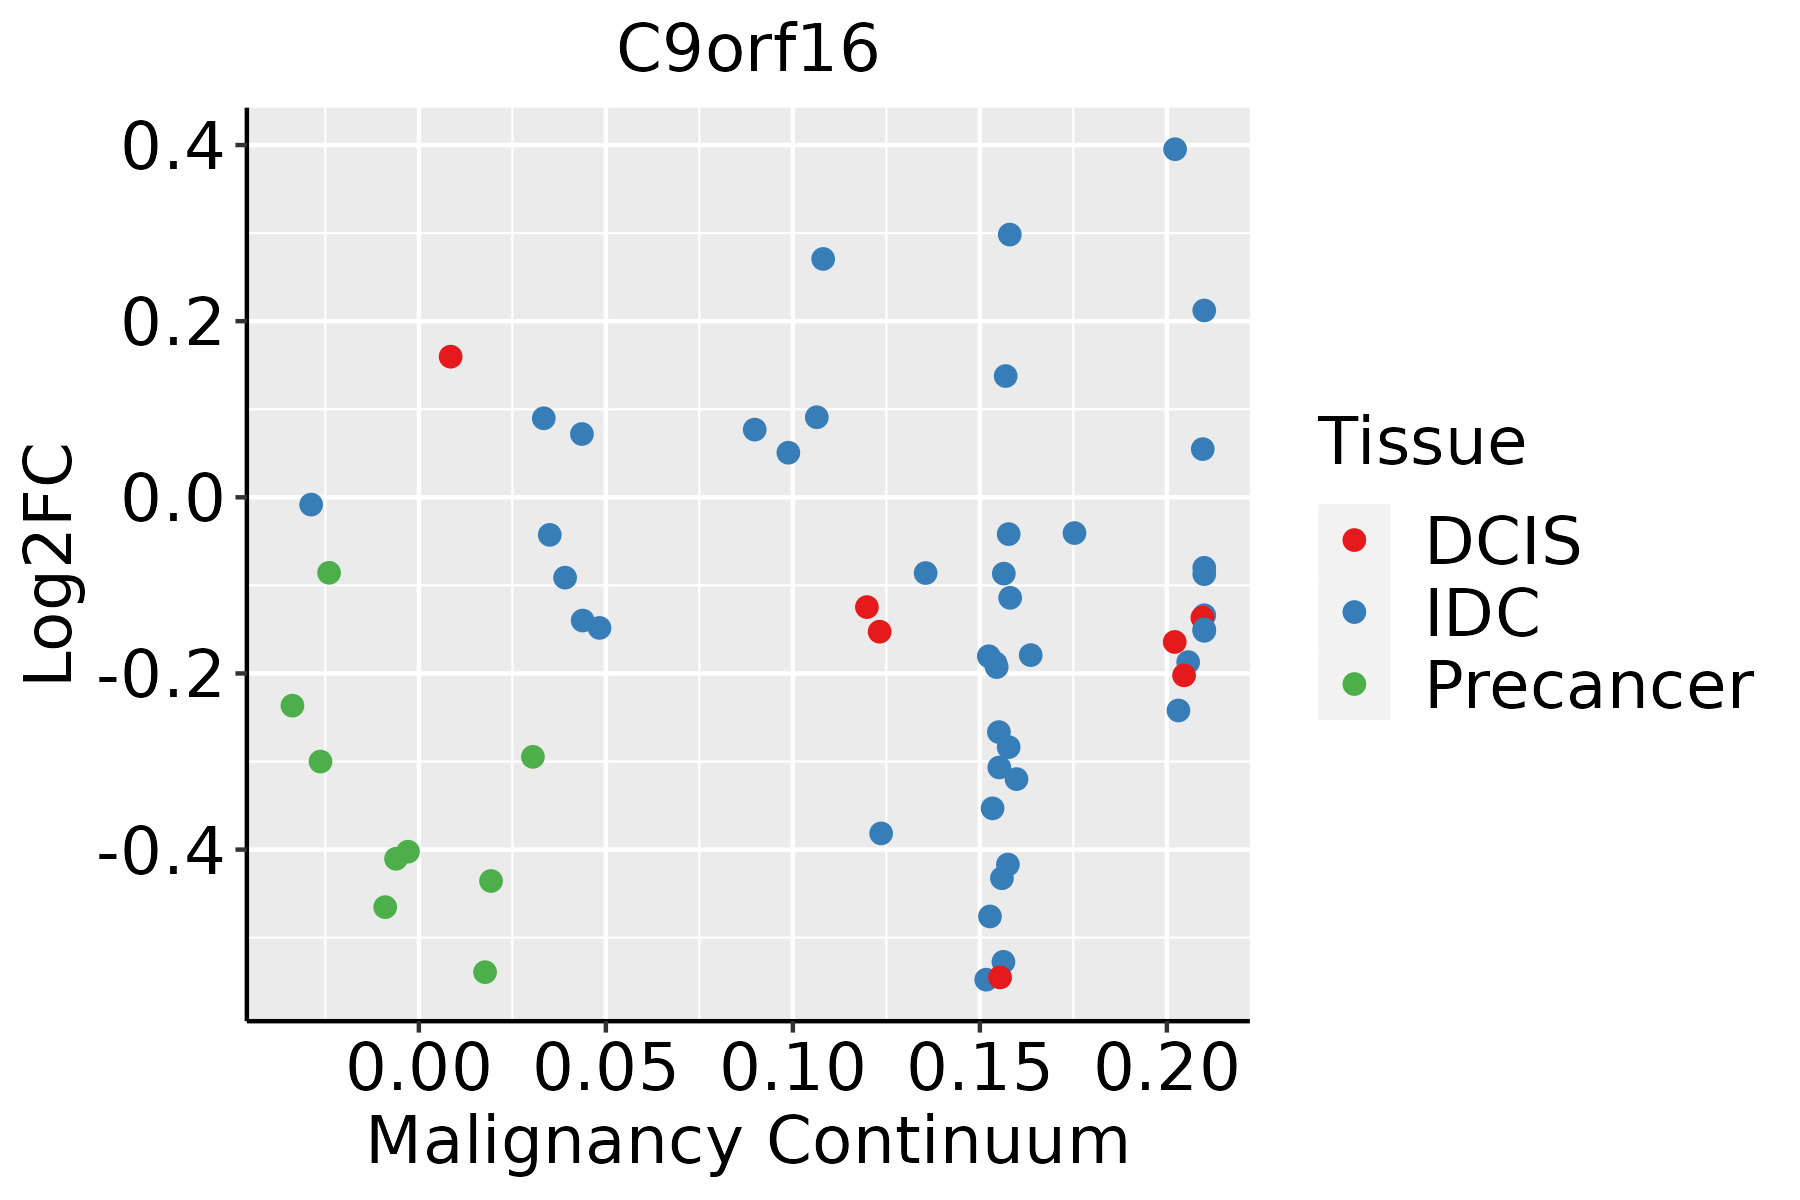 | IDC: Invasive ductal carcinoma |
| DCIS: Ductal carcinoma in situ | ||
| Precancer(BRCA1-mut): Precancerous lesion from BRCA1 mutation carriers | ||
| Cervix | 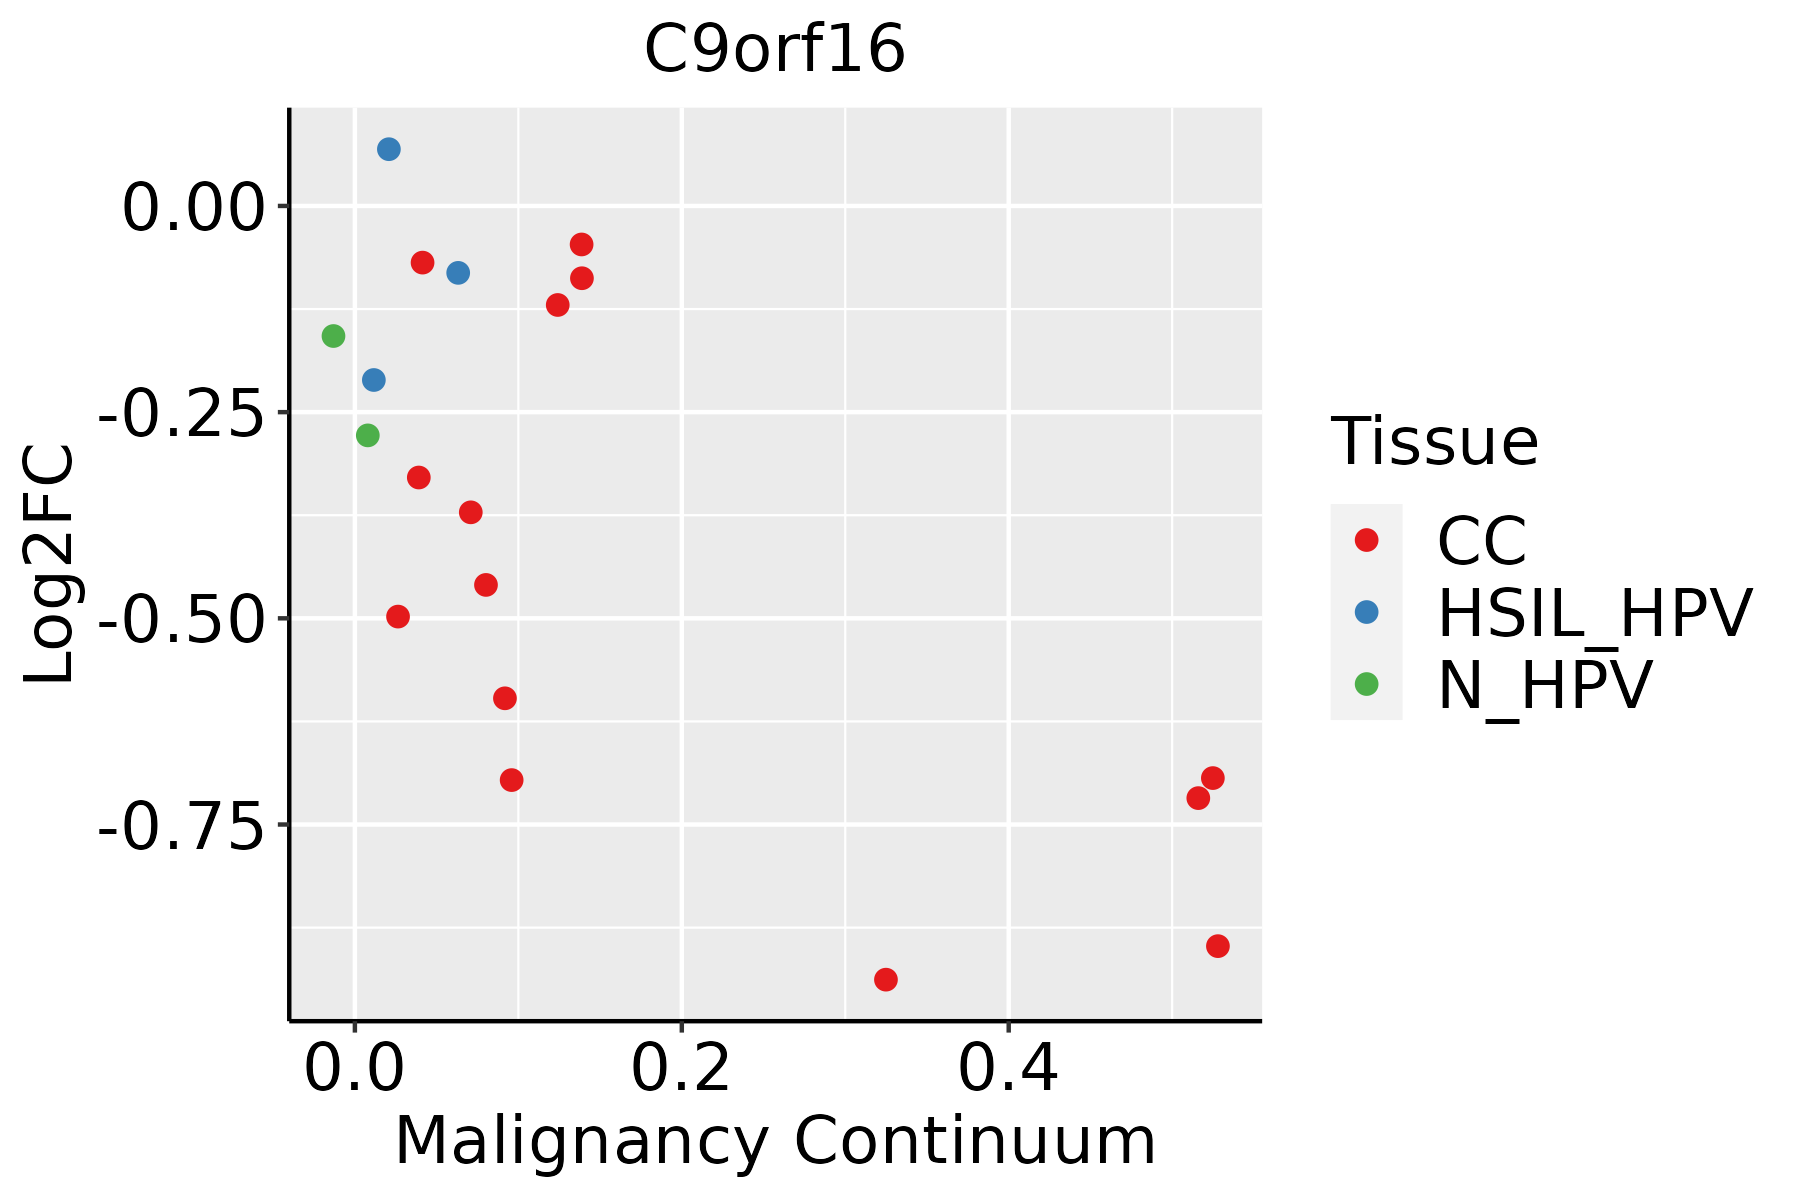 | CC: Cervix cancer |
| HSIL_HPV: HPV-infected high-grade squamous intraepithelial lesions | ||
| N_HPV: HPV-infected normal cervix | ||
| Endometrium | 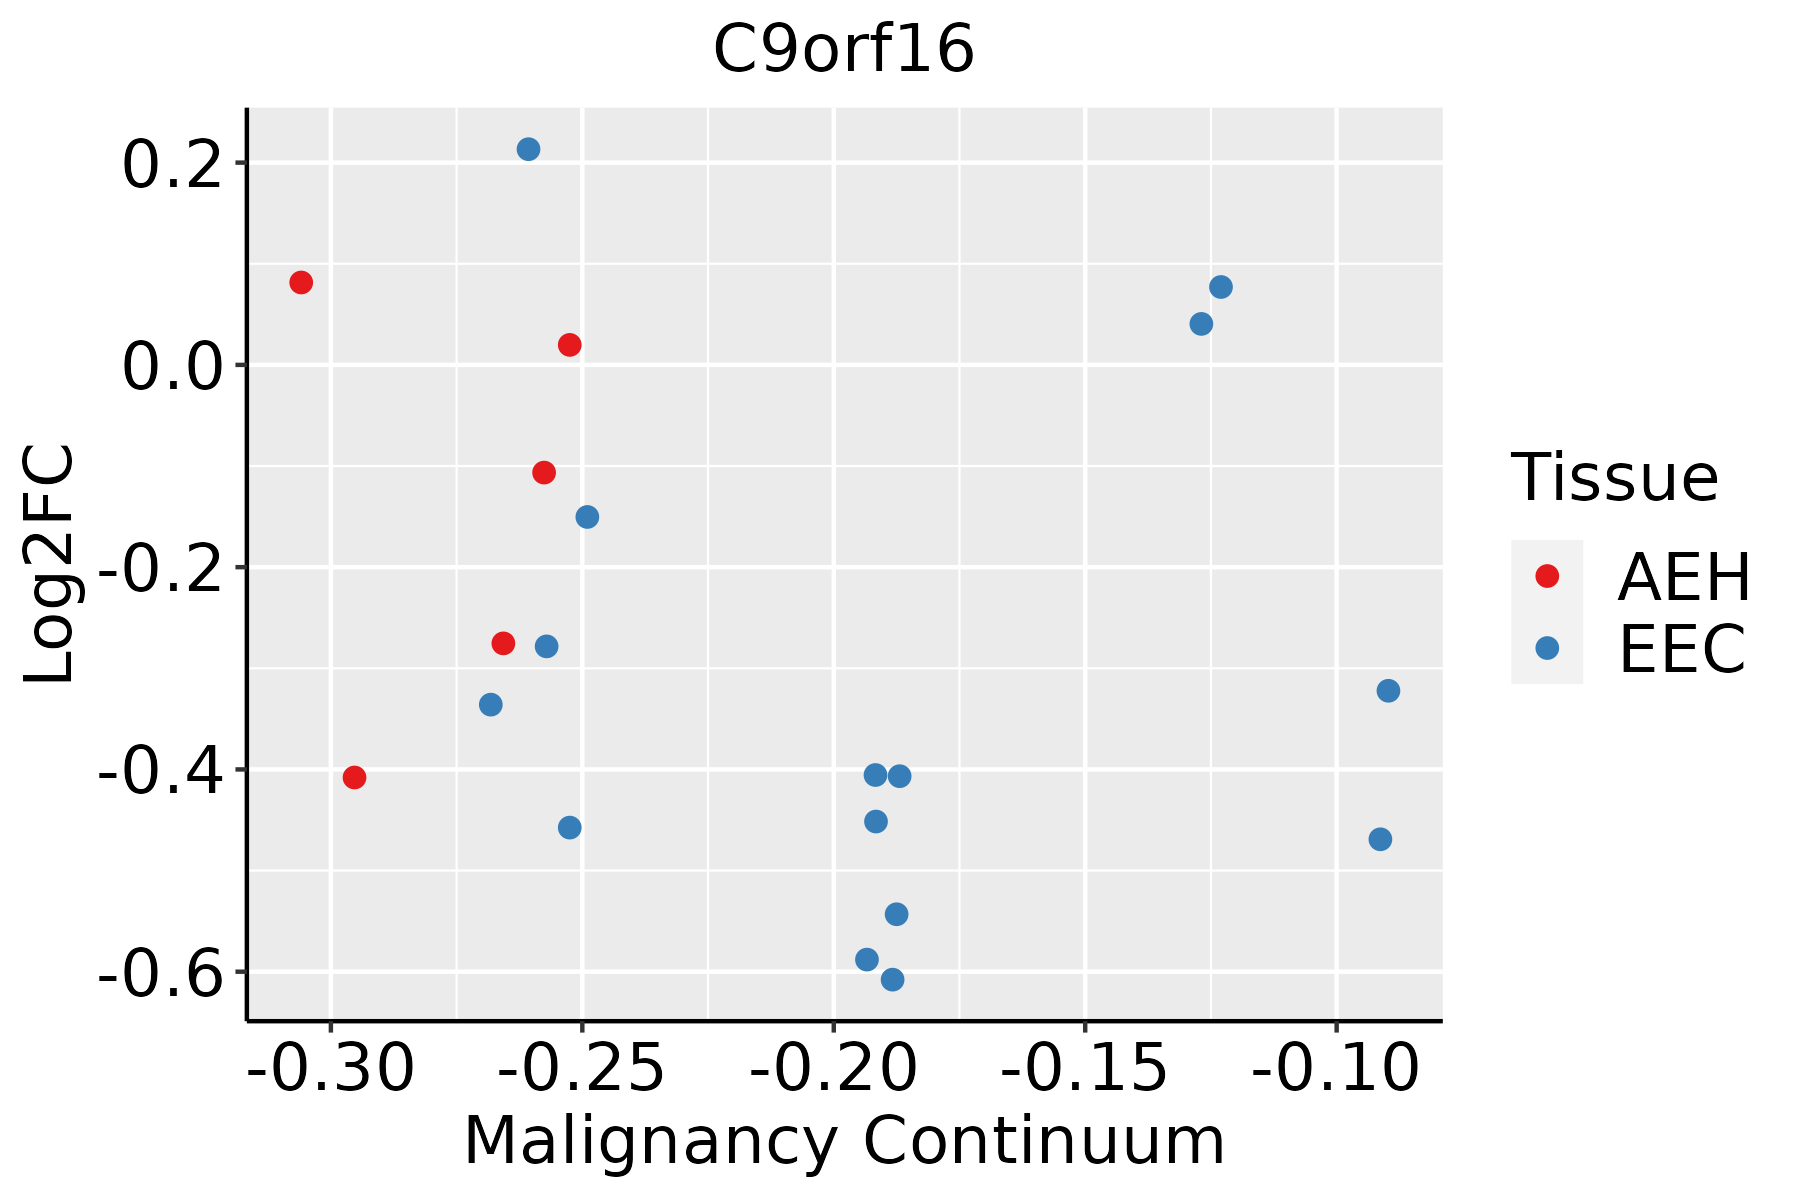 | AEH: Atypical endometrial hyperplasia |
| EEC: Endometrioid Cancer | ||
| Esophagus | 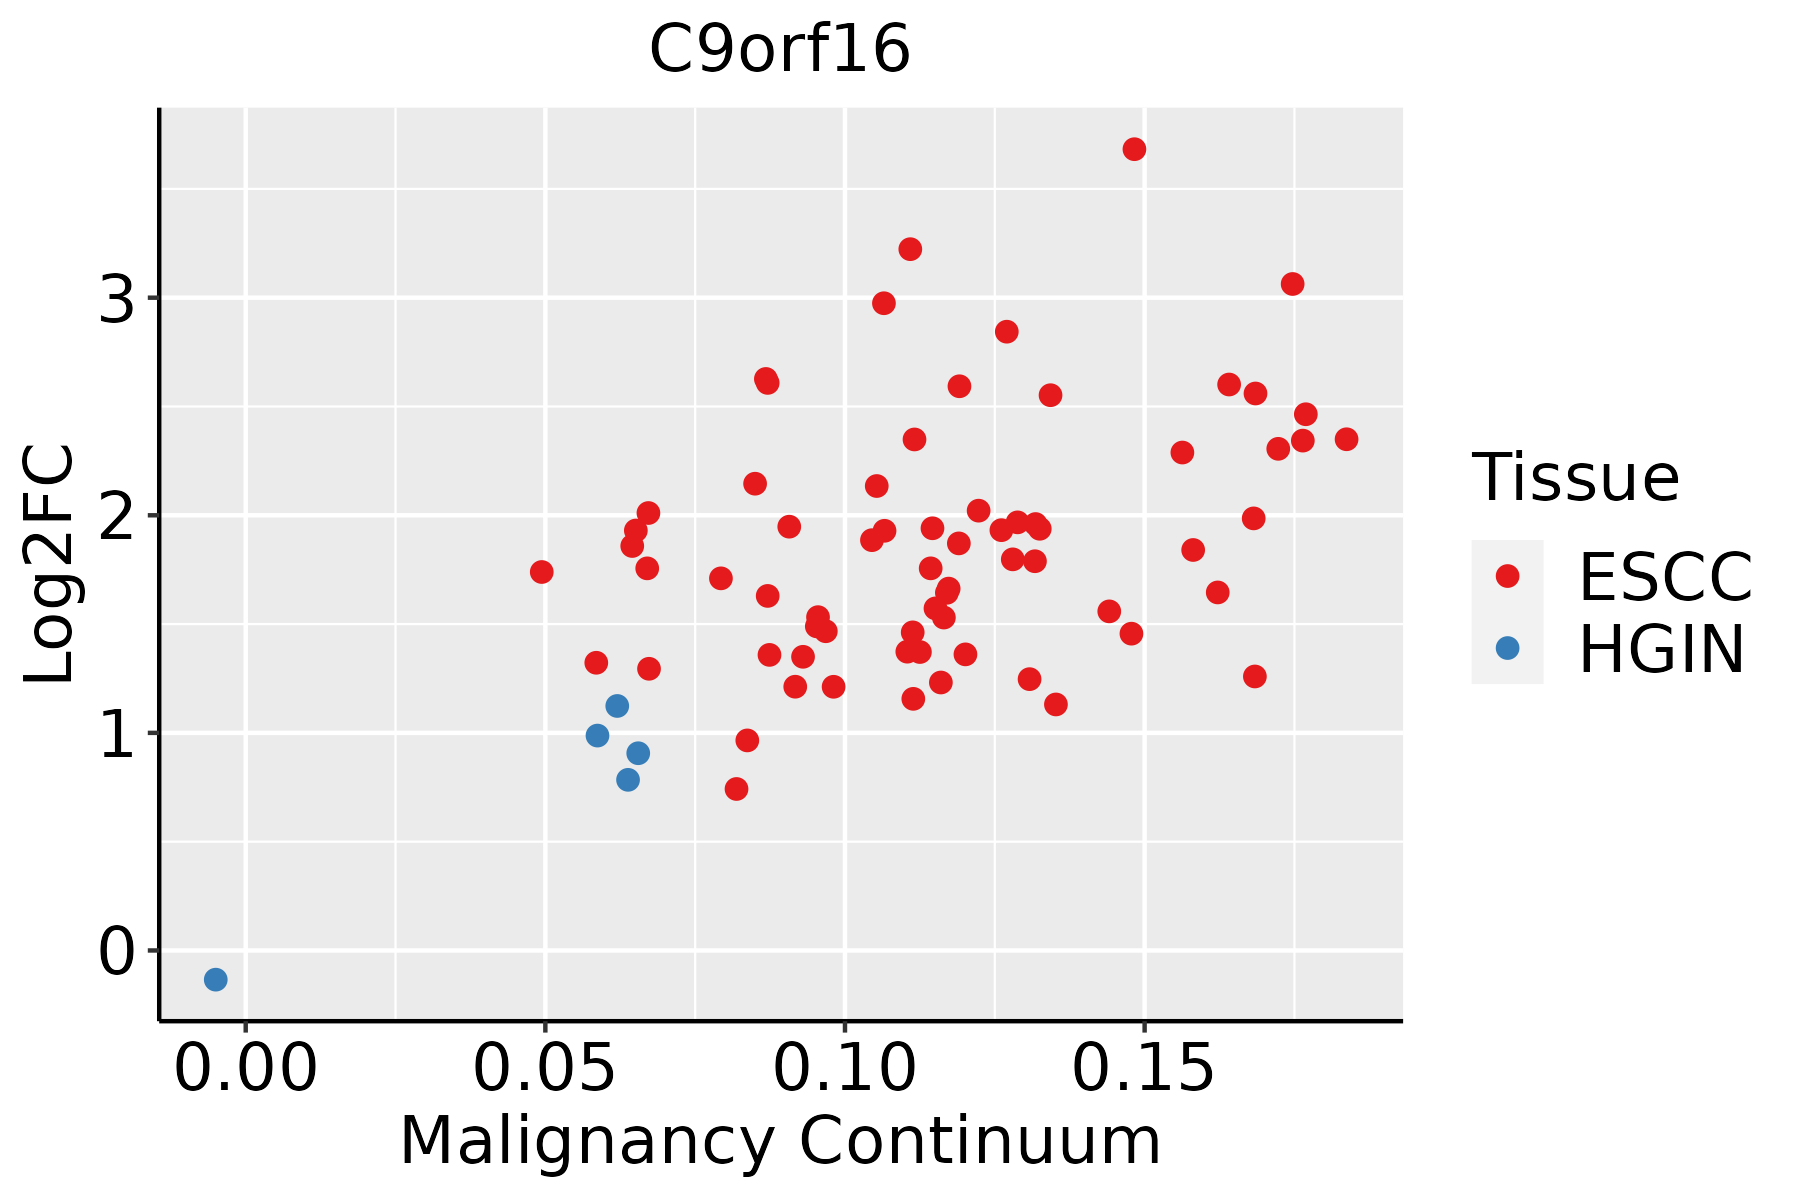 | ESCC: Esophageal squamous cell carcinoma |
| HGIN: High-grade intraepithelial neoplasias | ||
| LGIN: Low-grade intraepithelial neoplasias | ||
| GC |  | CAG: Chronic atrophic gastritis |
| CAG with IM: Chronic atrophic gastritis with intestinal metaplasia | ||
| CSG: Chronic superficial gastritis | ||
| GC: Gastric cancer | ||
| SIM: Severe intestinal metaplasia | ||
| WIM: Wild intestinal metaplasia | ||
| Liver |  | HCC: Hepatocellular carcinoma |
| NAFLD: Non-alcoholic fatty liver disease | ||
| Oral Cavity | 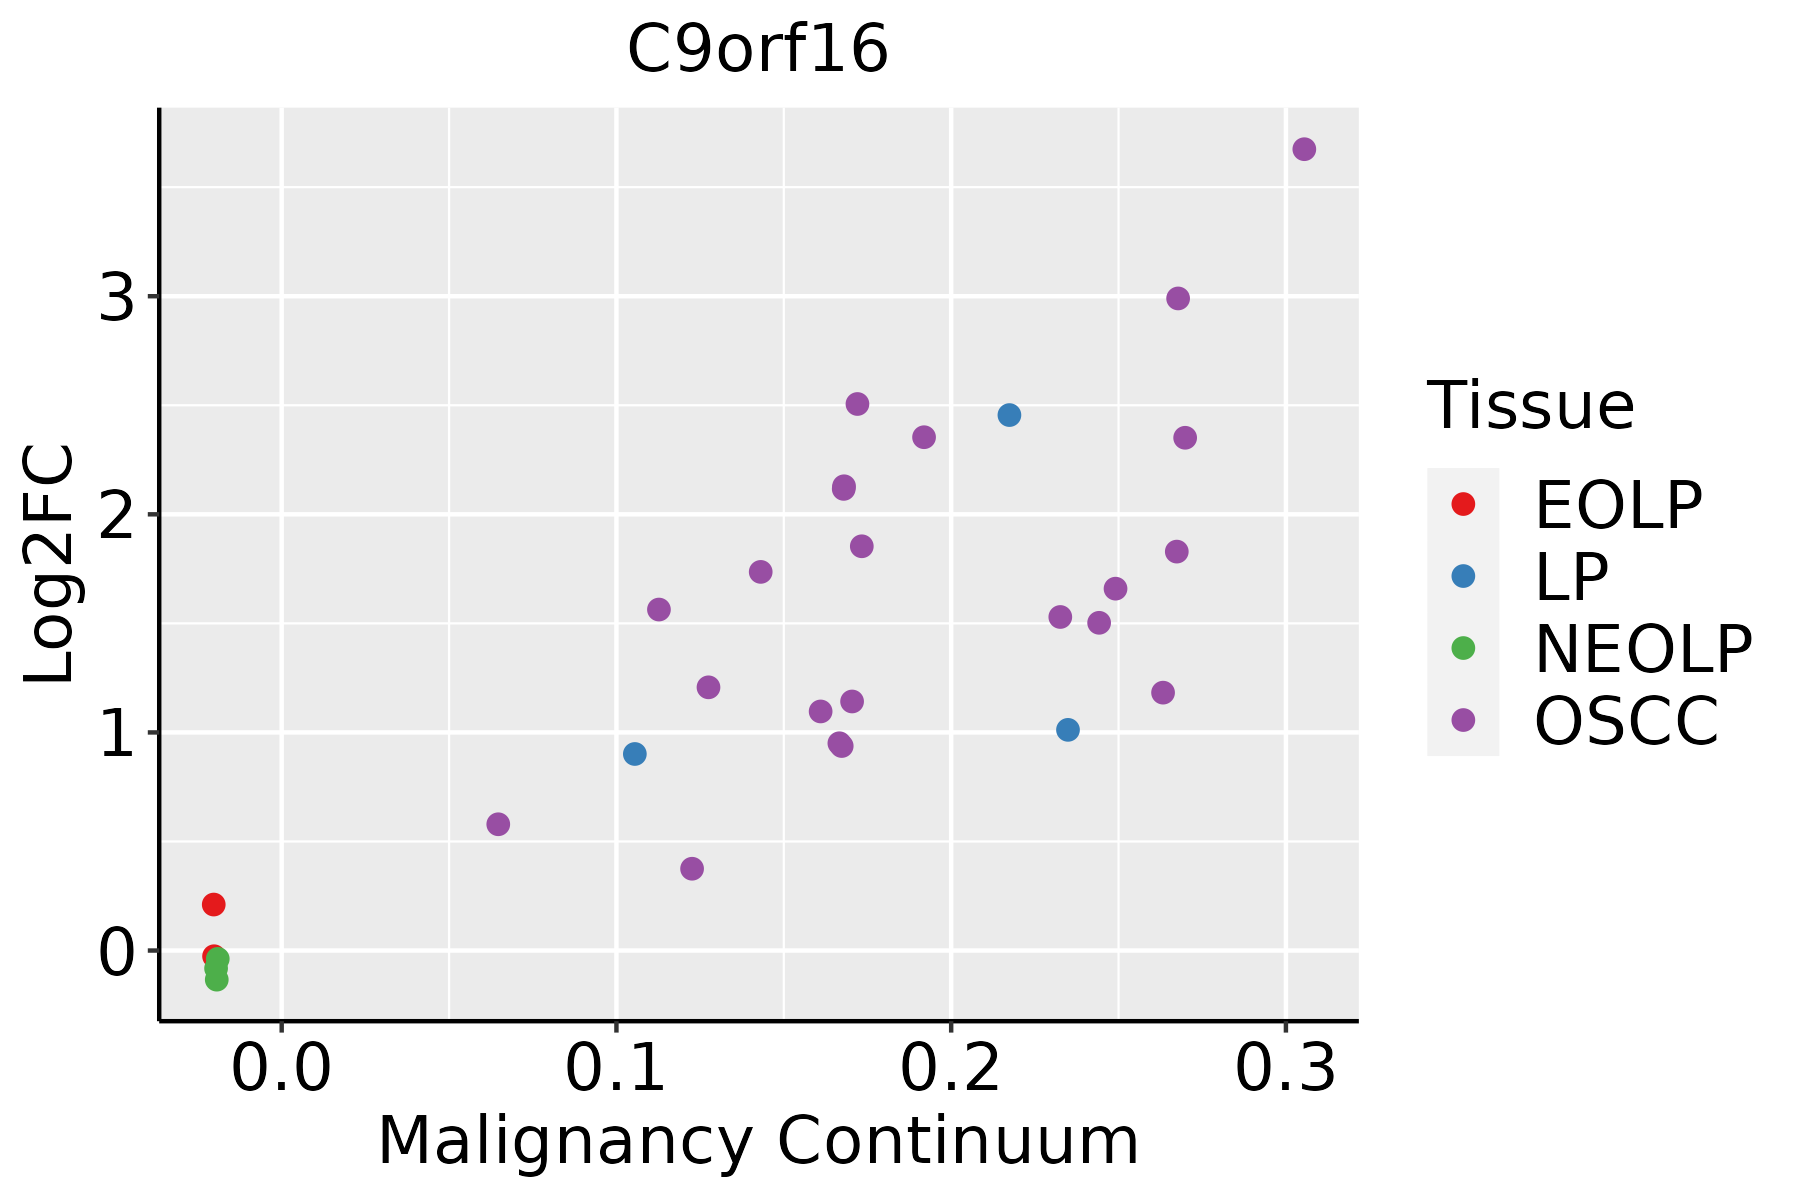 | EOLP: Erosive Oral lichen planus |
| LP: leukoplakia | ||
| NEOLP: Non-erosive oral lichen planus | ||
| OSCC: Oral squamous cell carcinoma | ||
| Prostate | 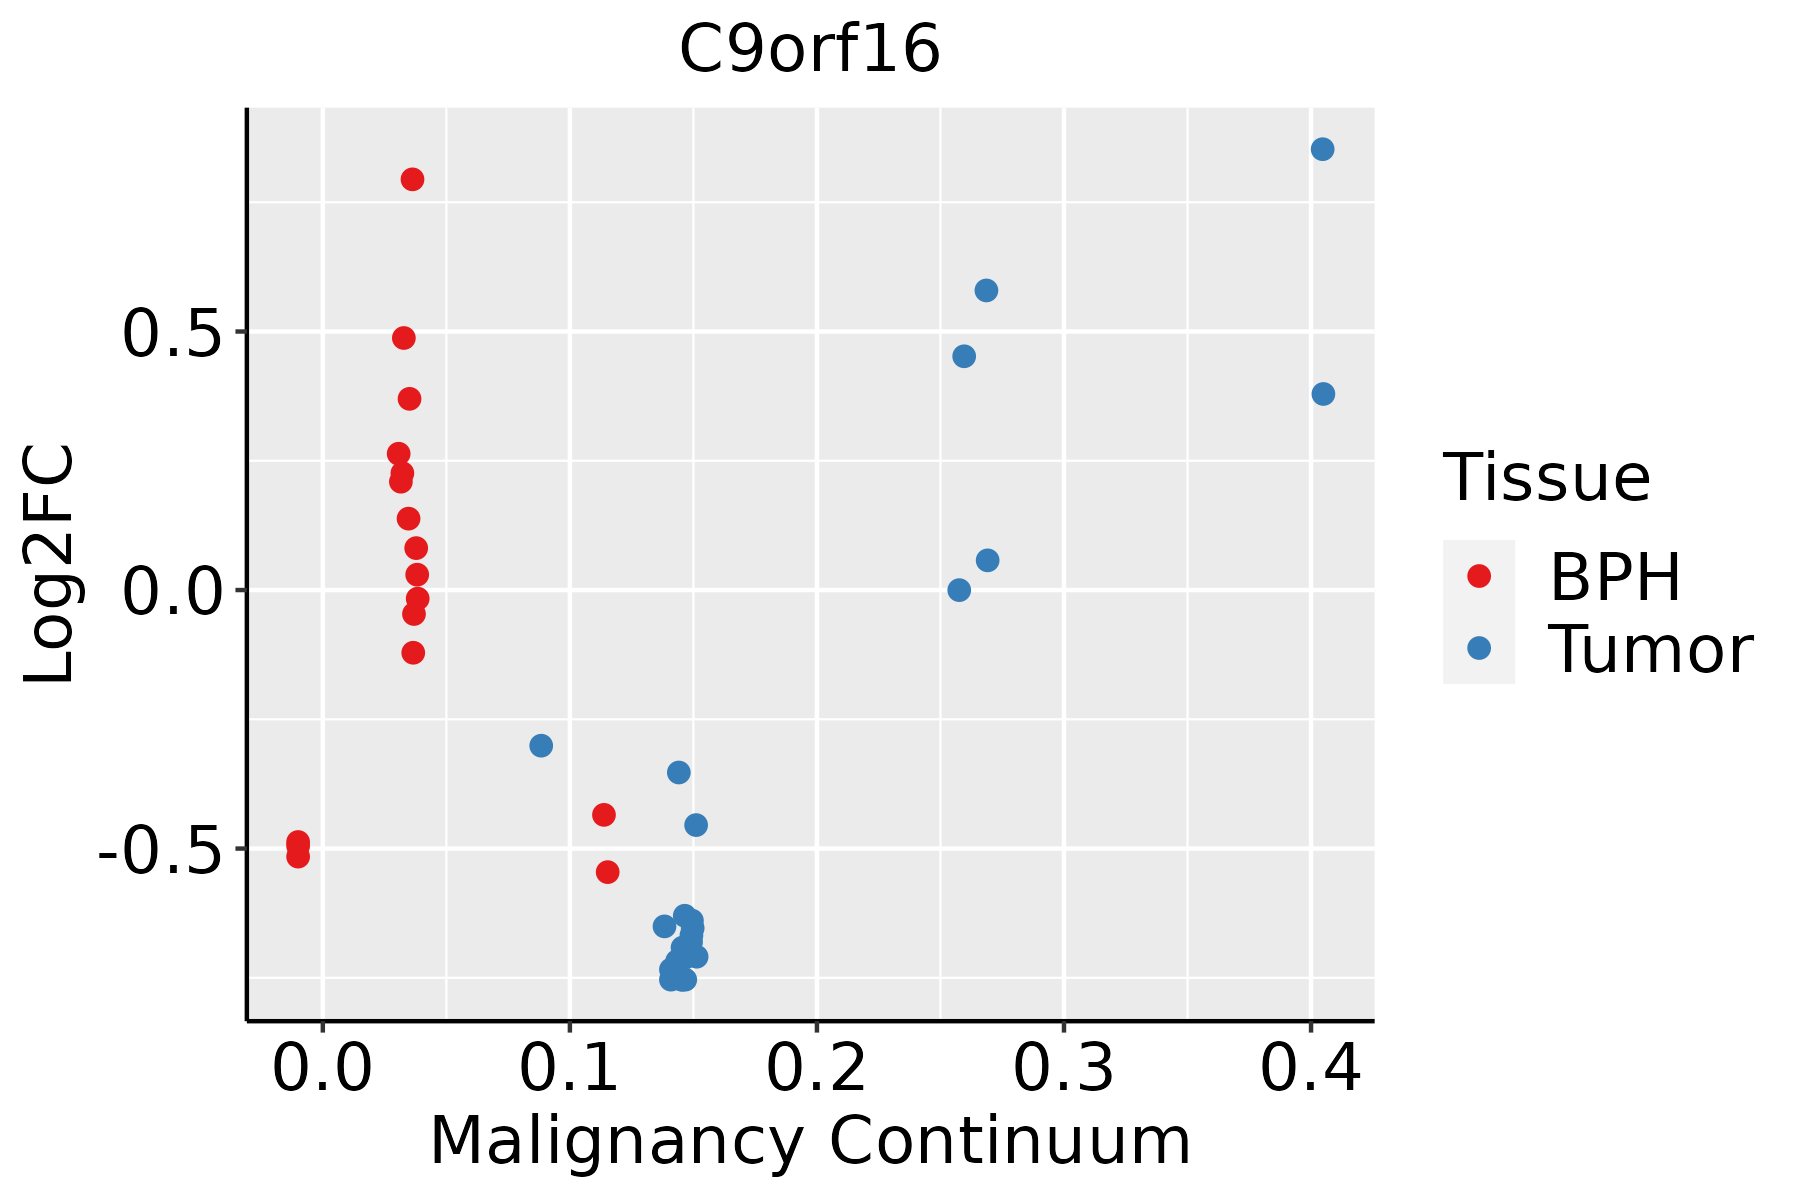 | BPH: Benign Prostatic Hyperplasia |
| Skin |  | AK: Actinic keratosis |
| cSCC: Cutaneous squamous cell carcinoma | ||
| SCCIS:squamous cell carcinoma in situ | ||
| Thyroid | 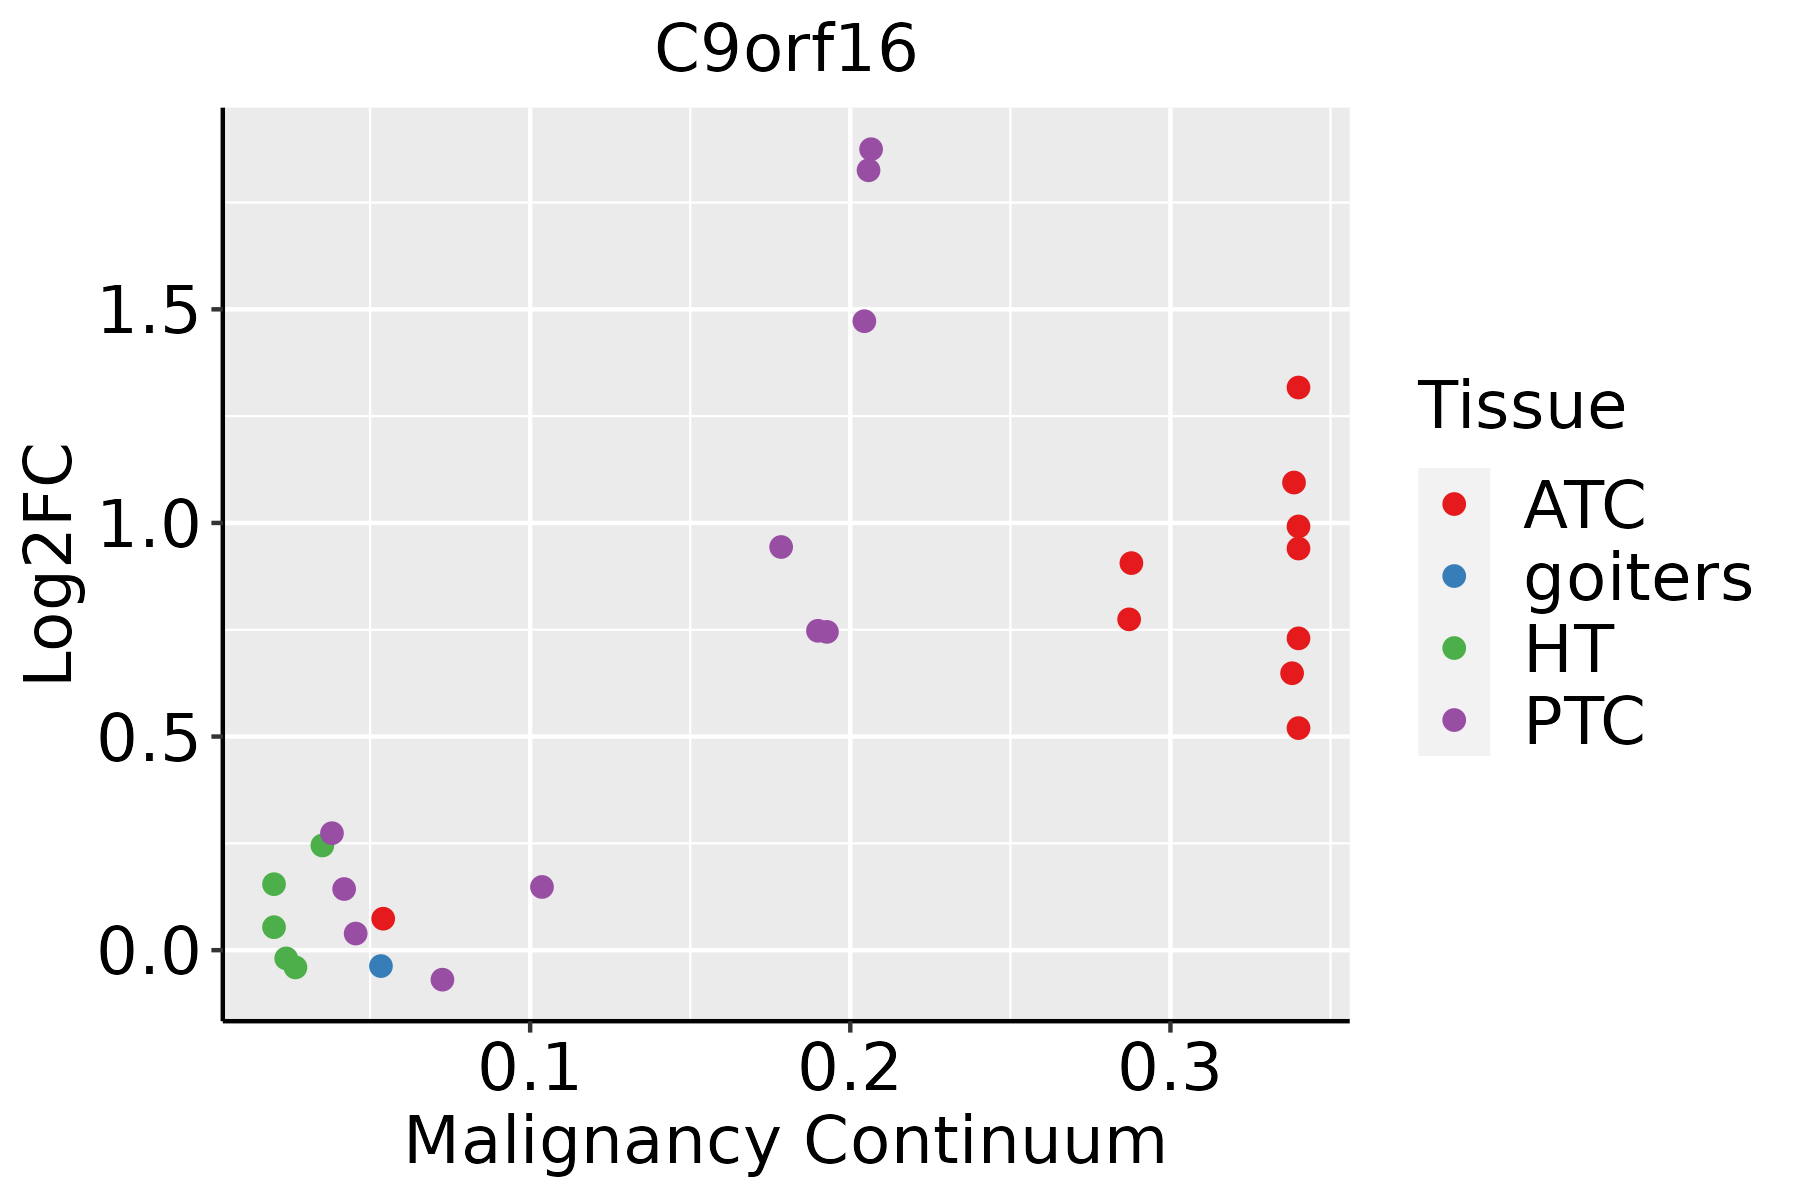 | ATC: Anaplastic thyroid cancer |
| HT: Hashimoto's thyroiditis | ||
| PTC: Papillary thyroid cancer |
| ∗log2FC in expression of this searched gene in stem-like cells from each diseased tissue sample relative to stem-like cells in normal samples in each tissue plotted against the malignancy continuum. Samples are colored based on if they are from different disease stage. |
Top |
Malignant transformation related pathway analysis |
| Find out the enriched GO biological processes and KEGG pathways involved in transition from healthy to precancer to cancer |
| Tissue | Disease Stage | Enriched GO biological Processes |
| Colorectum | AD |  |
| Colorectum | SER |  |
| Colorectum | MSS |  |
| Colorectum | MSI-H |  |
| Colorectum | FAP |  |
| ∗Top 15 enriched GO BP terms are showed in the bar plot of each disease state in each tissue. Each row represents a significant GO biological process which is colored according to the -log10(p.adjust). |
| Page: 1 2 3 4 5 6 7 8 9 |
| GO ID | Tissue | Disease Stage | Description | Gene Ratio | Bg Ratio | pvalue | p.adjust | Count |
| Page: 1 |
| Pathway ID | Tissue | Disease Stage | Description | Gene Ratio | Bg Ratio | pvalue | p.adjust | qvalue | Count |
| Page: 1 |
Top |
Cell-cell communication analysis |
| Identification of potential cell-cell interactions between two cell types and their ligand-receptor pairs for different disease states |
| Ligand | Receptor | LRpair | Pathway | Tissue | Disease Stage |
| Page: 1 |
Top |
Single-cell gene regulatory network inference analysis |
| Find out the significant the regulons (TFs) and the target genes of each regulon across cell types for different disease states |
| TF | Cell Type | Tissue | Disease Stage | Target Gene | RSS | Regulon Activity |
| ∗The dot plots of a searched regulon are shown for all cell subpopulations in each disease state of each tissue based on the regulon specific score inferred using pySCENIC and by calculating the average expression. |
| Page: 1 |
Top |
Somatic mutation of malignant transformation related genes |
| Annotation of somatic variants for genes involved in malignant transformation |
| Hugo Symbol | Variant Class | Variant Classification | dbSNP RS | HGVSc | HGVSp | HGVSp Short | SWISSPROT | BIOTYPE | SIFT | PolyPhen | Tumor Sample Barcode | Tissue | Histology | Sex | Age | Stage | Therapy Types | Drugs | Outcome |
| C9orf16 | SNV | Missense_Mutation | c.210N>A | p.Phe70Leu | p.F70L | Q9BUW7 | protein_coding | tolerated(0.15) | possibly_damaging(0.77) | TCGA-AD-6895-01 | Colorectum | colon adenocarcinoma | Male | >=65 | III/IV | Unknown | Unknown | SD | |
| C9orf16 | SNV | Missense_Mutation | novel | c.163C>A | p.Arg55Ser | p.R55S | Q9BUW7 | protein_coding | tolerated(0.07) | benign(0.297) | TCGA-55-6972-01 | Lung | lung adenocarcinoma | Male | >=65 | I/II | Unknown | Unknown | SD |
| Page: 1 |
Top |
Related drugs of malignant transformation related genes |
| Identification of chemicals and drugs interact with genes involved in malignant transfromation |
| (DGIdb 4.0) |
| Entrez ID | Symbol | Category | Interaction Types | Drug Claim Name | Drug Name | PMIDs |
| Page: 1 |

Copyright 2023-Present -The University of Texas Health Science Center at Houston |