
|
|||||
|
 | |
| |
| |
| |
| |
| |
|
Gene: BRD2 |
Gene summary for BRD2 |
| Gene information | Species | Human | Gene symbol | BRD2 | Gene ID | 6046 |
| Gene name | bromodomain containing 2 | |
| Gene Alias | BRD2-IT1 | |
| Cytomap | 6p21.32 | |
| Gene Type | protein-coding | GO ID | GO:0000003 | UniProtAcc | A0A024RCR5 |
Top |
Malignant transformation analysis |
| Identification of the aberrant gene expression in precancerous and cancerous lesions by comparing the gene expression of stem-like cells in diseased tissues with normal stem cells |
| Entrez ID | Symbol | Replicates | Species | Organ | Tissue | Adj P-value | Log2FC | Malignancy |
| 6046 | BRD2 | P42T-E | Human | Esophagus | ESCC | 8.49e-38 | 1.97e+00 | 0.1175 |
| 6046 | BRD2 | P44T-E | Human | Esophagus | ESCC | 1.33e-10 | 9.96e-01 | 0.1096 |
| 6046 | BRD2 | P47T-E | Human | Esophagus | ESCC | 1.75e-43 | 1.54e+00 | 0.1067 |
| 6046 | BRD2 | P48T-E | Human | Esophagus | ESCC | 1.09e-51 | 1.66e+00 | 0.0959 |
| 6046 | BRD2 | P49T-E | Human | Esophagus | ESCC | 1.52e-14 | 2.81e+00 | 0.1768 |
| 6046 | BRD2 | P52T-E | Human | Esophagus | ESCC | 1.44e-46 | 1.65e+00 | 0.1555 |
| 6046 | BRD2 | P54T-E | Human | Esophagus | ESCC | 1.39e-69 | 2.50e+00 | 0.0975 |
| 6046 | BRD2 | P56T-E | Human | Esophagus | ESCC | 2.00e-17 | 2.80e+00 | 0.1613 |
| 6046 | BRD2 | P57T-E | Human | Esophagus | ESCC | 5.52e-29 | 1.32e+00 | 0.0926 |
| 6046 | BRD2 | P61T-E | Human | Esophagus | ESCC | 3.13e-51 | 2.24e+00 | 0.099 |
| 6046 | BRD2 | P62T-E | Human | Esophagus | ESCC | 2.63e-98 | 2.73e+00 | 0.1302 |
| 6046 | BRD2 | P65T-E | Human | Esophagus | ESCC | 7.88e-55 | 2.01e+00 | 0.0978 |
| 6046 | BRD2 | P74T-E | Human | Esophagus | ESCC | 1.62e-37 | 1.85e+00 | 0.1479 |
| 6046 | BRD2 | P75T-E | Human | Esophagus | ESCC | 3.47e-78 | 2.67e+00 | 0.1125 |
| 6046 | BRD2 | P76T-E | Human | Esophagus | ESCC | 2.34e-36 | 1.31e+00 | 0.1207 |
| 6046 | BRD2 | P79T-E | Human | Esophagus | ESCC | 1.40e-53 | 1.56e+00 | 0.1154 |
| 6046 | BRD2 | P80T-E | Human | Esophagus | ESCC | 3.23e-67 | 3.86e+00 | 0.155 |
| 6046 | BRD2 | P82T-E | Human | Esophagus | ESCC | 9.05e-16 | 1.58e+00 | 0.1072 |
| 6046 | BRD2 | P83T-E | Human | Esophagus | ESCC | 1.76e-27 | 1.38e+00 | 0.1738 |
| 6046 | BRD2 | P84T-E | Human | Esophagus | ESCC | 1.79e-18 | 1.89e+00 | 0.0933 |
| Page: 1 2 3 4 5 6 7 8 9 10 11 12 |
| Tissue | Expression Dynamics | Abbreviation |
| Breast |  | IDC: Invasive ductal carcinoma |
| DCIS: Ductal carcinoma in situ | ||
| Precancer(BRCA1-mut): Precancerous lesion from BRCA1 mutation carriers | ||
| Colorectum (GSE201348) |  | FAP: Familial adenomatous polyposis |
| CRC: Colorectal cancer | ||
| Colorectum (HTA11) |  | AD: Adenomas |
| SER: Sessile serrated lesions | ||
| MSI-H: Microsatellite-high colorectal cancer | ||
| MSS: Microsatellite stable colorectal cancer | ||
| Endometrium | 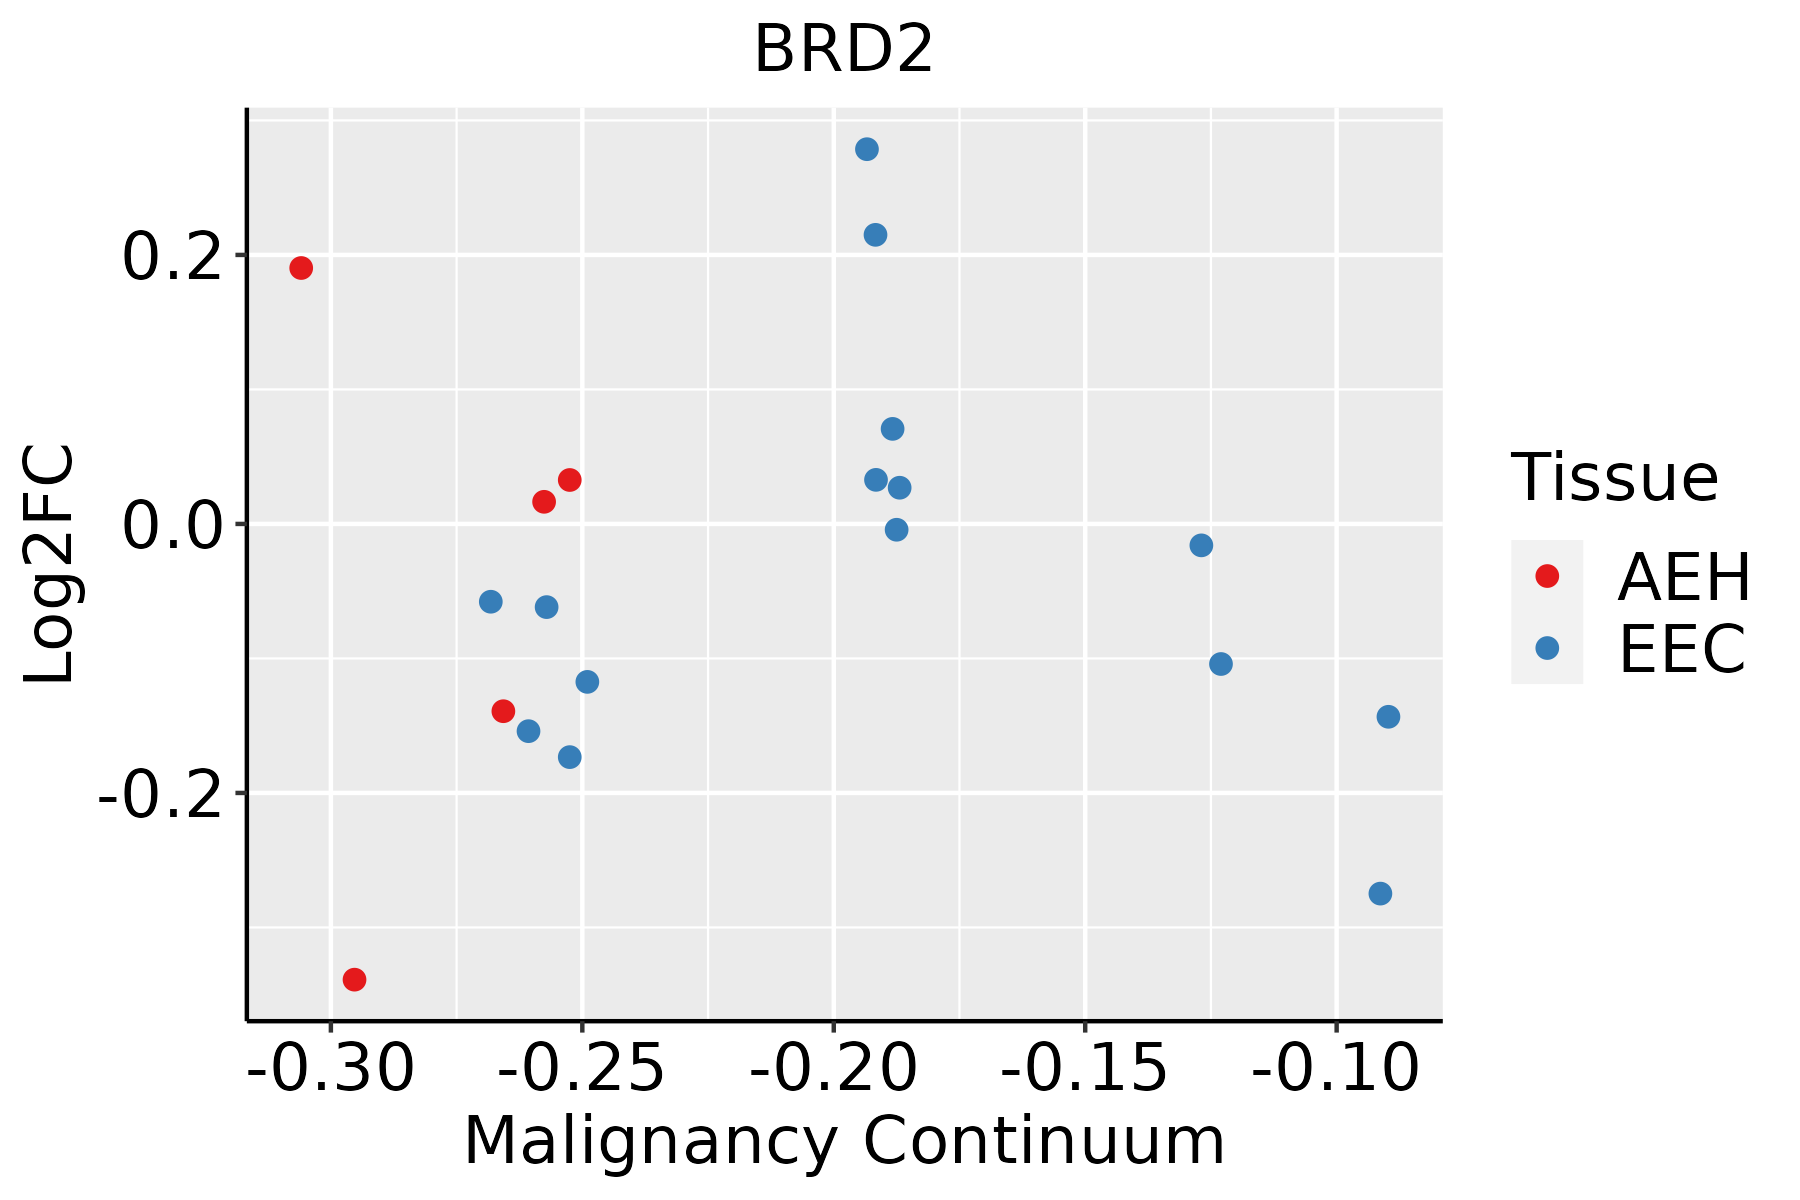 | AEH: Atypical endometrial hyperplasia |
| EEC: Endometrioid Cancer | ||
| Esophagus | 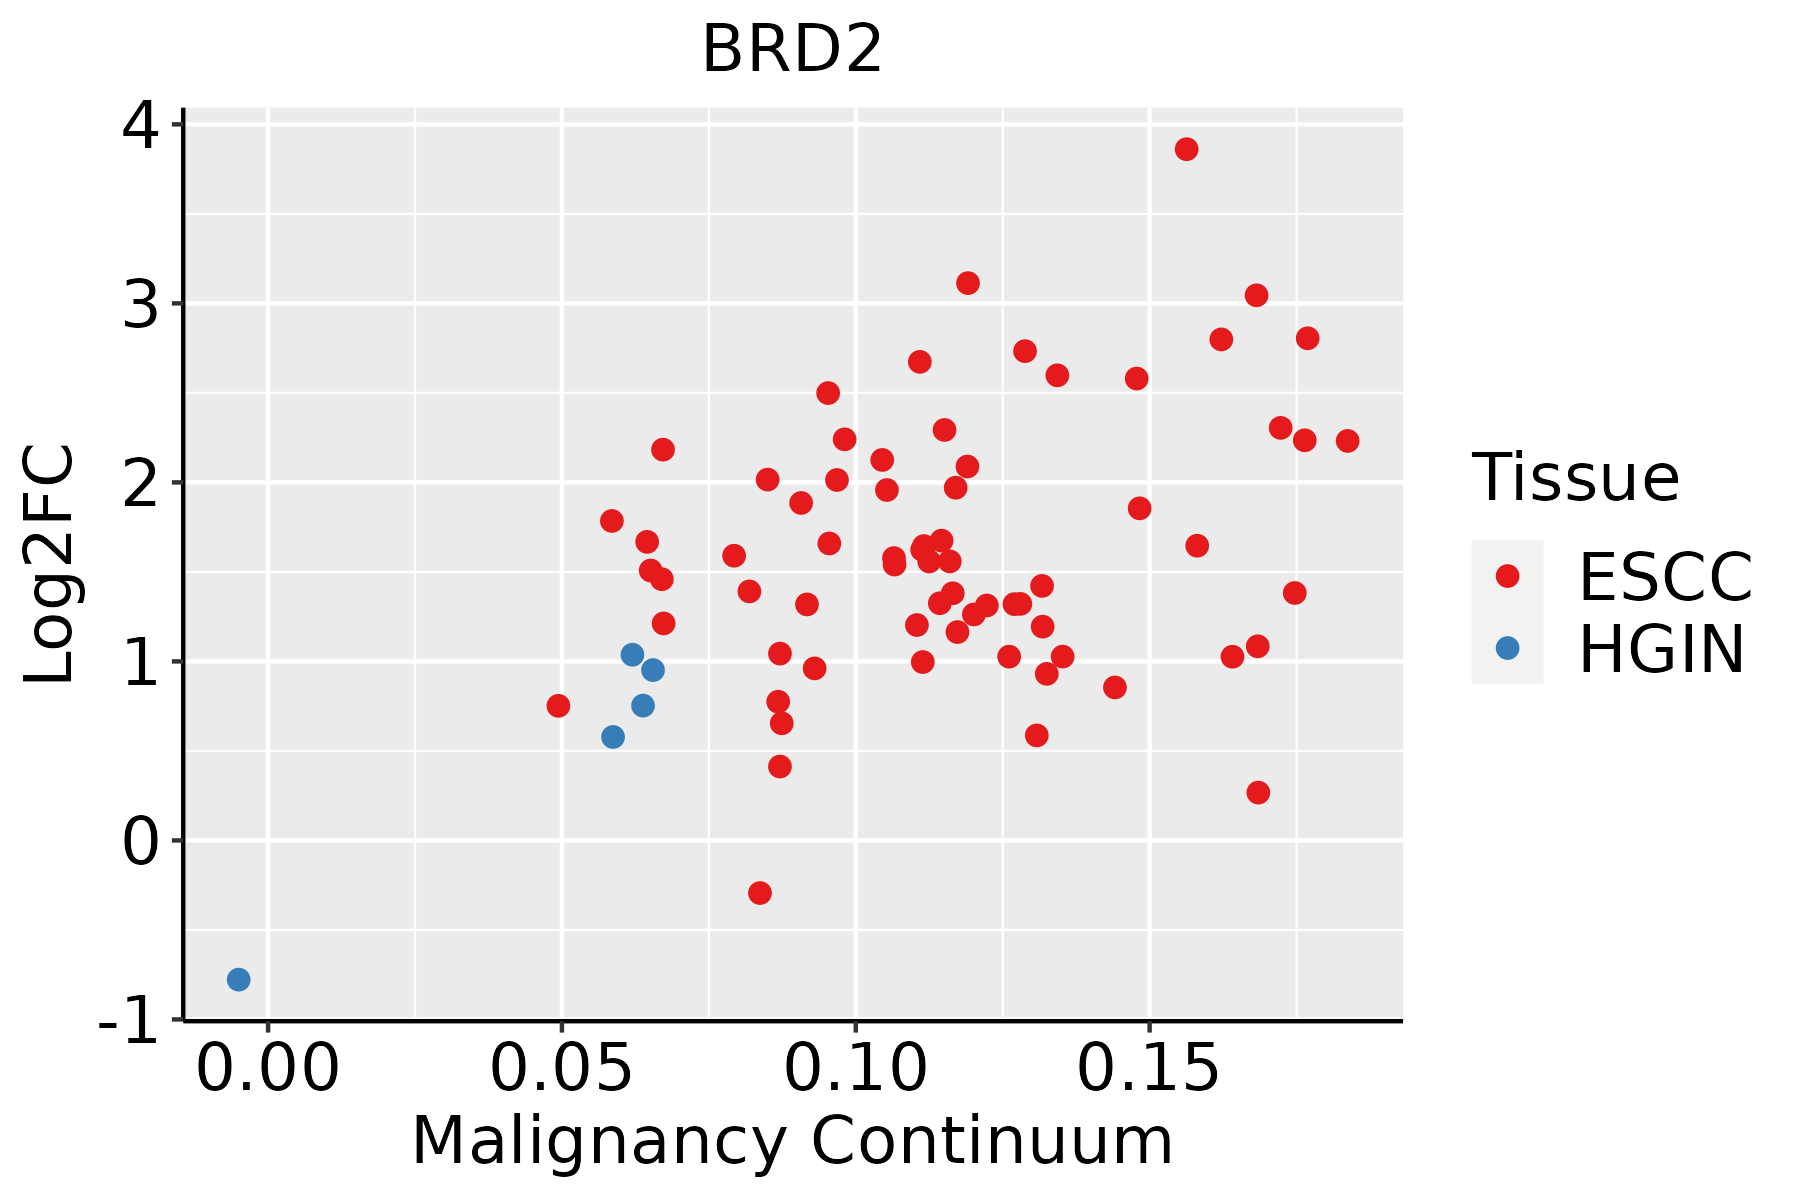 | ESCC: Esophageal squamous cell carcinoma |
| HGIN: High-grade intraepithelial neoplasias | ||
| LGIN: Low-grade intraepithelial neoplasias | ||
| Liver | 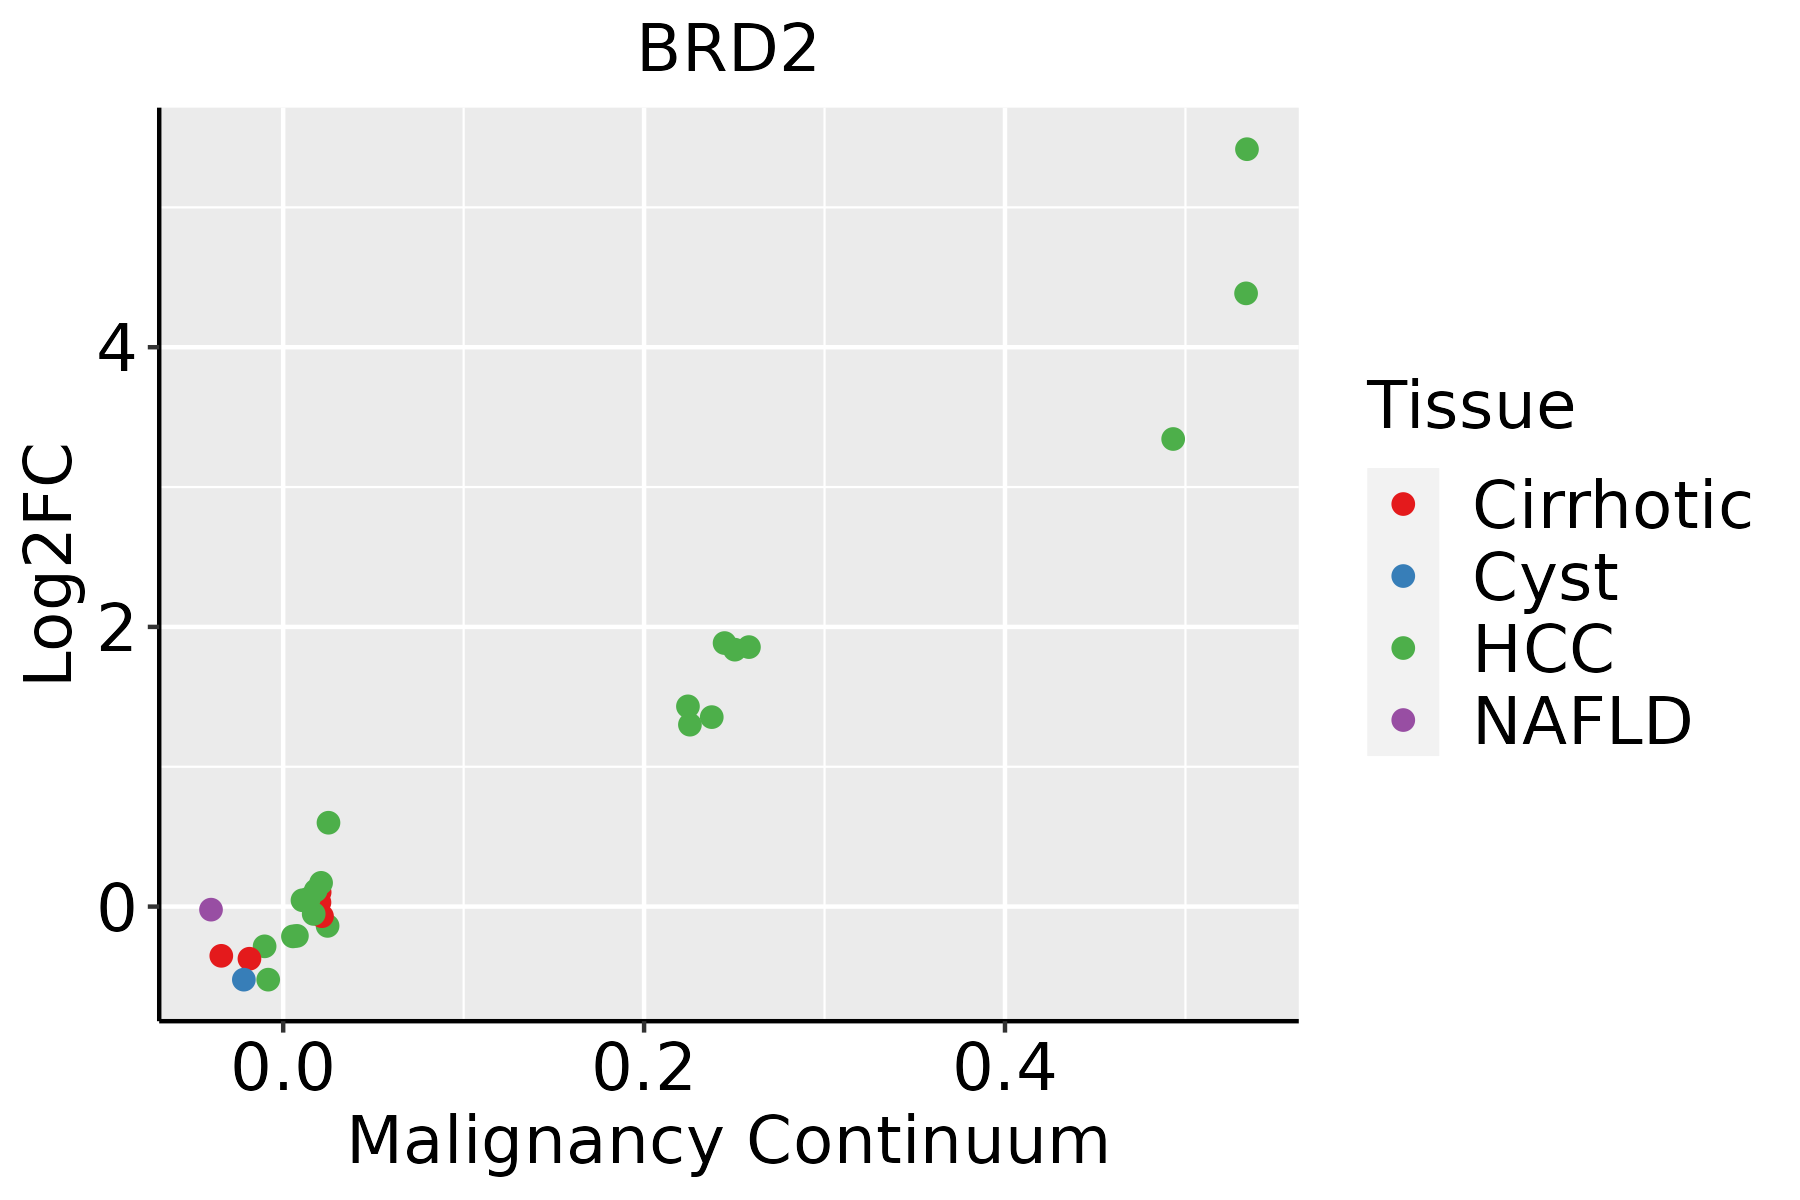 | HCC: Hepatocellular carcinoma |
| NAFLD: Non-alcoholic fatty liver disease | ||
| Lung |  | AAH: Atypical adenomatous hyperplasia |
| AIS: Adenocarcinoma in situ | ||
| IAC: Invasive lung adenocarcinoma | ||
| MIA: Minimally invasive adenocarcinoma | ||
| Oral Cavity | 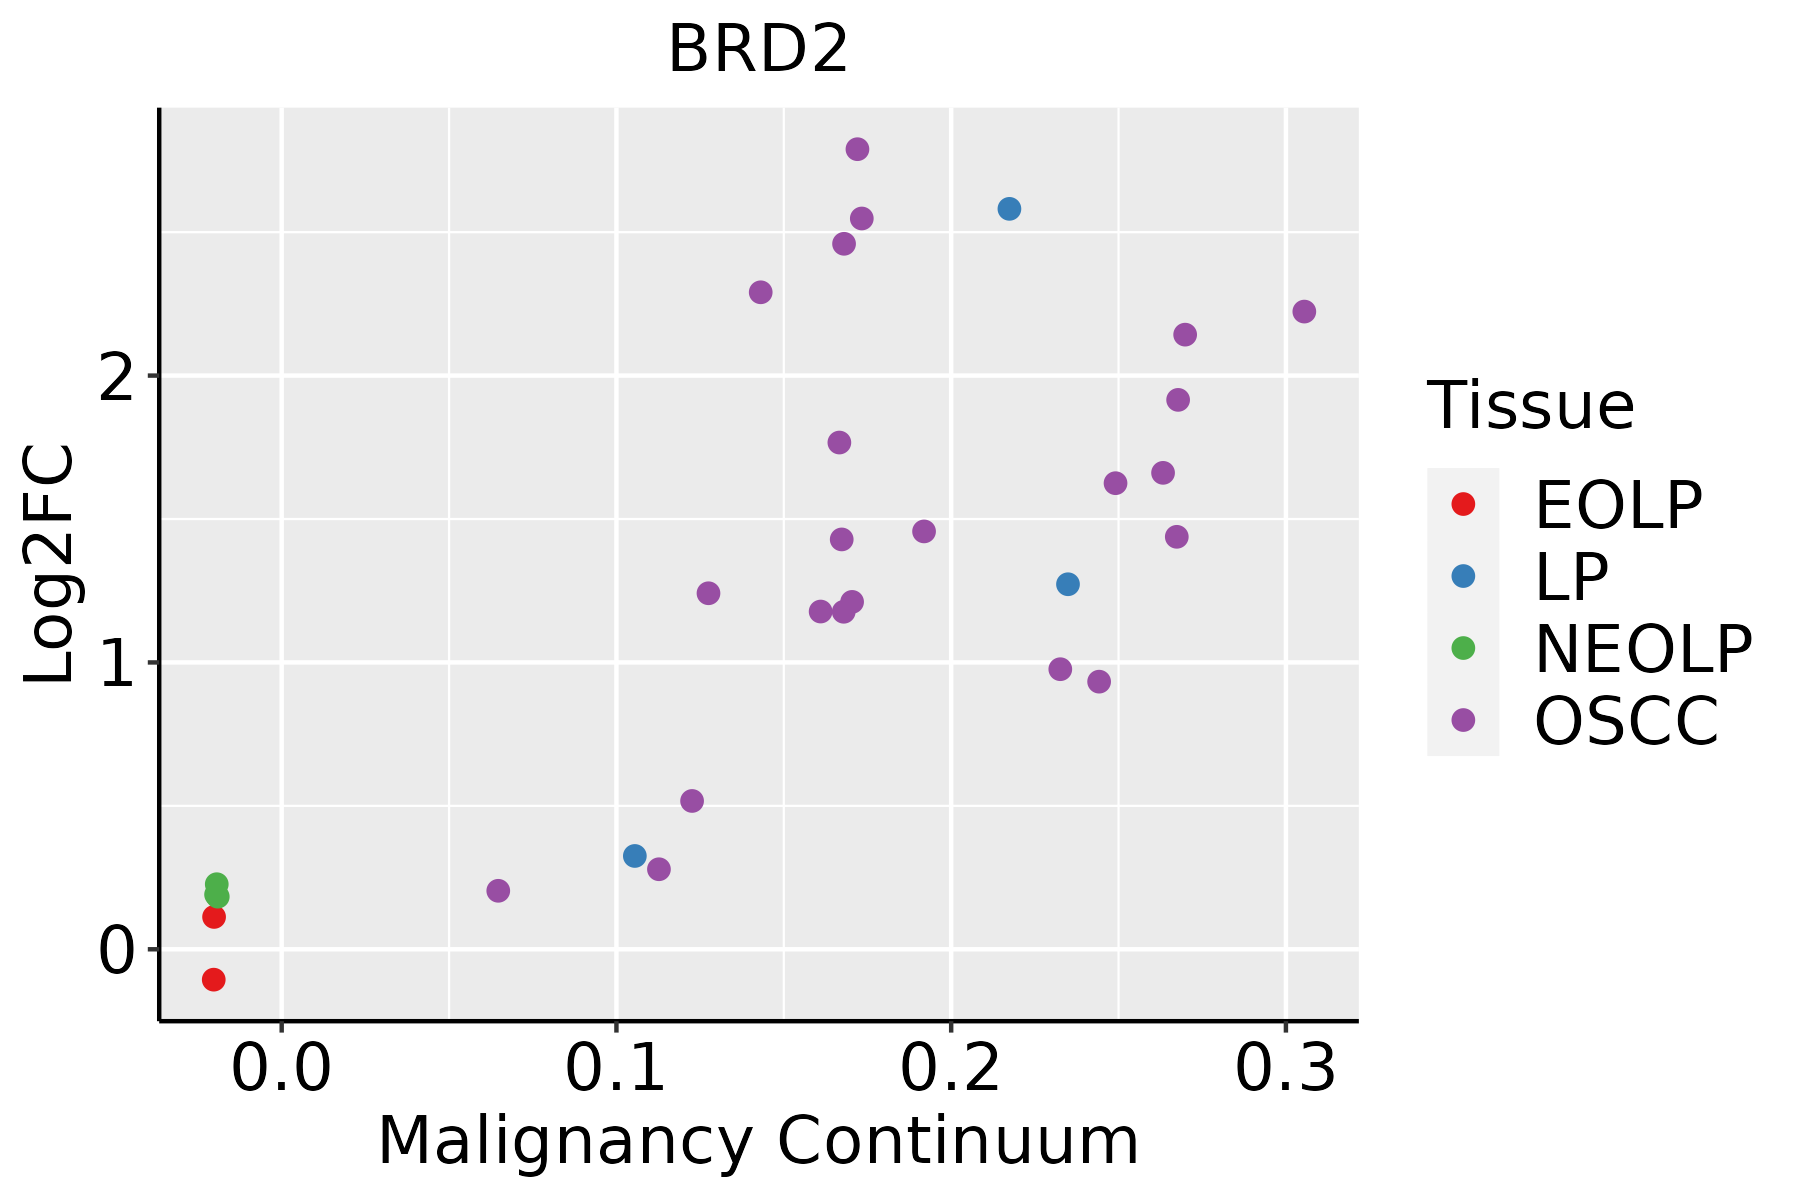 | EOLP: Erosive Oral lichen planus |
| LP: leukoplakia | ||
| NEOLP: Non-erosive oral lichen planus | ||
| OSCC: Oral squamous cell carcinoma | ||
| Prostate |  | BPH: Benign Prostatic Hyperplasia |
| Skin |  | AK: Actinic keratosis |
| cSCC: Cutaneous squamous cell carcinoma | ||
| SCCIS:squamous cell carcinoma in situ | ||
| Thyroid | 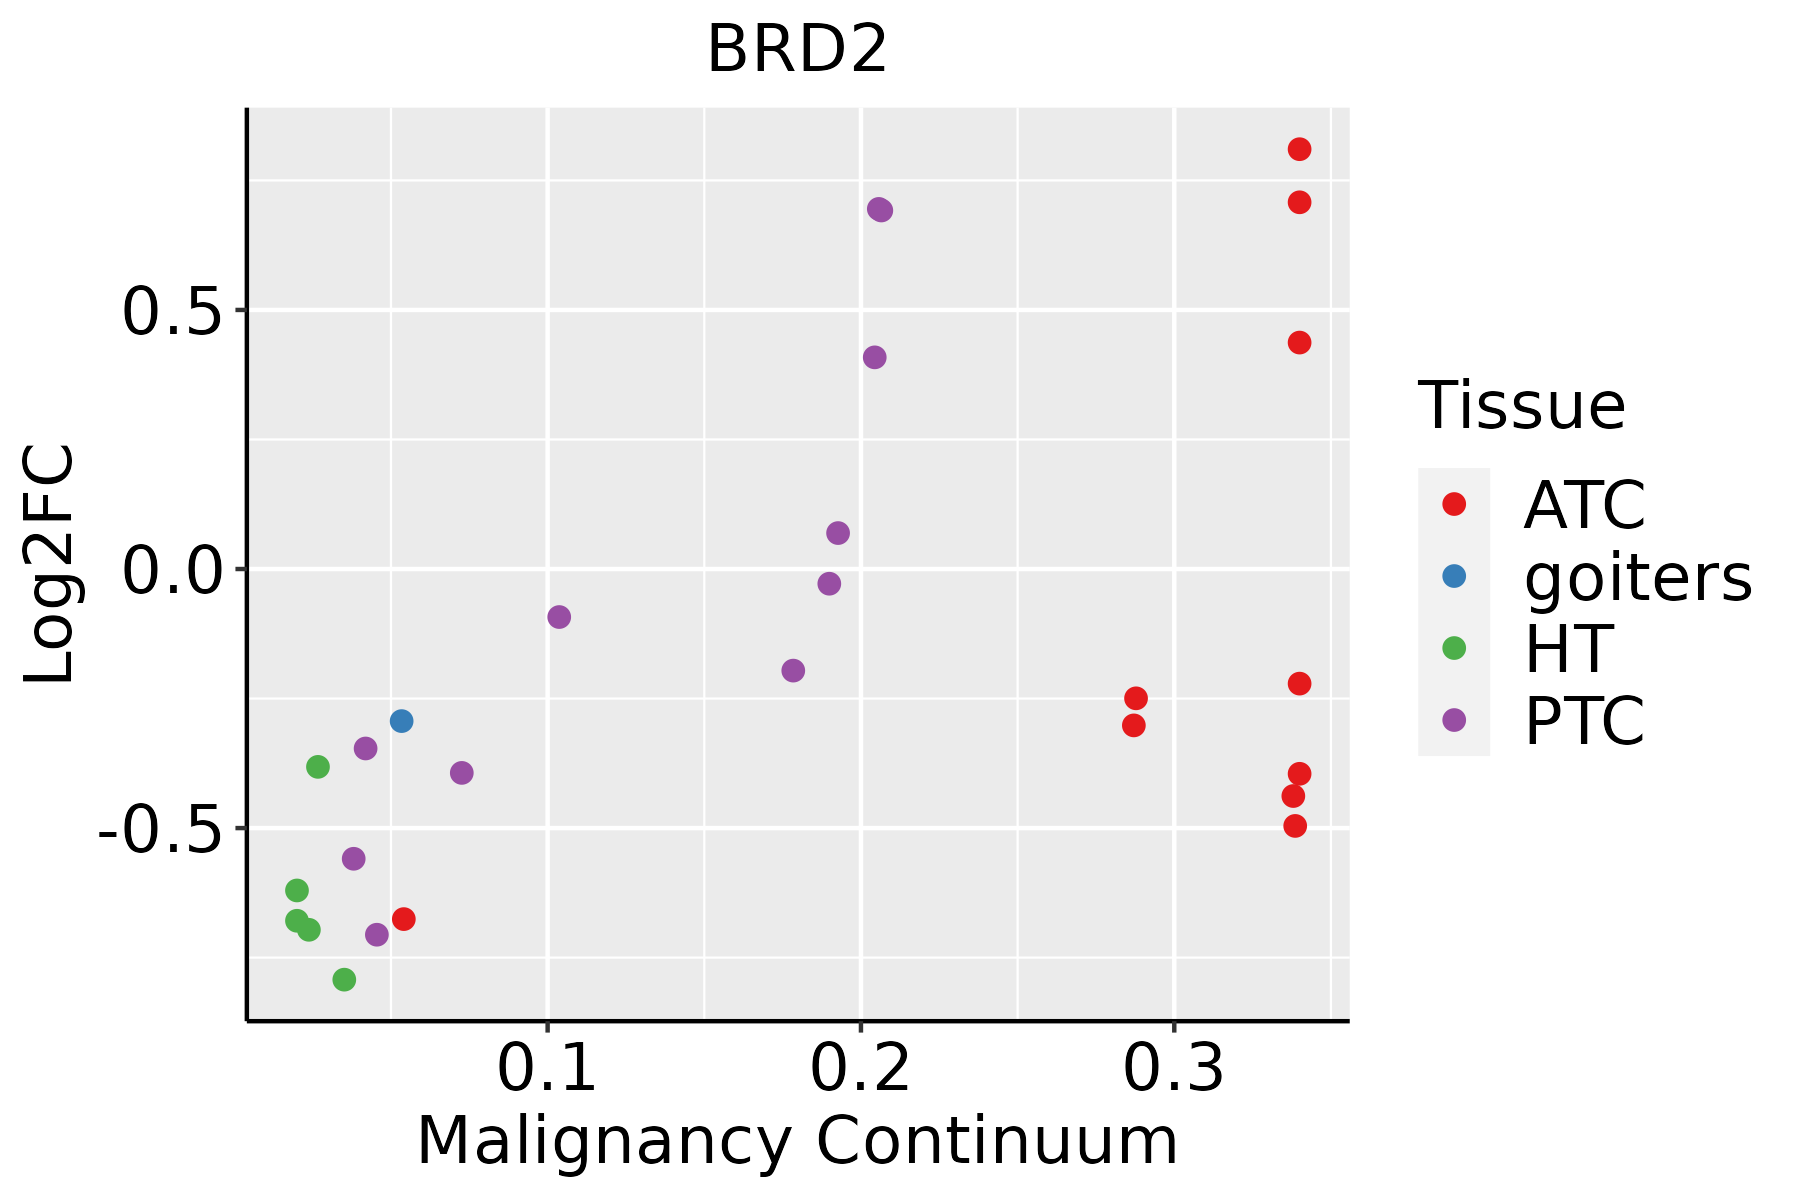 | ATC: Anaplastic thyroid cancer |
| HT: Hashimoto's thyroiditis | ||
| PTC: Papillary thyroid cancer |
| ∗log2FC in expression of this searched gene in stem-like cells from each diseased tissue sample relative to stem-like cells in normal samples in each tissue plotted against the malignancy continuum. Samples are colored based on if they are from different disease stage. |
Top |
Malignant transformation related pathway analysis |
| Find out the enriched GO biological processes and KEGG pathways involved in transition from healthy to precancer to cancer |
| Tissue | Disease Stage | Enriched GO biological Processes |
| Colorectum | AD |  |
| Colorectum | SER |  |
| Colorectum | MSS |  |
| Colorectum | MSI-H |  |
| Colorectum | FAP |  |
| ∗Top 15 enriched GO BP terms are showed in the bar plot of each disease state in each tissue. Each row represents a significant GO biological process which is colored according to the -log10(p.adjust). |
| Page: 1 2 3 4 5 6 7 8 9 |
| GO ID | Tissue | Disease Stage | Description | Gene Ratio | Bg Ratio | pvalue | p.adjust | Count |
| GO:00351486 | Breast | Precancer | tube formation | 19/1080 | 148/18723 | 8.79e-04 | 1.01e-02 | 19 |
| GO:00018386 | Breast | Precancer | embryonic epithelial tube formation | 15/1080 | 121/18723 | 4.12e-03 | 3.24e-02 | 15 |
| GO:00605625 | Breast | Precancer | epithelial tube morphogenesis | 31/1080 | 325/18723 | 4.21e-03 | 3.31e-02 | 31 |
| GO:006056212 | Breast | IDC | epithelial tube morphogenesis | 44/1434 | 325/18723 | 1.58e-04 | 2.73e-03 | 44 |
| GO:003514812 | Breast | IDC | tube formation | 23/1434 | 148/18723 | 8.79e-04 | 1.02e-02 | 23 |
| GO:000183812 | Breast | IDC | embryonic epithelial tube formation | 19/1434 | 121/18723 | 2.10e-03 | 1.97e-02 | 19 |
| GO:00721756 | Breast | IDC | epithelial tube formation | 19/1434 | 132/18723 | 5.63e-03 | 4.08e-02 | 19 |
| GO:006056221 | Breast | DCIS | epithelial tube morphogenesis | 41/1390 | 325/18723 | 5.98e-04 | 7.60e-03 | 41 |
| GO:003514821 | Breast | DCIS | tube formation | 21/1390 | 148/18723 | 3.08e-03 | 2.62e-02 | 21 |
| GO:000183821 | Breast | DCIS | embryonic epithelial tube formation | 18/1390 | 121/18723 | 3.54e-03 | 2.92e-02 | 18 |
| GO:0006325 | Colorectum | AD | chromatin organization | 119/3918 | 409/18723 | 4.85e-05 | 8.33e-04 | 119 |
| GO:0060562 | Colorectum | AD | epithelial tube morphogenesis | 93/3918 | 325/18723 | 5.65e-04 | 6.00e-03 | 93 |
| GO:0014020 | Colorectum | AD | primary neural tube formation | 33/3918 | 94/18723 | 1.02e-03 | 9.50e-03 | 33 |
| GO:0001841 | Colorectum | AD | neural tube formation | 35/3918 | 102/18723 | 1.16e-03 | 1.05e-02 | 35 |
| GO:0001843 | Colorectum | AD | neural tube closure | 30/3918 | 88/18723 | 2.83e-03 | 2.12e-02 | 30 |
| GO:0060606 | Colorectum | AD | tube closure | 30/3918 | 89/18723 | 3.42e-03 | 2.49e-02 | 30 |
| GO:0035148 | Colorectum | AD | tube formation | 45/3918 | 148/18723 | 4.13e-03 | 2.87e-02 | 45 |
| GO:0001838 | Colorectum | AD | embryonic epithelial tube formation | 38/3918 | 121/18723 | 4.40e-03 | 3.01e-02 | 38 |
| GO:0072175 | Colorectum | AD | epithelial tube formation | 40/3918 | 132/18723 | 6.98e-03 | 4.29e-02 | 40 |
| GO:0021915 | Colorectum | AD | neural tube development | 45/3918 | 152/18723 | 7.05e-03 | 4.31e-02 | 45 |
| Page: 1 2 3 4 5 6 7 8 9 |
| Pathway ID | Tissue | Disease Stage | Description | Gene Ratio | Bg Ratio | pvalue | p.adjust | qvalue | Count |
| Page: 1 |
Top |
Cell-cell communication analysis |
| Identification of potential cell-cell interactions between two cell types and their ligand-receptor pairs for different disease states |
| Ligand | Receptor | LRpair | Pathway | Tissue | Disease Stage |
| Page: 1 |
Top |
Single-cell gene regulatory network inference analysis |
| Find out the significant the regulons (TFs) and the target genes of each regulon across cell types for different disease states |
| TF | Cell Type | Tissue | Disease Stage | Target Gene | RSS | Regulon Activity |
| ∗The dot plots of a searched regulon are shown for all cell subpopulations in each disease state of each tissue based on the regulon specific score inferred using pySCENIC and by calculating the average expression. |
| Page: 1 |
Top |
Somatic mutation of malignant transformation related genes |
| Annotation of somatic variants for genes involved in malignant transformation |
| Hugo Symbol | Variant Class | Variant Classification | dbSNP RS | HGVSc | HGVSp | HGVSp Short | SWISSPROT | BIOTYPE | SIFT | PolyPhen | Tumor Sample Barcode | Tissue | Histology | Sex | Age | Stage | Therapy Types | Drugs | Outcome |
| BRD2 | SNV | Missense_Mutation | novel | c.2348N>G | p.Asn783Ser | p.N783S | P25440 | protein_coding | tolerated(0.08) | probably_damaging(0.97) | TCGA-E9-A3QA-01 | Breast | breast invasive carcinoma | Female | <65 | I/II | Unknown | Unknown | SD |
| BRD2 | insertion | Nonsense_Mutation | novel | c.2480_2481insCTGATAAAT | p.Ser827_Ser828insTer | p.S827_S828ins* | P25440 | protein_coding | TCGA-A8-A09X-01 | Breast | breast invasive carcinoma | Female | <65 | III/IV | Unknown | Unknown | SD | ||
| BRD2 | deletion | Frame_Shift_Del | novel | c.184_185delCC | p.Pro62ThrfsTer65 | p.P62Tfs*65 | P25440 | protein_coding | TCGA-E9-A3HO-01 | Breast | breast invasive carcinoma | Female | <65 | I/II | Chemotherapy | cyclophosphamide | CR | ||
| BRD2 | SNV | Missense_Mutation | novel | c.1556G>A | p.Arg519His | p.R519H | P25440 | protein_coding | tolerated(0.06) | possibly_damaging(0.883) | TCGA-2W-A8YY-01 | Cervix | cervical & endocervical cancer | Female | <65 | I/II | Chemotherapy | cisplatin | CR |
| BRD2 | SNV | Missense_Mutation | novel | c.101N>C | p.Arg34Pro | p.R34P | P25440 | protein_coding | deleterious(0) | probably_damaging(0.995) | TCGA-C5-A1MH-01 | Cervix | cervical & endocervical cancer | Female | >=65 | III/IV | Chemotherapy | cisplatin | PD |
| BRD2 | SNV | Missense_Mutation | c.596N>A | p.Gly199Glu | p.G199E | P25440 | protein_coding | tolerated(0.13) | benign(0.316) | TCGA-FU-A3YQ-01 | Cervix | cervical & endocervical cancer | Female | <65 | I/II | Unknown | Unknown | SD | |
| BRD2 | SNV | Missense_Mutation | novel | c.292N>T | p.Pro98Ser | p.P98S | P25440 | protein_coding | deleterious(0) | probably_damaging(1) | TCGA-JW-A5VL-01 | Cervix | cervical & endocervical cancer | Female | <65 | I/II | Unknown | Unknown | SD |
| BRD2 | SNV | Missense_Mutation | novel | c.950G>A | p.Arg317His | p.R317H | P25440 | protein_coding | deleterious(0) | possibly_damaging(0.895) | TCGA-VS-A9UJ-01 | Cervix | cervical & endocervical cancer | Female | <65 | I/II | Unknown | Unknown | PD |
| BRD2 | SNV | Missense_Mutation | c.964N>T | p.Arg322Cys | p.R322C | P25440 | protein_coding | deleterious(0) | probably_damaging(0.995) | TCGA-AA-3821-01 | Colorectum | colon adenocarcinoma | Female | >=65 | I/II | Unknown | Unknown | SD | |
| BRD2 | SNV | Missense_Mutation | c.1444N>G | p.Ser482Gly | p.S482G | P25440 | protein_coding | tolerated(0.32) | benign(0.017) | TCGA-AA-3821-01 | Colorectum | colon adenocarcinoma | Female | >=65 | I/II | Unknown | Unknown | SD |
| Page: 1 2 3 4 5 6 7 |
Top |
Related drugs of malignant transformation related genes |
| Identification of chemicals and drugs interact with genes involved in malignant transfromation |
| (DGIdb 4.0) |
| Entrez ID | Symbol | Category | Interaction Types | Drug Claim Name | Drug Name | PMIDs |
| 6046 | BRD2 | SERINE THREONINE KINASE, KINASE, DRUGGABLE GENOME, ENZYME | TRIAZOLAM | TRIAZOLAM | 22137933 | |
| 6046 | BRD2 | SERINE THREONINE KINASE, KINASE, DRUGGABLE GENOME, ENZYME | Pyrrolo-pyrrolone derivative 1 | |||
| 6046 | BRD2 | SERINE THREONINE KINASE, KINASE, DRUGGABLE GENOME, ENZYME | inhibitor | 187051820 | ||
| 6046 | BRD2 | SERINE THREONINE KINASE, KINASE, DRUGGABLE GENOME, ENZYME | PMID26924192-Compound-102 | |||
| 6046 | BRD2 | SERINE THREONINE KINASE, KINASE, DRUGGABLE GENOME, ENZYME | PMID26924192-Compound-103 | |||
| 6046 | BRD2 | SERINE THREONINE KINASE, KINASE, DRUGGABLE GENOME, ENZYME | inhibitor | 187051816 | CHEMBL2153434 | |
| 6046 | BRD2 | SERINE THREONINE KINASE, KINASE, DRUGGABLE GENOME, ENZYME | OTX-015 | BIRABRESIB | ||
| 6046 | BRD2 | SERINE THREONINE KINASE, KINASE, DRUGGABLE GENOME, ENZYME | ALPRAZOLAM | ALPRAZOLAM | 22137933 | |
| 6046 | BRD2 | SERINE THREONINE KINASE, KINASE, DRUGGABLE GENOME, ENZYME | inhibitor | 187051823 | ||
| 6046 | BRD2 | SERINE THREONINE KINASE, KINASE, DRUGGABLE GENOME, ENZYME | inhibitor | 187051818 |
| Page: 1 2 3 |

Copyright 2023-Present -The University of Texas Health Science Center at Houston |