
|
|||||
|
 | |
| |
| |
| |
| |
| |
|
Gene: BOLA3 |
Gene summary for BOLA3 |
| Gene information | Species | Human | Gene symbol | BOLA3 | Gene ID | 388962 |
| Gene name | bolA family member 3 | |
| Gene Alias | MMDS2 | |
| Cytomap | 2p13.1 | |
| Gene Type | protein-coding | GO ID | GO:0008150 | UniProtAcc | Q53S33 |
Top |
Malignant transformation analysis |
| Identification of the aberrant gene expression in precancerous and cancerous lesions by comparing the gene expression of stem-like cells in diseased tissues with normal stem cells |
| Entrez ID | Symbol | Replicates | Species | Organ | Tissue | Adj P-value | Log2FC | Malignancy |
| 388962 | BOLA3 | S014 | Human | Liver | HCC | 4.37e-38 | 1.42e+00 | 0.2254 |
| 388962 | BOLA3 | S015 | Human | Liver | HCC | 7.67e-21 | 1.57e+00 | 0.2375 |
| 388962 | BOLA3 | S016 | Human | Liver | HCC | 1.97e-29 | 1.30e+00 | 0.2243 |
| 388962 | BOLA3 | S027 | Human | Liver | HCC | 3.14e-06 | 1.07e+00 | 0.2446 |
| 388962 | BOLA3 | S028 | Human | Liver | HCC | 1.21e-12 | 1.30e+00 | 0.2503 |
| 388962 | BOLA3 | S029 | Human | Liver | HCC | 2.37e-14 | 1.30e+00 | 0.2581 |
| 388962 | BOLA3 | C04 | Human | Oral cavity | OSCC | 1.11e-39 | 2.49e+00 | 0.2633 |
| 388962 | BOLA3 | C21 | Human | Oral cavity | OSCC | 2.30e-58 | 2.45e+00 | 0.2678 |
| 388962 | BOLA3 | C30 | Human | Oral cavity | OSCC | 7.55e-54 | 3.26e+00 | 0.3055 |
| 388962 | BOLA3 | C38 | Human | Oral cavity | OSCC | 2.35e-12 | 1.34e+00 | 0.172 |
| 388962 | BOLA3 | C43 | Human | Oral cavity | OSCC | 1.06e-53 | 1.18e+00 | 0.1704 |
| 388962 | BOLA3 | C46 | Human | Oral cavity | OSCC | 2.84e-38 | 1.02e+00 | 0.1673 |
| 388962 | BOLA3 | C51 | Human | Oral cavity | OSCC | 5.83e-18 | 1.32e+00 | 0.2674 |
| 388962 | BOLA3 | C57 | Human | Oral cavity | OSCC | 4.29e-13 | 8.97e-01 | 0.1679 |
| 388962 | BOLA3 | C06 | Human | Oral cavity | OSCC | 4.80e-09 | 1.63e+00 | 0.2699 |
| 388962 | BOLA3 | C07 | Human | Oral cavity | OSCC | 1.29e-06 | 1.51e+00 | 0.2491 |
| 388962 | BOLA3 | C08 | Human | Oral cavity | OSCC | 1.37e-76 | 1.86e+00 | 0.1919 |
| 388962 | BOLA3 | C09 | Human | Oral cavity | OSCC | 4.44e-22 | 8.13e-01 | 0.1431 |
| 388962 | BOLA3 | LN22 | Human | Oral cavity | OSCC | 1.64e-09 | 1.75e+00 | 0.1733 |
| 388962 | BOLA3 | LN46 | Human | Oral cavity | OSCC | 8.48e-14 | 8.89e-01 | 0.1666 |
| Page: 1 2 3 4 5 6 7 8 |
| Tissue | Expression Dynamics | Abbreviation |
| Colorectum (GSE201348) |  | FAP: Familial adenomatous polyposis |
| CRC: Colorectal cancer | ||
| Colorectum (HTA11) | 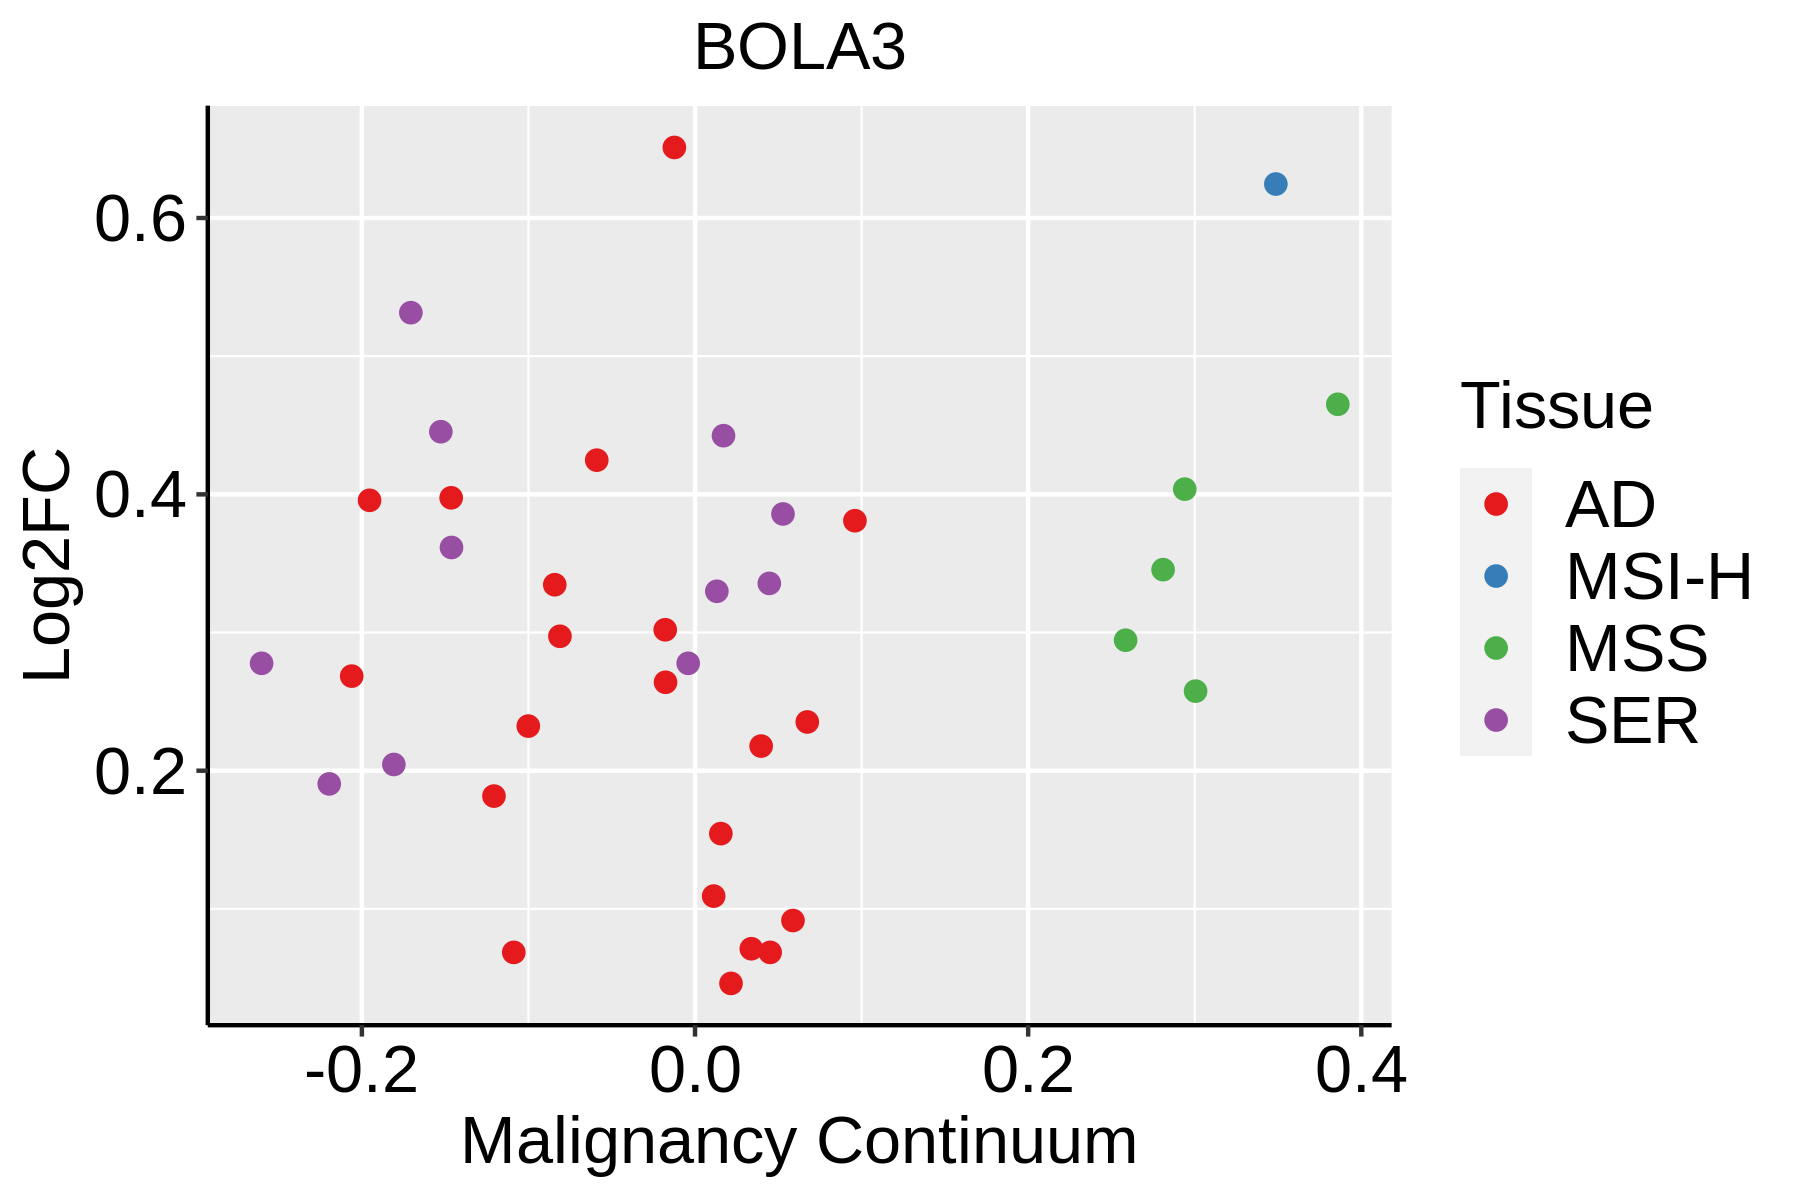 | AD: Adenomas |
| SER: Sessile serrated lesions | ||
| MSI-H: Microsatellite-high colorectal cancer | ||
| MSS: Microsatellite stable colorectal cancer | ||
| Esophagus | 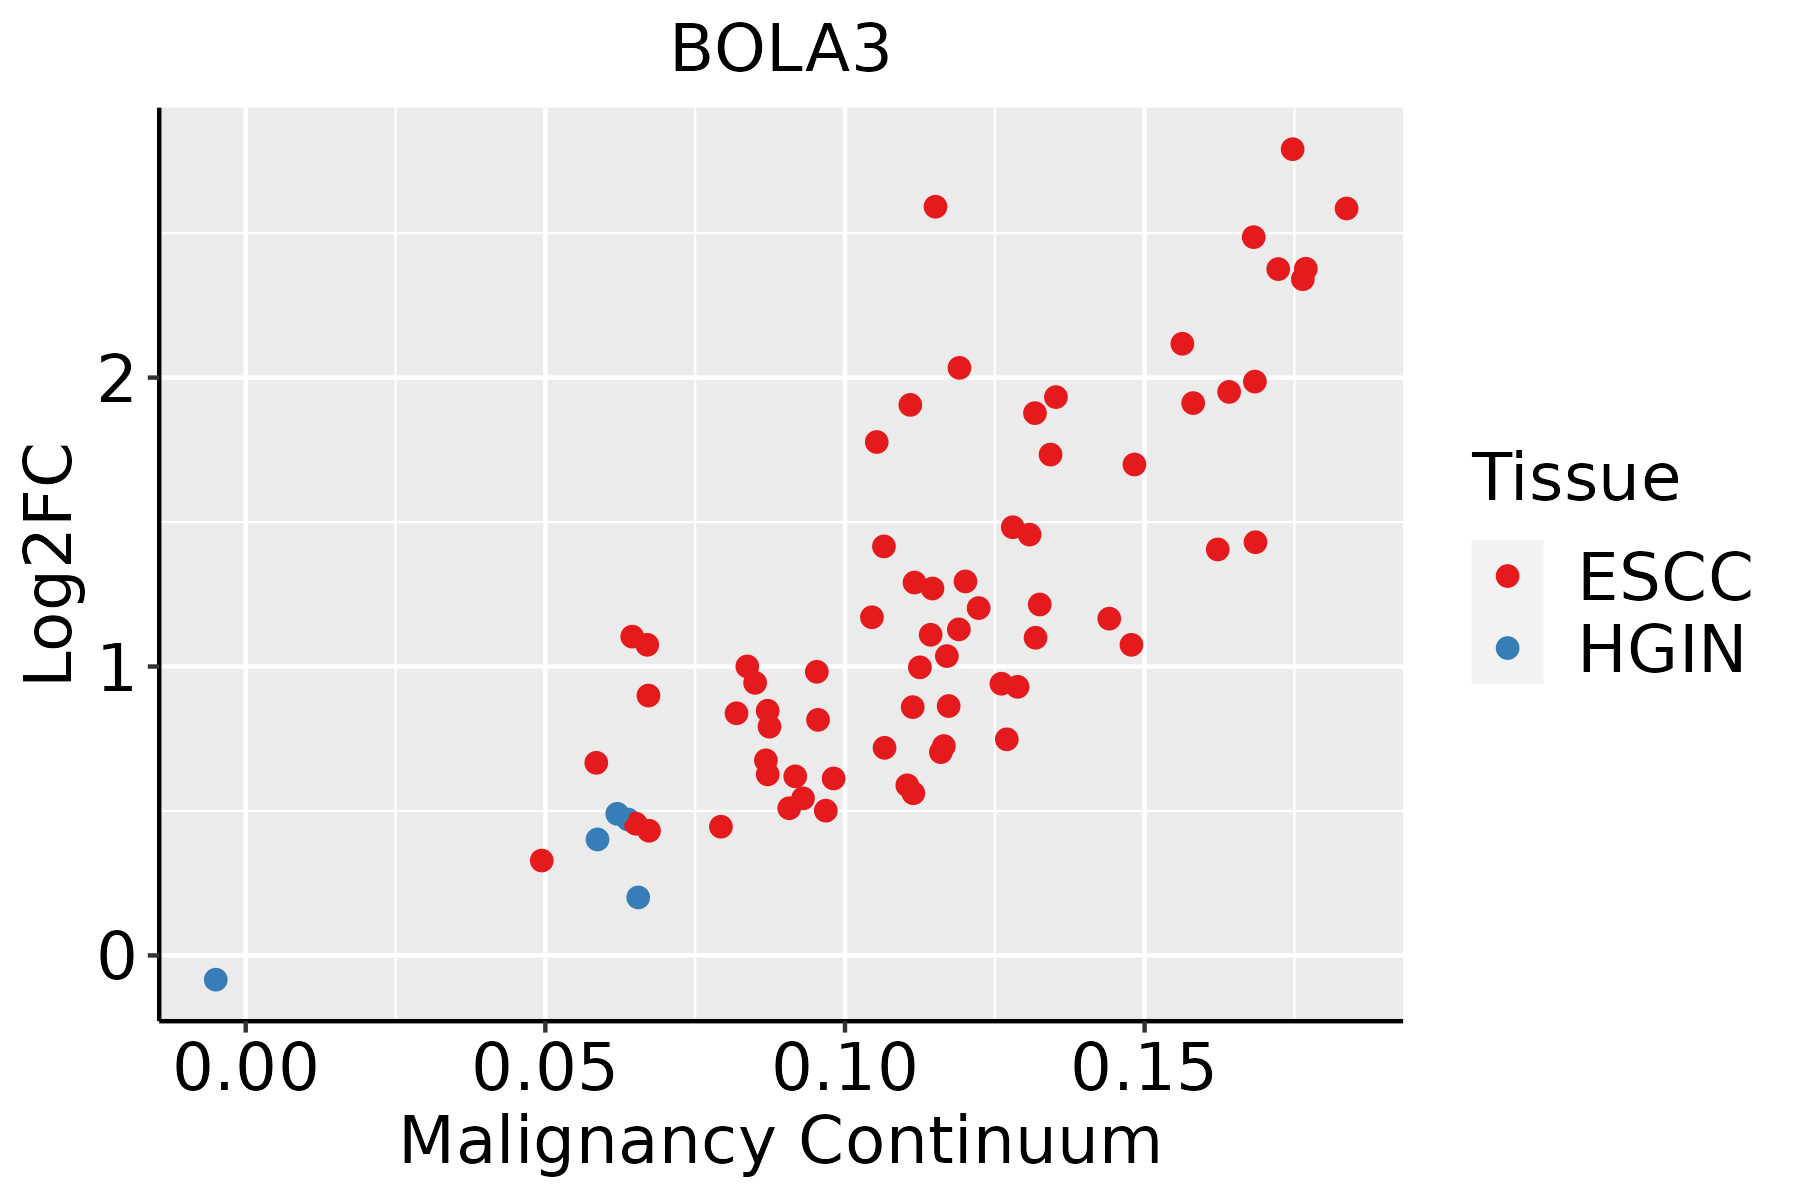 | ESCC: Esophageal squamous cell carcinoma |
| HGIN: High-grade intraepithelial neoplasias | ||
| LGIN: Low-grade intraepithelial neoplasias | ||
| Liver | 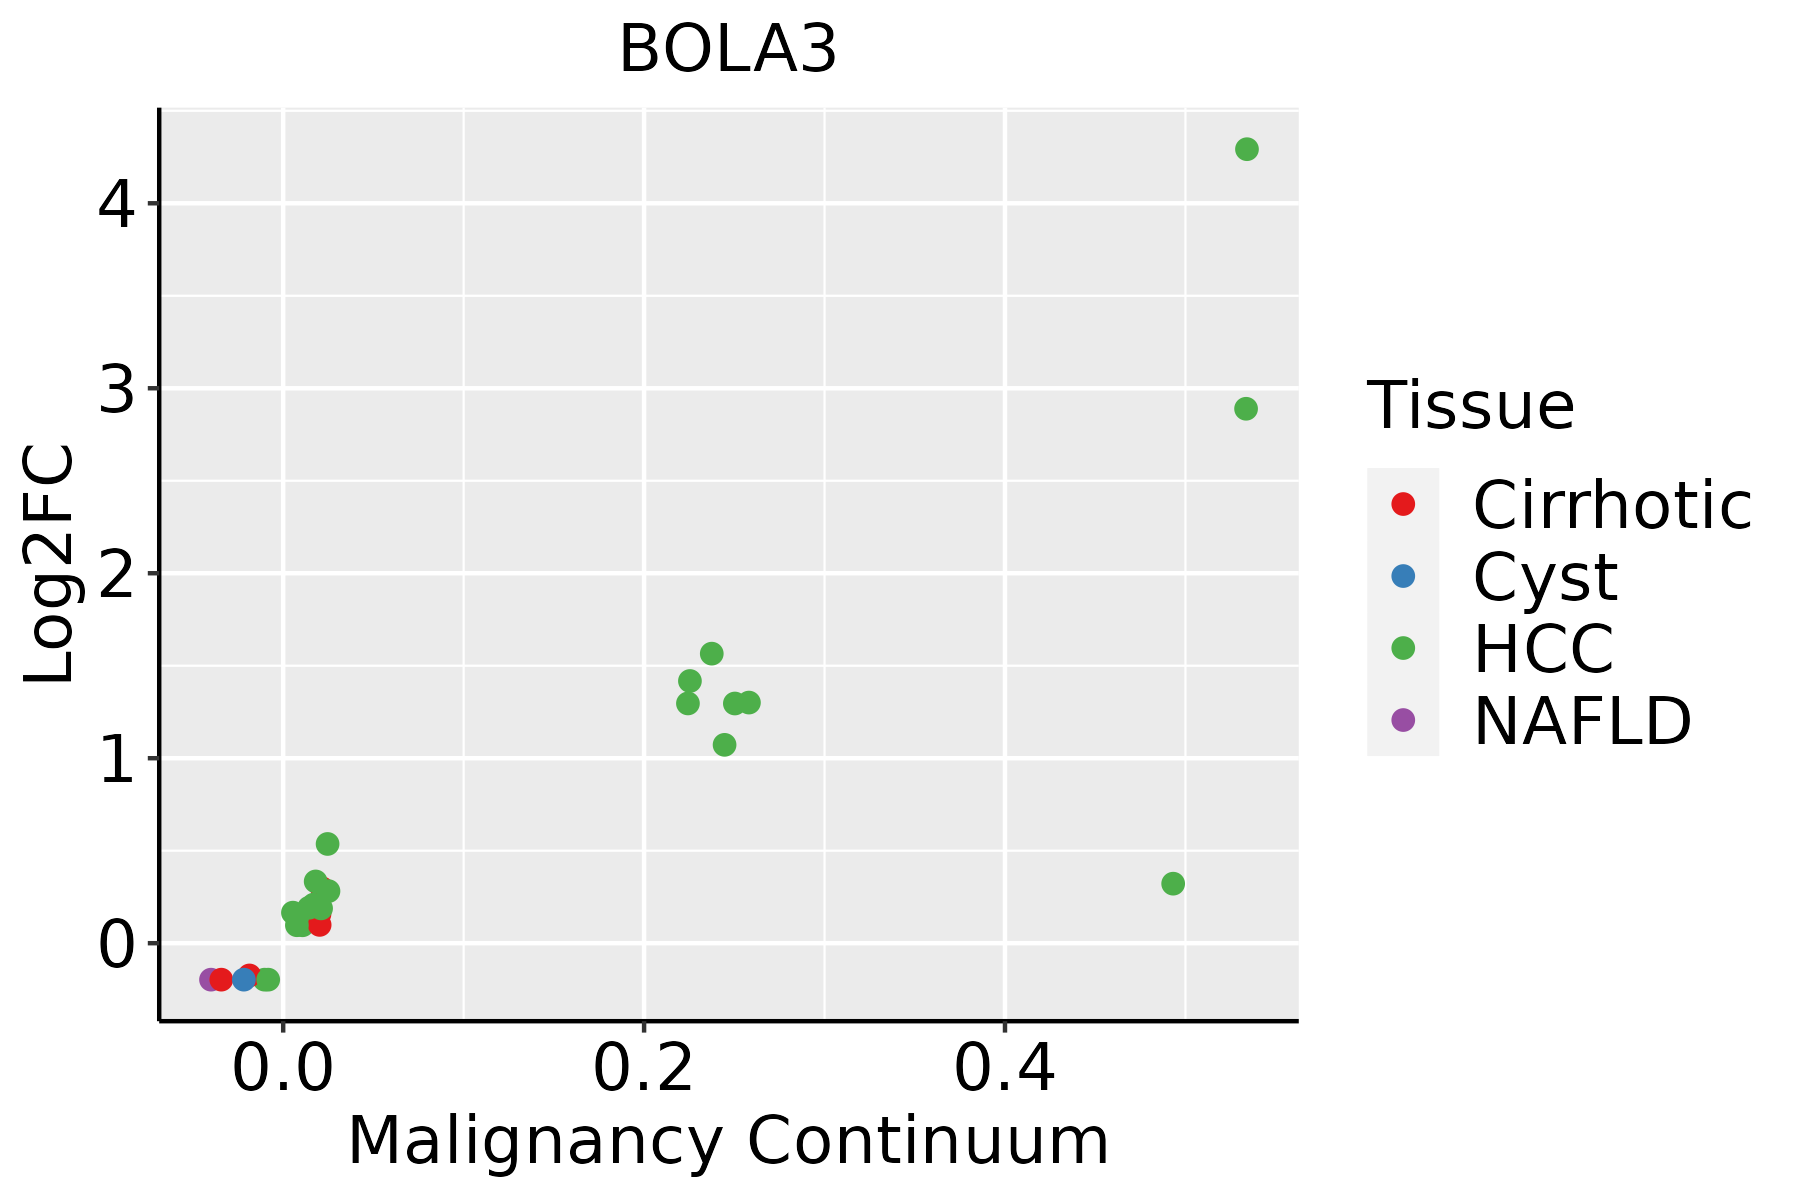 | HCC: Hepatocellular carcinoma |
| NAFLD: Non-alcoholic fatty liver disease | ||
| Oral Cavity |  | EOLP: Erosive Oral lichen planus |
| LP: leukoplakia | ||
| NEOLP: Non-erosive oral lichen planus | ||
| OSCC: Oral squamous cell carcinoma | ||
| Prostate | 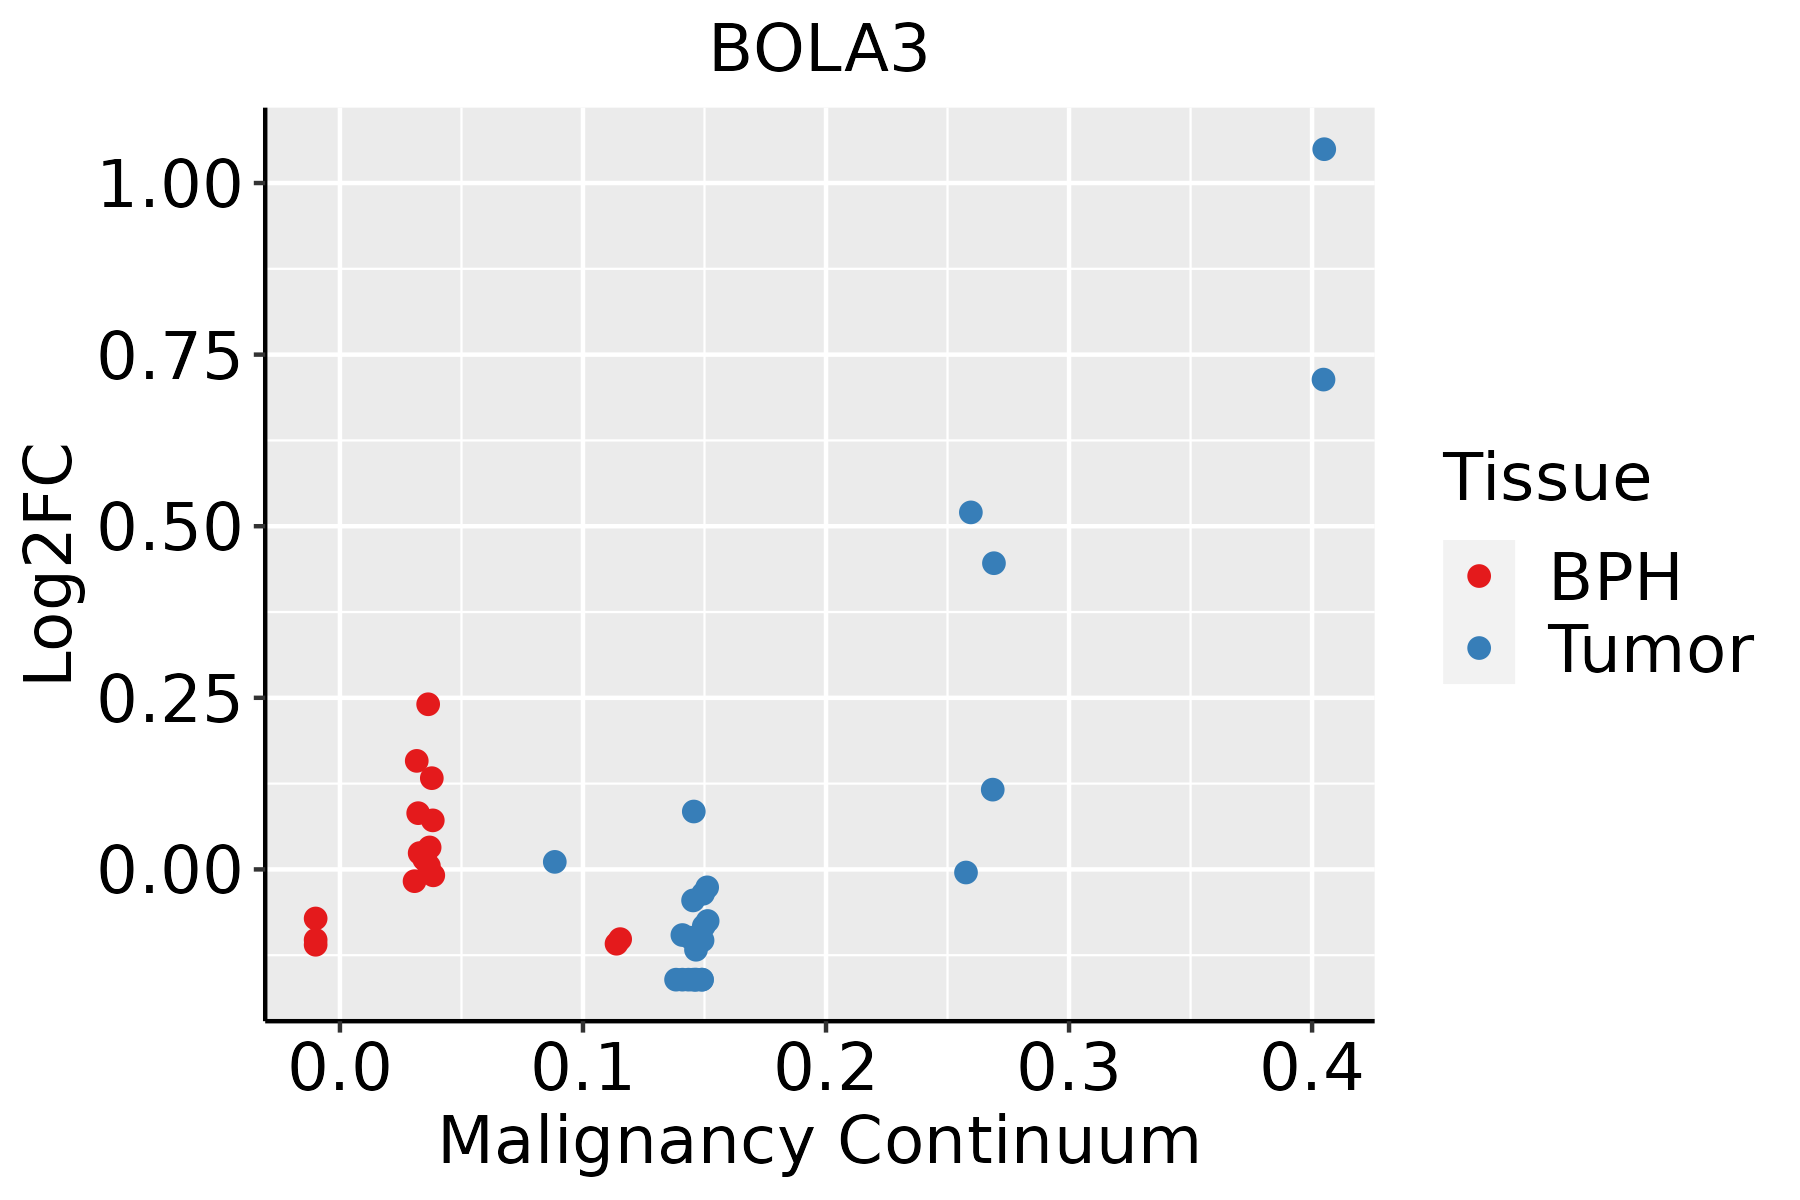 | BPH: Benign Prostatic Hyperplasia |
| Skin | 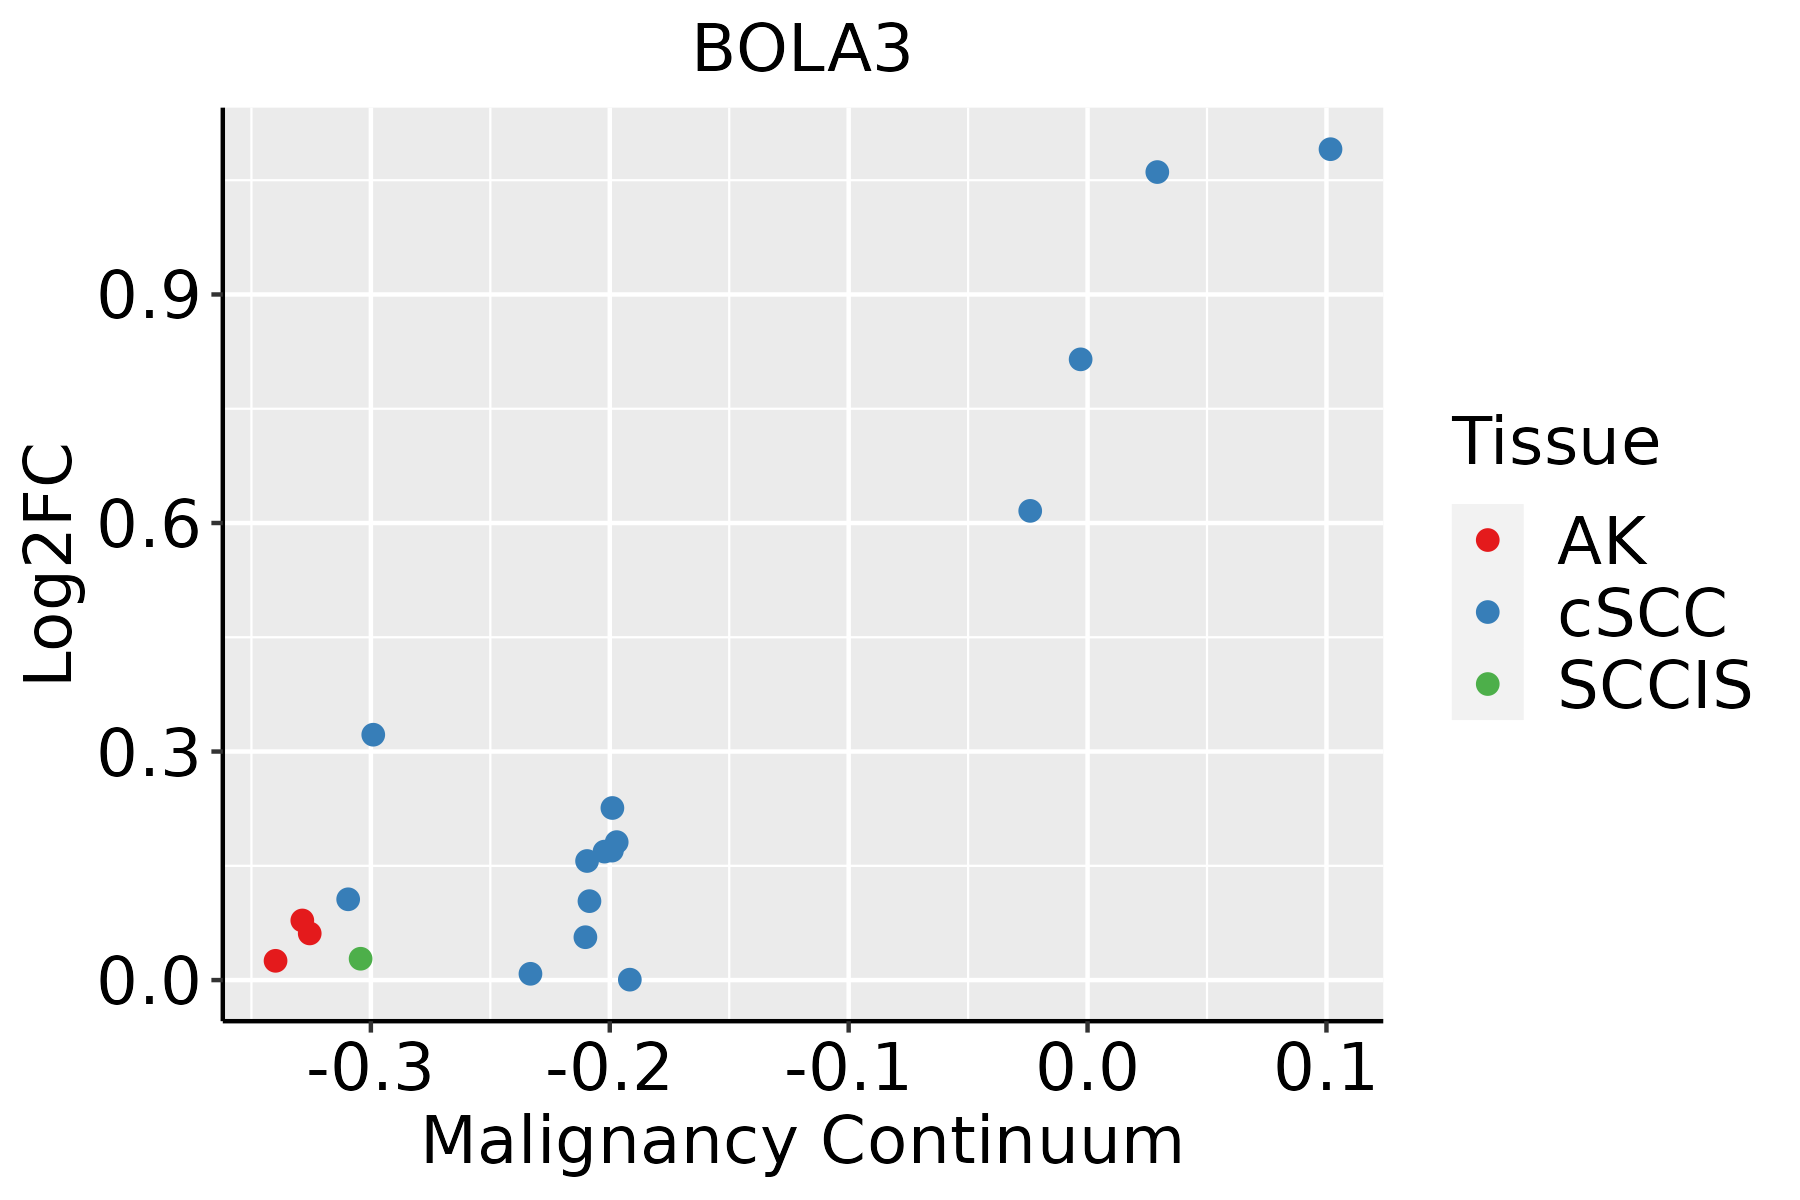 | AK: Actinic keratosis |
| cSCC: Cutaneous squamous cell carcinoma | ||
| SCCIS:squamous cell carcinoma in situ | ||
| Thyroid |  | ATC: Anaplastic thyroid cancer |
| HT: Hashimoto's thyroiditis | ||
| PTC: Papillary thyroid cancer |
| ∗log2FC in expression of this searched gene in stem-like cells from each diseased tissue sample relative to stem-like cells in normal samples in each tissue plotted against the malignancy continuum. Samples are colored based on if they are from different disease stage. |
Top |
Malignant transformation related pathway analysis |
| Find out the enriched GO biological processes and KEGG pathways involved in transition from healthy to precancer to cancer |
| Tissue | Disease Stage | Enriched GO biological Processes |
| Colorectum | AD |  |
| Colorectum | SER |  |
| Colorectum | MSS |  |
| Colorectum | MSI-H |  |
| Colorectum | FAP |  |
| ∗Top 15 enriched GO BP terms are showed in the bar plot of each disease state in each tissue. Each row represents a significant GO biological process which is colored according to the -log10(p.adjust). |
| Page: 1 2 3 4 5 6 7 8 9 |
| GO ID | Tissue | Disease Stage | Description | Gene Ratio | Bg Ratio | pvalue | p.adjust | Count |
| Page: 1 |
| Pathway ID | Tissue | Disease Stage | Description | Gene Ratio | Bg Ratio | pvalue | p.adjust | qvalue | Count |
| Page: 1 |
Top |
Cell-cell communication analysis |
| Identification of potential cell-cell interactions between two cell types and their ligand-receptor pairs for different disease states |
| Ligand | Receptor | LRpair | Pathway | Tissue | Disease Stage |
| Page: 1 |
Top |
Single-cell gene regulatory network inference analysis |
| Find out the significant the regulons (TFs) and the target genes of each regulon across cell types for different disease states |
| TF | Cell Type | Tissue | Disease Stage | Target Gene | RSS | Regulon Activity |
| ∗The dot plots of a searched regulon are shown for all cell subpopulations in each disease state of each tissue based on the regulon specific score inferred using pySCENIC and by calculating the average expression. |
| Page: 1 |
Top |
Somatic mutation of malignant transformation related genes |
| Annotation of somatic variants for genes involved in malignant transformation |
| Hugo Symbol | Variant Class | Variant Classification | dbSNP RS | HGVSc | HGVSp | HGVSp Short | SWISSPROT | BIOTYPE | SIFT | PolyPhen | Tumor Sample Barcode | Tissue | Histology | Sex | Age | Stage | Therapy Types | Drugs | Outcome |
| BOLA3 | SNV | Missense_Mutation | novel | c.59C>T | p.Pro20Leu | p.P20L | Q53S33 | protein_coding | tolerated(0.28) | probably_damaging(0.996) | TCGA-A5-A1OF-01 | Endometrium | uterine corpus endometrioid carcinoma | Female | <65 | I/II | Unknown | Unknown | SD |
| BOLA3 | SNV | Missense_Mutation | rs746179125 | c.71G>A | p.Arg24Gln | p.R24Q | Q53S33 | protein_coding | tolerated(0.07) | possibly_damaging(0.478) | TCGA-AX-A2HD-01 | Endometrium | uterine corpus endometrioid carcinoma | Female | >=65 | III/IV | Unknown | Unknown | SD |
| BOLA3 | SNV | Missense_Mutation | novel | c.196N>G | p.Lys66Glu | p.K66E | Q53S33 | protein_coding | tolerated(0.05) | benign(0.096) | TCGA-BS-A0UF-01 | Endometrium | uterine corpus endometrioid carcinoma | Female | >=65 | I/II | Unknown | Unknown | SD |
| BOLA3 | SNV | Missense_Mutation | c.182N>A | p.Ala61Glu | p.A61E | Q53S33 | protein_coding | deleterious(0.03) | probably_damaging(0.984) | TCGA-D1-A160-01 | Endometrium | uterine corpus endometrioid carcinoma | Female | >=65 | I/II | Unknown | Unknown | SD | |
| BOLA3 | SNV | Missense_Mutation | novel | c.275T>C | p.Ile92Thr | p.I92T | Q53S33 | protein_coding | deleterious(0) | probably_damaging(0.927) | TCGA-EO-A22R-01 | Endometrium | uterine corpus endometrioid carcinoma | Female | <65 | I/II | Unknown | Unknown | SD |
| BOLA3 | SNV | Missense_Mutation | novel | c.69T>G | p.His23Gln | p.H23Q | Q53S33 | protein_coding | tolerated(0.41) | benign(0) | TCGA-EO-A22R-01 | Endometrium | uterine corpus endometrioid carcinoma | Female | <65 | I/II | Unknown | Unknown | SD |
| BOLA3 | SNV | Missense_Mutation | novel | c.145N>T | p.Ala49Ser | p.A49S | Q53S33 | protein_coding | tolerated(0.35) | benign(0.007) | TCGA-EY-A215-01 | Endometrium | uterine corpus endometrioid carcinoma | Female | <65 | I/II | Unknown | Unknown | SD |
| BOLA3 | deletion | Frame_Shift_Del | novel | c.128delN | p.Lys43SerfsTer8 | p.K43Sfs*8 | Q53S33 | protein_coding | TCGA-D1-A17A-01 | Endometrium | uterine corpus endometrioid carcinoma | Female | <65 | I/II | Unknown | Unknown | SD | ||
| BOLA3 | SNV | Missense_Mutation | c.118N>G | p.Leu40Val | p.L40V | Q53S33 | protein_coding | deleterious(0) | probably_damaging(0.998) | TCGA-37-4135-01 | Lung | lung squamous cell carcinoma | Male | >=65 | I/II | Unknown | Unknown | SD | |
| BOLA3 | deletion | Frame_Shift_Del | novel | c.123delN | p.Glu42LysfsTer9 | p.E42Kfs*9 | Q53S33 | protein_coding | TCGA-33-4566-01 | Lung | lung squamous cell carcinoma | Male | <65 | I/II | Unknown | Unknown | SD |
| Page: 1 |
Top |
Related drugs of malignant transformation related genes |
| Identification of chemicals and drugs interact with genes involved in malignant transfromation |
| (DGIdb 4.0) |
| Entrez ID | Symbol | Category | Interaction Types | Drug Claim Name | Drug Name | PMIDs |
| Page: 1 |

Copyright 2023-Present -The University of Texas Health Science Center at Houston |