
|
|||||
|
 | |
| |
| |
| |
| |
| |
|
Gene: BAZ1B |
Gene summary for BAZ1B |
| Gene information | Species | Human | Gene symbol | BAZ1B | Gene ID | 9031 |
| Gene name | bromodomain adjacent to zinc finger domain 1B | |
| Gene Alias | WBSCR10 | |
| Cytomap | 7q11.23 | |
| Gene Type | protein-coding | GO ID | GO:0006139 | UniProtAcc | Q9UIG0 |
Top |
Malignant transformation analysis |
| Identification of the aberrant gene expression in precancerous and cancerous lesions by comparing the gene expression of stem-like cells in diseased tissues with normal stem cells |
| Entrez ID | Symbol | Replicates | Species | Organ | Tissue | Adj P-value | Log2FC | Malignancy |
| 9031 | BAZ1B | Dong_P1 | Human | Prostate | Tumor | 4.05e-12 | 4.14e-02 | 0.035 |
| 9031 | BAZ1B | Dong_P3 | Human | Prostate | Tumor | 7.95e-04 | 6.70e-02 | 0.0278 |
| 9031 | BAZ1B | Dong_P5 | Human | Prostate | Tumor | 1.38e-27 | 1.76e-01 | 0.053 |
| 9031 | BAZ1B | GSM5353216_PA_PB1A_Pool_1_3_S50_L002 | Human | Prostate | Tumor | 4.70e-02 | 6.46e-01 | 0.159 |
| 9031 | BAZ1B | GSM5353221_PA_PB2A_Pool_1_3_S25_L001 | Human | Prostate | Tumor | 1.16e-09 | 6.89e-01 | 0.1633 |
| 9031 | BAZ1B | GSM5353222_PA_PB2B_Pool_1_3_S52_L002 | Human | Prostate | Tumor | 3.22e-09 | 6.37e-01 | 0.1608 |
| 9031 | BAZ1B | GSM5353223_PA_PB2B_Pool_2_S26_L001 | Human | Prostate | Tumor | 8.82e-07 | 6.64e-01 | 0.1604 |
| 9031 | BAZ1B | GSM5353224_PA_PR5186_Pool_1_2_3_S27_L001 | Human | Prostate | Tumor | 1.34e-04 | 5.69e-01 | 0.1621 |
| 9031 | BAZ1B | GSM5353225_PA_PR5196-1_Pool_1_2_3_S53_L002 | Human | Prostate | Tumor | 9.13e-03 | 5.64e-01 | 0.1619 |
| 9031 | BAZ1B | GSM5353227_PA_PR5199-193K_Pool_1_2_3_S55_L002 | Human | Prostate | Tumor | 7.11e-12 | 7.38e-01 | 0.1602 |
| 9031 | BAZ1B | GSM5353232_PA_PR5249_T1_S3_L001 | Human | Prostate | Tumor | 1.27e-03 | 5.33e-01 | 0.1439 |
| 9031 | BAZ1B | GSM5353236_PA_PR5251_T1_S7_L001 | Human | Prostate | Tumor | 4.98e-08 | 7.52e-01 | 0.1608 |
| 9031 | BAZ1B | GSM5353237_PA_PR5251_T2_S8_L001 | Human | Prostate | Tumor | 2.49e-03 | 7.43e-01 | 0.1622 |
| 9031 | BAZ1B | GSM5353240_PA_PR5254_T1_S15_L001 | Human | Prostate | Tumor | 8.24e-13 | 6.13e-01 | 0.1575 |
| 9031 | BAZ1B | GSM5353243_PA_PR5261_T1_S23_L002 | Human | Prostate | Tumor | 1.65e-08 | 4.50e-01 | 0.1545 |
| 9031 | BAZ1B | GSM5353244_PA_PR5261_T2_S24_L002 | Human | Prostate | Tumor | 2.43e-12 | 6.45e-01 | 0.1569 |
| 9031 | BAZ1B | P1_S1_AK | Human | Skin | AK | 2.72e-06 | 3.06e-01 | -0.3399 |
| 9031 | BAZ1B | P4_S8_cSCC | Human | Skin | cSCC | 7.60e-03 | 1.10e-01 | -0.3095 |
| 9031 | BAZ1B | P5_S10_cSCC | Human | Skin | cSCC | 8.18e-18 | 3.60e-01 | -0.299 |
| 9031 | BAZ1B | P1_cSCC | Human | Skin | cSCC | 1.98e-09 | 5.51e-01 | 0.0292 |
| Page: 1 2 3 4 5 6 7 |
| Tissue | Expression Dynamics | Abbreviation |
| Esophagus | 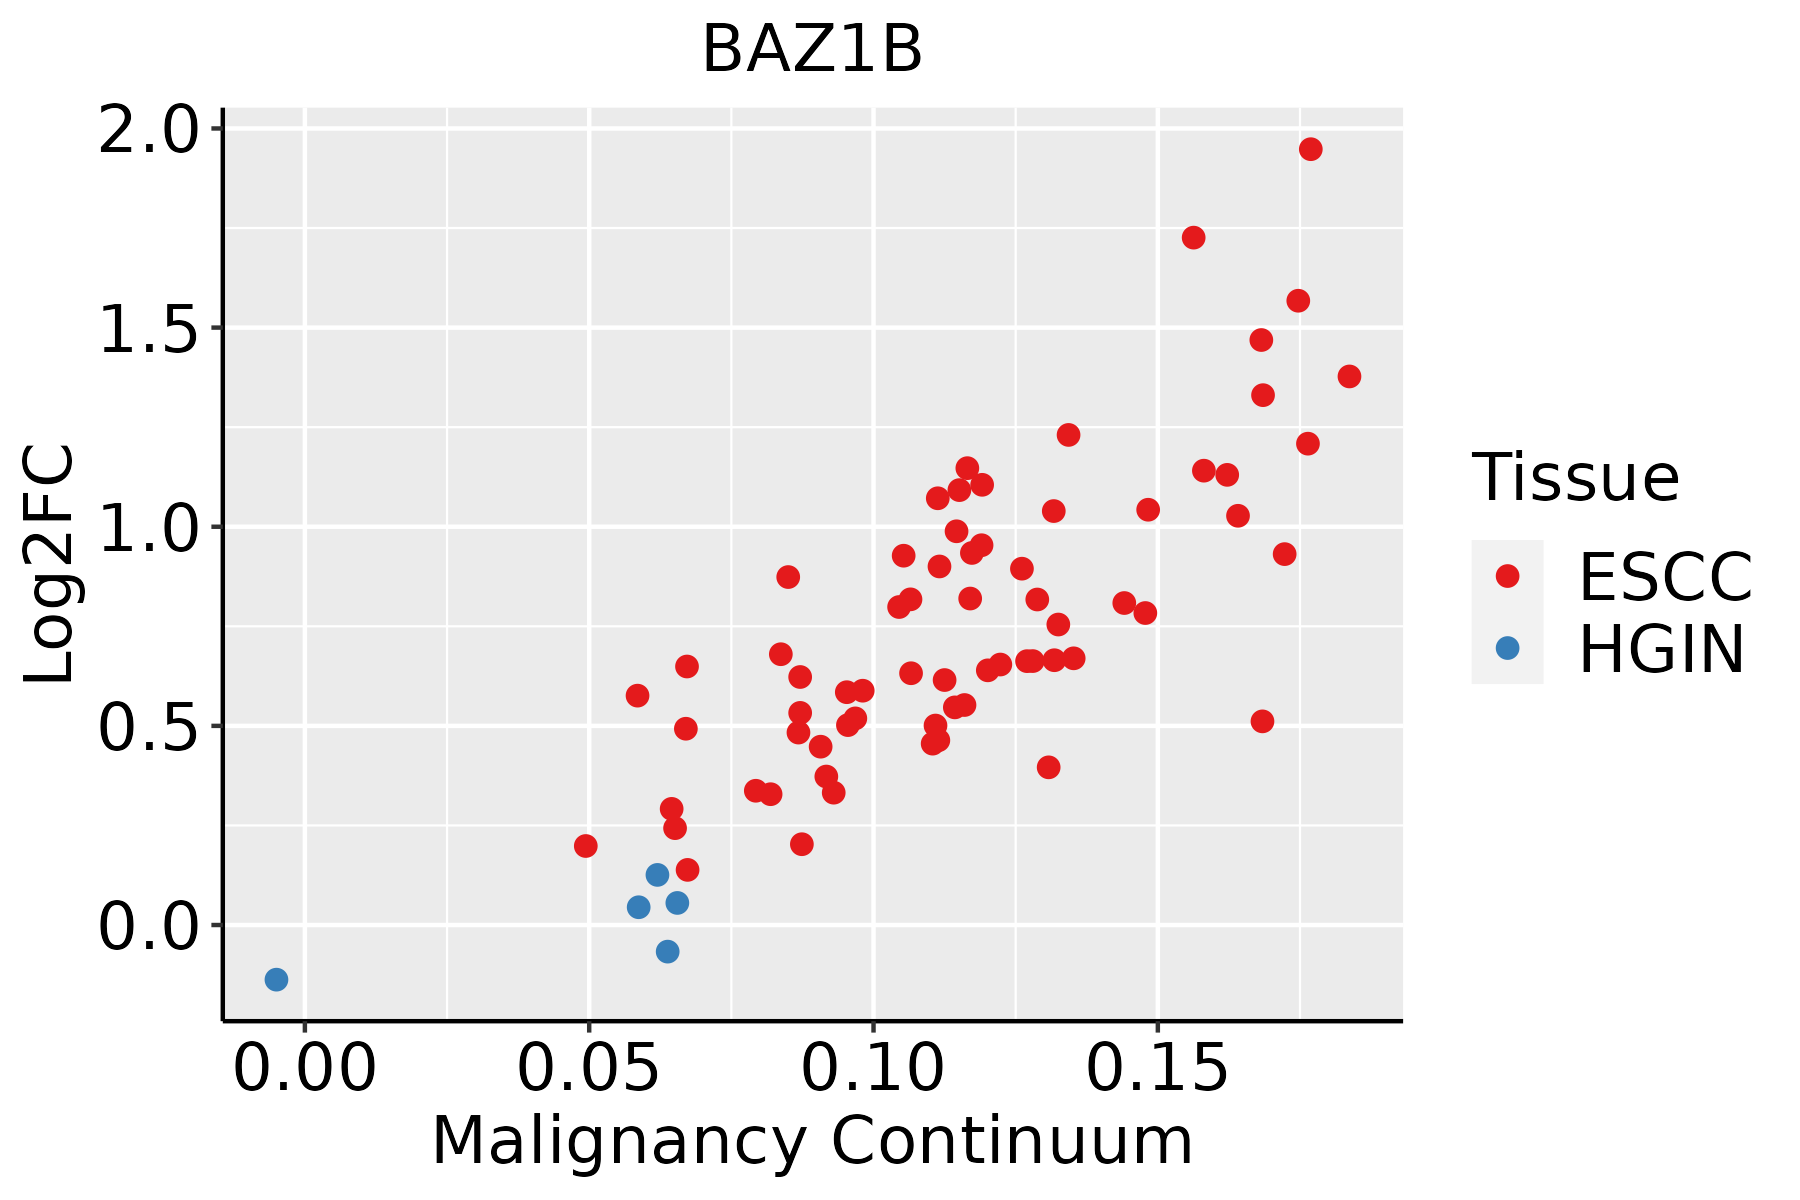 | ESCC: Esophageal squamous cell carcinoma |
| HGIN: High-grade intraepithelial neoplasias | ||
| LGIN: Low-grade intraepithelial neoplasias | ||
| Liver | 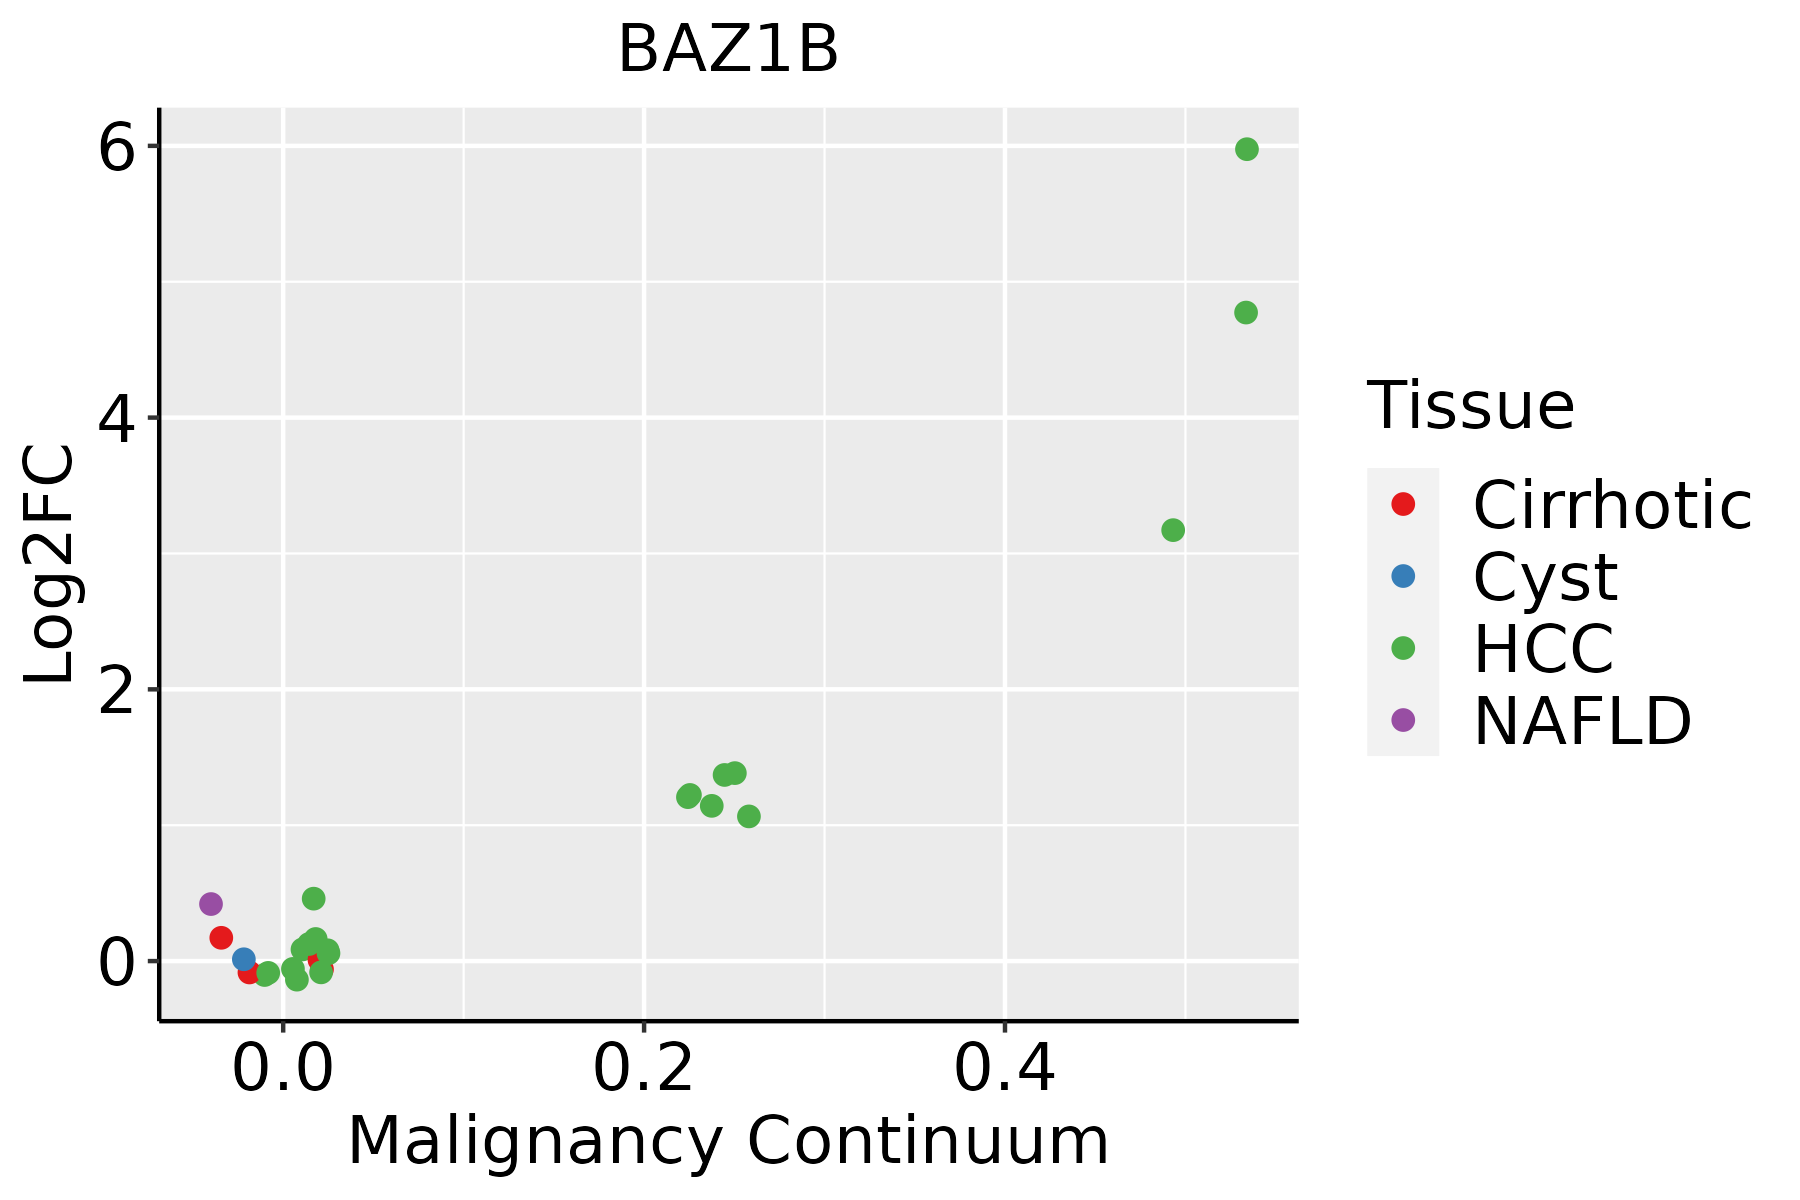 | HCC: Hepatocellular carcinoma |
| NAFLD: Non-alcoholic fatty liver disease | ||
| Oral Cavity | 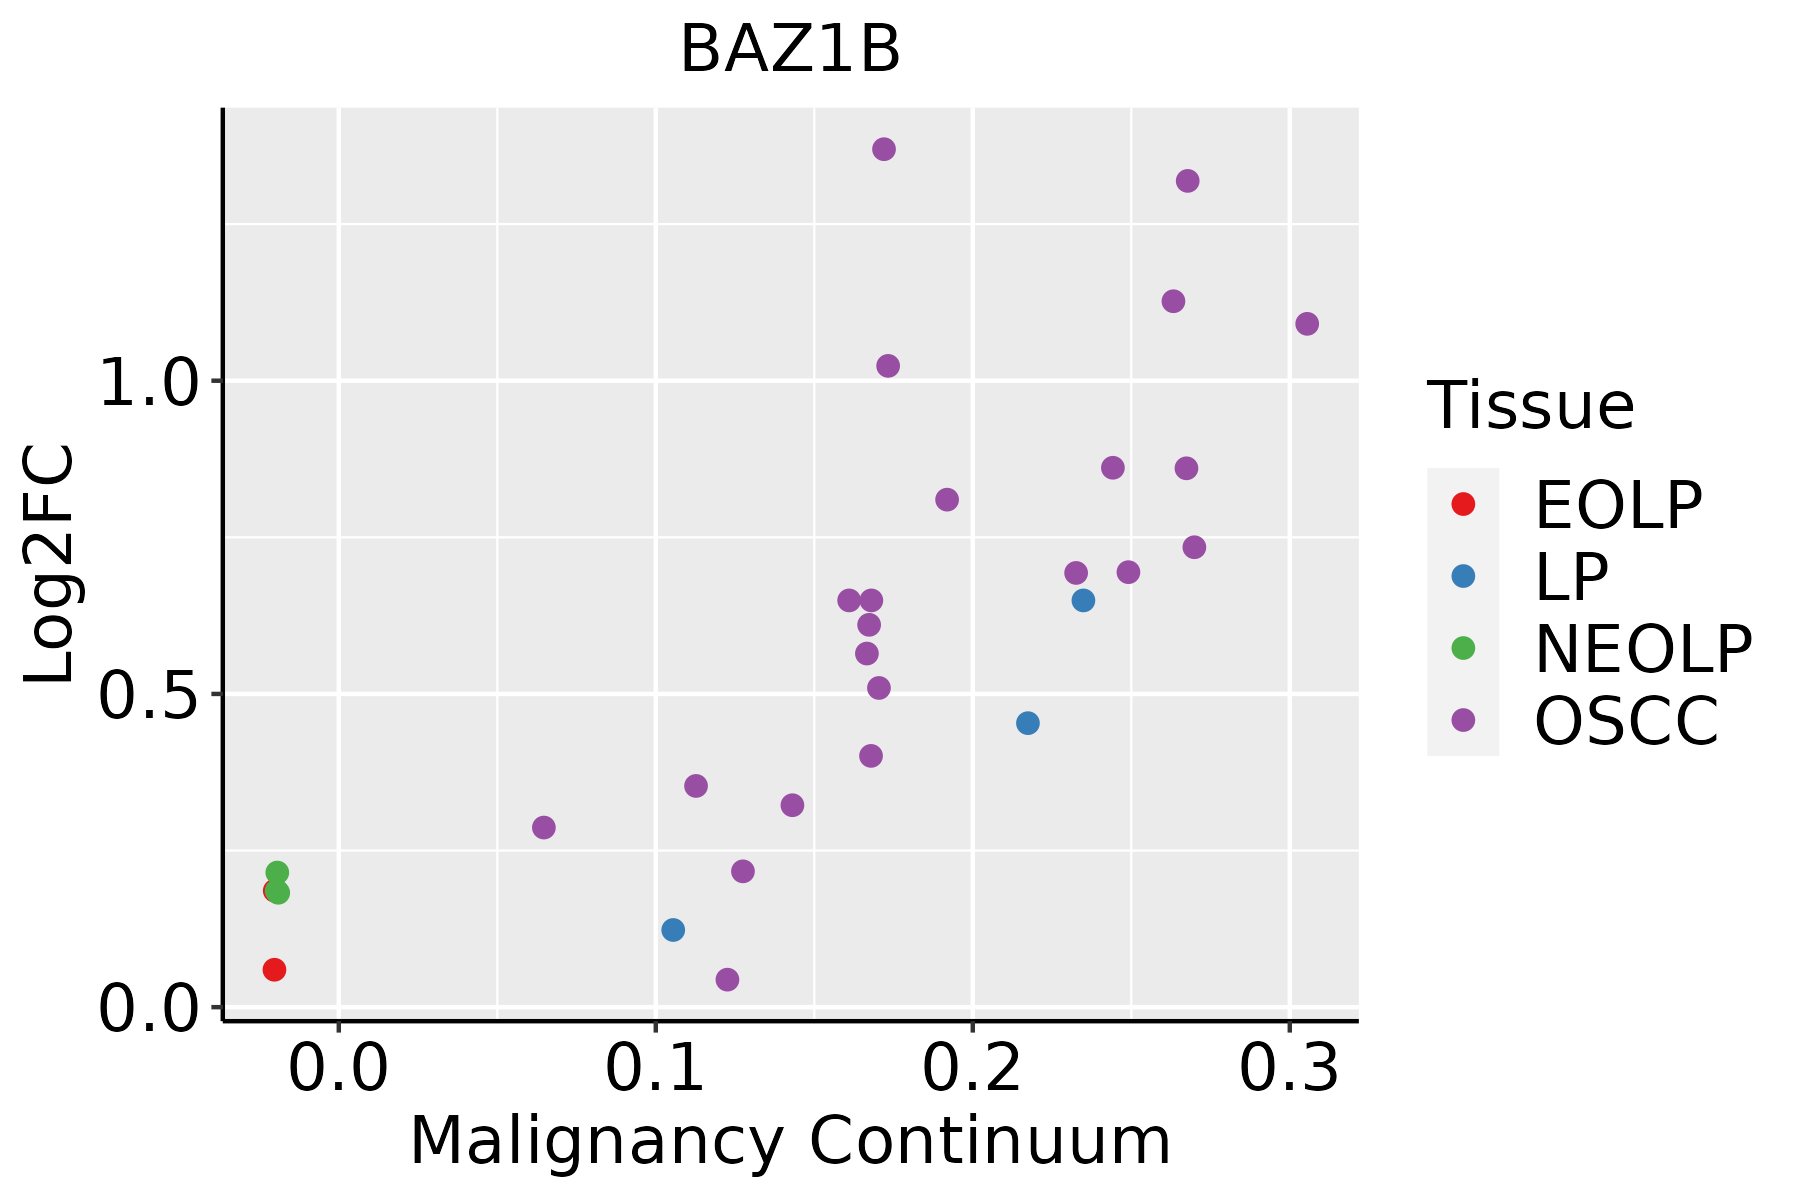 | EOLP: Erosive Oral lichen planus |
| LP: leukoplakia | ||
| NEOLP: Non-erosive oral lichen planus | ||
| OSCC: Oral squamous cell carcinoma | ||
| Prostate |  | BPH: Benign Prostatic Hyperplasia |
| Skin | 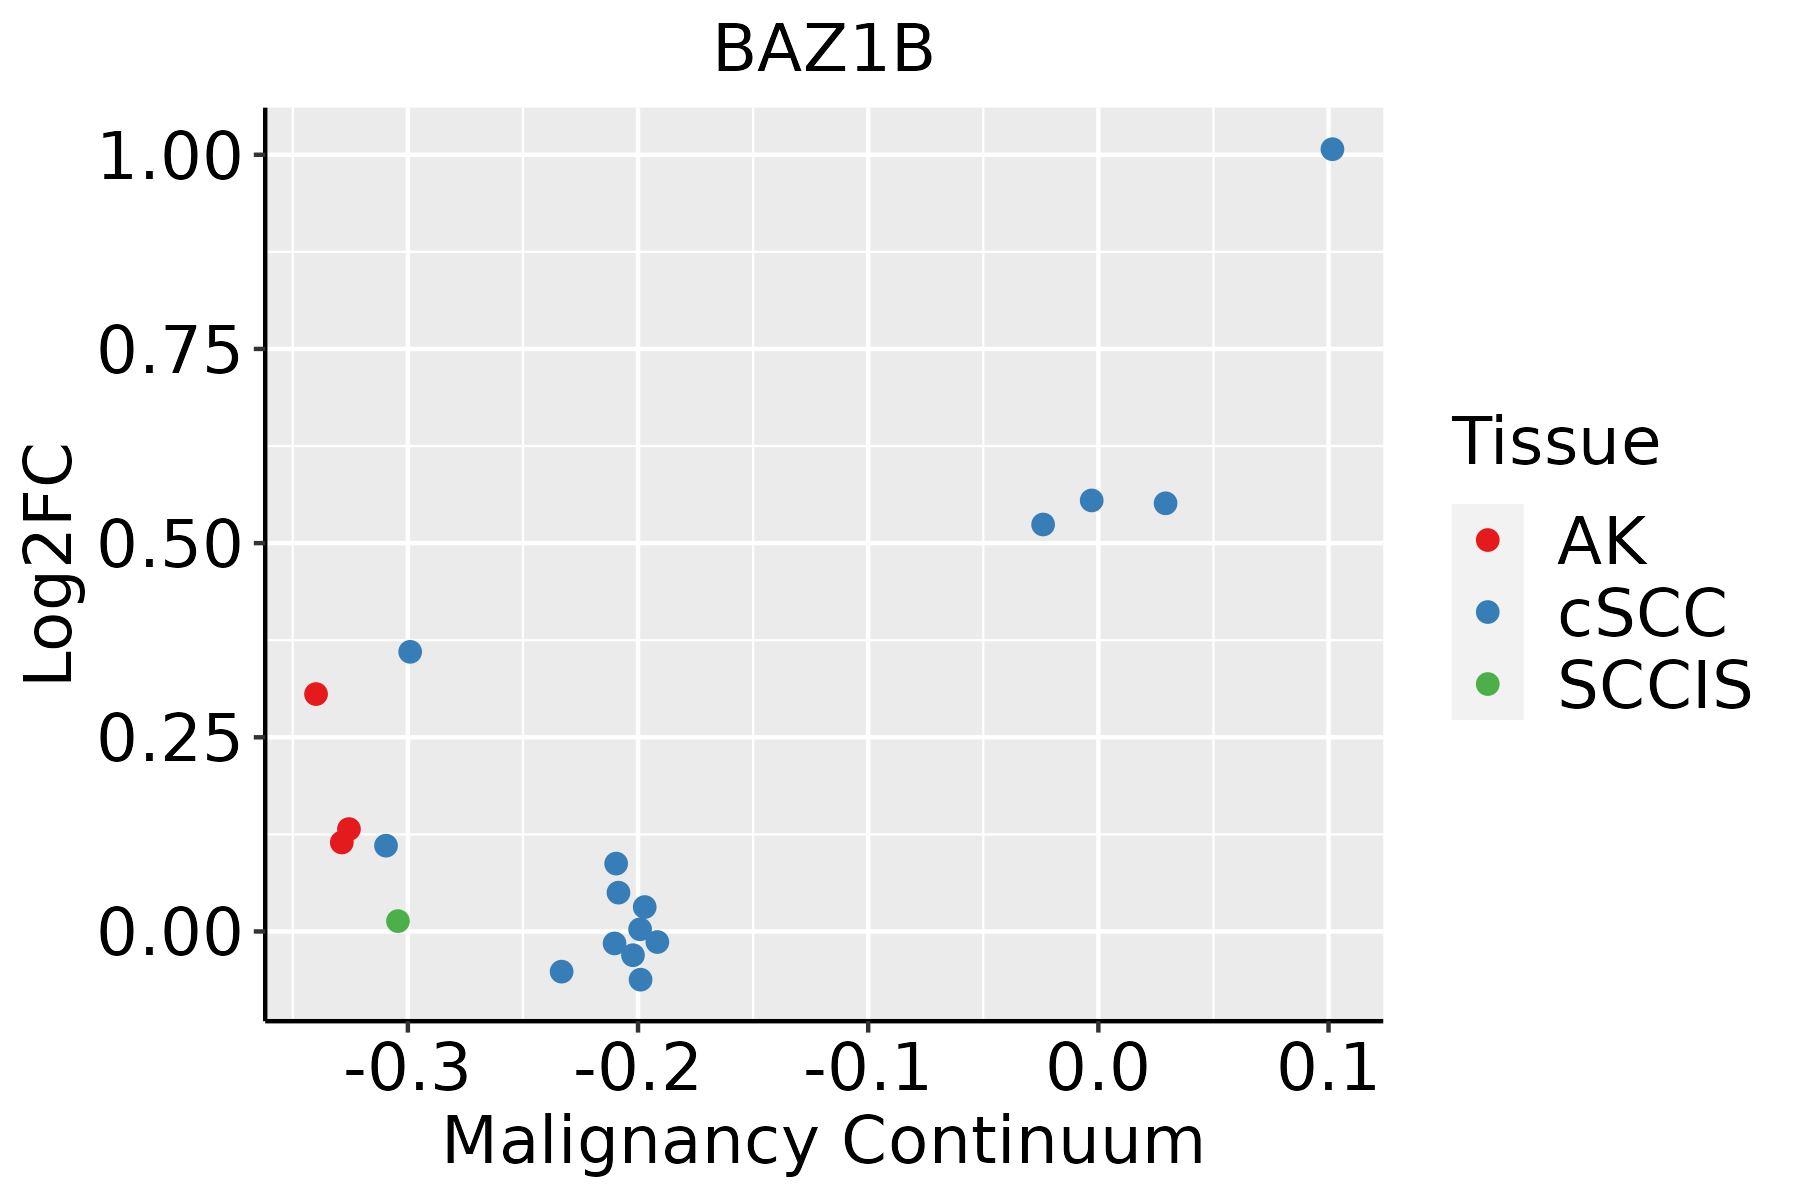 | AK: Actinic keratosis |
| cSCC: Cutaneous squamous cell carcinoma | ||
| SCCIS:squamous cell carcinoma in situ | ||
| Thyroid | 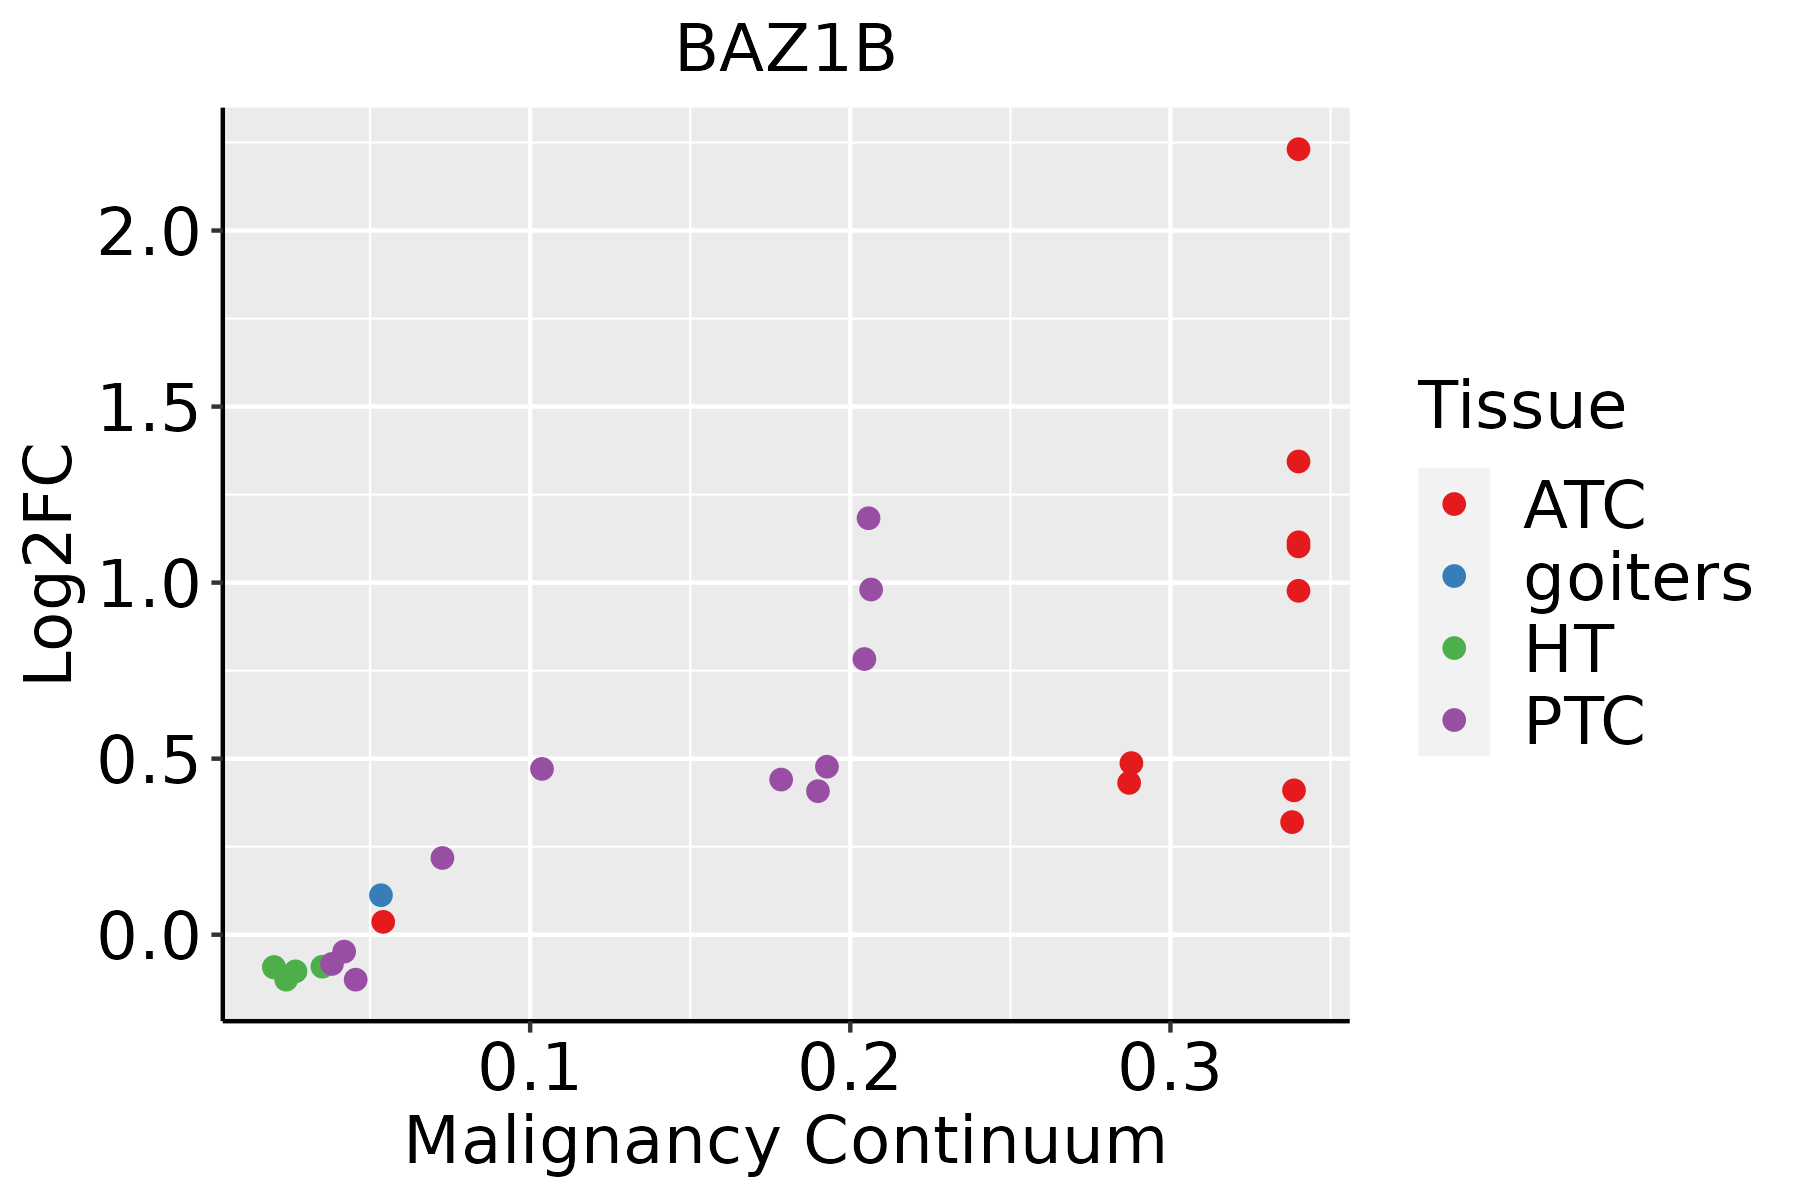 | ATC: Anaplastic thyroid cancer |
| HT: Hashimoto's thyroiditis | ||
| PTC: Papillary thyroid cancer |
| ∗log2FC in expression of this searched gene in stem-like cells from each diseased tissue sample relative to stem-like cells in normal samples in each tissue plotted against the malignancy continuum. Samples are colored based on if they are from different disease stage. |
Top |
Malignant transformation related pathway analysis |
| Find out the enriched GO biological processes and KEGG pathways involved in transition from healthy to precancer to cancer |
| Tissue | Disease Stage | Enriched GO biological Processes |
| Colorectum | AD |  |
| Colorectum | SER |  |
| Colorectum | MSS |  |
| Colorectum | MSI-H |  |
| Colorectum | FAP |  |
| ∗Top 15 enriched GO BP terms are showed in the bar plot of each disease state in each tissue. Each row represents a significant GO biological process which is colored according to the -log10(p.adjust). |
| Page: 1 2 3 4 5 6 7 8 9 |
| GO ID | Tissue | Disease Stage | Description | Gene Ratio | Bg Ratio | pvalue | p.adjust | Count |
| GO:001657015 | Esophagus | ESCC | histone modification | 323/8552 | 463/18723 | 2.61e-26 | 7.88e-24 | 323 |
| GO:000632517 | Esophagus | ESCC | chromatin organization | 240/8552 | 409/18723 | 6.52e-08 | 1.14e-06 | 240 |
| GO:00182124 | Esophagus | ESCC | peptidyl-tyrosine modification | 202/8552 | 378/18723 | 1.34e-03 | 6.39e-03 | 202 |
| GO:00181084 | Esophagus | ESCC | peptidyl-tyrosine phosphorylation | 200/8552 | 375/18723 | 1.60e-03 | 7.45e-03 | 200 |
| GO:00165721 | Esophagus | ESCC | histone phosphorylation | 27/8552 | 39/18723 | 2.52e-03 | 1.08e-02 | 27 |
| GO:001657011 | Liver | Cirrhotic | histone modification | 154/4634 | 463/18723 | 1.92e-05 | 2.57e-04 | 154 |
| GO:001657021 | Liver | HCC | histone modification | 283/7958 | 463/18723 | 2.68e-16 | 2.33e-14 | 283 |
| GO:000632511 | Liver | HCC | chromatin organization | 206/7958 | 409/18723 | 7.23e-04 | 4.41e-03 | 206 |
| GO:00165707 | Oral cavity | OSCC | histone modification | 270/7305 | 463/18723 | 1.59e-17 | 1.50e-15 | 270 |
| GO:00182123 | Oral cavity | OSCC | peptidyl-tyrosine modification | 180/7305 | 378/18723 | 3.63e-04 | 2.22e-03 | 180 |
| GO:00181083 | Oral cavity | OSCC | peptidyl-tyrosine phosphorylation | 177/7305 | 375/18723 | 6.86e-04 | 3.83e-03 | 177 |
| GO:000632510 | Oral cavity | OSCC | chromatin organization | 190/7305 | 409/18723 | 1.17e-03 | 5.97e-03 | 190 |
| GO:0016572 | Oral cavity | OSCC | histone phosphorylation | 24/7305 | 39/18723 | 3.64e-03 | 1.51e-02 | 24 |
| GO:001657023 | Oral cavity | EOLP | histone modification | 98/2218 | 463/18723 | 5.58e-09 | 2.96e-07 | 98 |
| GO:000632515 | Oral cavity | EOLP | chromatin organization | 84/2218 | 409/18723 | 2.68e-07 | 8.16e-06 | 84 |
| GO:00182121 | Oral cavity | EOLP | peptidyl-tyrosine modification | 65/2218 | 378/18723 | 1.25e-03 | 9.02e-03 | 65 |
| GO:00181081 | Oral cavity | EOLP | peptidyl-tyrosine phosphorylation | 64/2218 | 375/18723 | 1.65e-03 | 1.09e-02 | 64 |
| GO:00063383 | Oral cavity | EOLP | chromatin remodeling | 46/2218 | 255/18723 | 2.34e-03 | 1.44e-02 | 46 |
| GO:001657031 | Oral cavity | NEOLP | histone modification | 88/2005 | 463/18723 | 5.59e-08 | 2.23e-06 | 88 |
| GO:000632521 | Oral cavity | NEOLP | chromatin organization | 70/2005 | 409/18723 | 4.97e-05 | 6.83e-04 | 70 |
| Page: 1 2 3 |
| Pathway ID | Tissue | Disease Stage | Description | Gene Ratio | Bg Ratio | pvalue | p.adjust | qvalue | Count |
| Page: 1 |
Top |
Cell-cell communication analysis |
| Identification of potential cell-cell interactions between two cell types and their ligand-receptor pairs for different disease states |
| Ligand | Receptor | LRpair | Pathway | Tissue | Disease Stage |
| Page: 1 |
Top |
Single-cell gene regulatory network inference analysis |
| Find out the significant the regulons (TFs) and the target genes of each regulon across cell types for different disease states |
| TF | Cell Type | Tissue | Disease Stage | Target Gene | RSS | Regulon Activity |
| ∗The dot plots of a searched regulon are shown for all cell subpopulations in each disease state of each tissue based on the regulon specific score inferred using pySCENIC and by calculating the average expression. |
| Page: 1 |
Top |
Somatic mutation of malignant transformation related genes |
| Annotation of somatic variants for genes involved in malignant transformation |
| Hugo Symbol | Variant Class | Variant Classification | dbSNP RS | HGVSc | HGVSp | HGVSp Short | SWISSPROT | BIOTYPE | SIFT | PolyPhen | Tumor Sample Barcode | Tissue | Histology | Sex | Age | Stage | Therapy Types | Drugs | Outcome |
| BAZ1B | SNV | Missense_Mutation | novel | c.3566N>G | p.Val1189Gly | p.V1189G | Q9UIG0 | protein_coding | deleterious(0) | probably_damaging(0.998) | TCGA-5L-AAT0-01 | Breast | breast invasive carcinoma | Female | <65 | I/II | Hormone Therapy | tamoxiphen | SD |
| BAZ1B | SNV | Missense_Mutation | c.3100N>G | p.Leu1034Val | p.L1034V | Q9UIG0 | protein_coding | tolerated(0.19) | probably_damaging(0.991) | TCGA-A1-A0SI-01 | Breast | breast invasive carcinoma | Female | <65 | I/II | Unknown | Unknown | SD | |
| BAZ1B | SNV | Missense_Mutation | rs782432522 | c.1270C>T | p.Pro424Ser | p.P424S | Q9UIG0 | protein_coding | tolerated(0.34) | benign(0.031) | TCGA-A2-A0CX-01 | Breast | breast invasive carcinoma | Female | <65 | I/II | Chemotherapy | adriamycin | SD |
| BAZ1B | SNV | Missense_Mutation | novel | c.1814N>A | p.Thr605Lys | p.T605K | Q9UIG0 | protein_coding | deleterious(0.05) | possibly_damaging(0.829) | TCGA-A2-A25A-01 | Breast | breast invasive carcinoma | Female | <65 | I/II | Unspecific | Cytoxan | SD |
| BAZ1B | SNV | Missense_Mutation | c.2584N>A | p.Glu862Lys | p.E862K | Q9UIG0 | protein_coding | tolerated(0.39) | benign(0.015) | TCGA-A8-A06Q-01 | Breast | breast invasive carcinoma | Female | <65 | III/IV | Unknown | Unknown | SD | |
| BAZ1B | SNV | Missense_Mutation | c.1556G>A | p.Arg519Gln | p.R519Q | Q9UIG0 | protein_coding | tolerated(0.57) | benign(0.009) | TCGA-AN-A046-01 | Breast | breast invasive carcinoma | Female | >=65 | I/II | Unknown | Unknown | SD | |
| BAZ1B | SNV | Missense_Mutation | c.1476N>T | p.Arg492Ser | p.R492S | Q9UIG0 | protein_coding | deleterious(0.02) | benign(0.01) | TCGA-AN-A0AS-01 | Breast | breast invasive carcinoma | Female | >=65 | III/IV | Unknown | Unknown | SD | |
| BAZ1B | SNV | Missense_Mutation | c.146N>A | p.Ile49Asn | p.I49N | Q9UIG0 | protein_coding | deleterious(0) | probably_damaging(0.999) | TCGA-BH-A0AY-01 | Breast | breast invasive carcinoma | Female | <65 | I/II | Chemotherapy | SD | ||
| BAZ1B | SNV | Missense_Mutation | novel | c.2438A>G | p.Asn813Ser | p.N813S | Q9UIG0 | protein_coding | tolerated(0.71) | benign(0.018) | TCGA-D8-A1XK-01 | Breast | breast invasive carcinoma | Female | <65 | I/II | Chemotherapy | doxorubicine+cyclophosphamide | SD |
| BAZ1B | SNV | Missense_Mutation | c.784T>G | p.Leu262Val | p.L262V | Q9UIG0 | protein_coding | tolerated(0.16) | probably_damaging(0.991) | TCGA-D8-A1XK-01 | Breast | breast invasive carcinoma | Female | <65 | I/II | Chemotherapy | doxorubicine+cyclophosphamide | SD |
| Page: 1 2 3 4 5 6 7 8 9 10 11 12 13 14 15 |
Top |
Related drugs of malignant transformation related genes |
| Identification of chemicals and drugs interact with genes involved in malignant transfromation |
| (DGIdb 4.0) |
| Entrez ID | Symbol | Category | Interaction Types | Drug Claim Name | Drug Name | PMIDs |
| Page: 1 |

Copyright 2023-Present -The University of Texas Health Science Center at Houston |