Schematic overview of the cellular and molecular mechanisms involved in the cancer progression, including the proposed cellular and molecular mechanisms in cancer cells trajectory. AT1: alveolar type 1 cells; AT2: alveolar type 2 cells; AAH: atypical adenomatous hyperplasia; AIS: adenocarcinoma in situ; MIA: minimally invasive adenocarcinoma; IA: invasive adenocarcinoma; EMT: epithelial-mesenchymal transition

Home

Download

Statistics

Help

Contact

Center for Computational Systems Medicine
leaf

Gene summary

leaf

Malignant transformation analysis

leaf

Malignant transformation related pathway analysis

leaf

Cell-cell communication analysis

leaf

Single-cell gene regulatory network inference analysis

leaf

Somatic mutation of malignant transformation related genes

leaf

Related drugs of malignant transformation related genes

Gene: ATF7

Gene summary for ATF7

check button Gene summary.

Gene informationSpeciesHuman
Gene symbol

ATF7

Gene ID

11016

Gene nameactivating transcription factor 7
Gene AliasATFA
Cytomap12q13.13
Gene Typeprotein-coding
GO ID

GO:0006139

UniProtAcc

P17544


Top

Malignant transformation analysis

check button Identification of the aberrant gene expression in precancerous and cancerous lesions by comparing the gene expression of stem-like cells in diseased tissues with normal stem cells
check button Malignant transformation involving gene list.
Entrez IDSymbolReplicatesSpeciesOrganTissueAdj P-valueLog2FCMalignancy
11016ATF7HTA12-26-1HumanPancreasPDAC9.58e-104.87e-010.3728
11016ATF7HTA12-29-1HumanPancreasPDAC1.72e-235.20e-010.3722
11016ATF7male-WTAHumanThyroidPTC2.07e-141.43e-010.1037
11016ATF7PTC01HumanThyroidPTC4.46e-103.80e-020.1899
11016ATF7PTC04HumanThyroidPTC1.95e-191.57e-010.1927
11016ATF7PTC05HumanThyroidPTC1.03e-062.69e-010.2065
11016ATF7PTC06HumanThyroidPTC1.94e-112.83e-010.2057
11016ATF7PTC07HumanThyroidPTC2.81e-211.71e-010.2044
11016ATF7ATC09HumanThyroidATC2.08e-027.68e-020.2871
11016ATF7ATC12HumanThyroidATC6.79e-231.37e-010.34
11016ATF7ATC13HumanThyroidATC2.15e-336.39e-010.34
11016ATF7ATC2HumanThyroidATC3.26e-063.19e-010.34
11016ATF7ATC4HumanThyroidATC2.11e-162.01e-010.34
11016ATF7ATC5HumanThyroidATC2.63e-376.96e-010.34
Page: 1 2 3 4 5 6 

check button Transcriptomic changes along malignancy continuum.
TissueExpression DynamicsAbbreviation
EsophagusThe image shows the transcriptomic changes along malignancy continuum.log2FC in expression of this searched gene in stem-like cells from each diseased tissue sample relative to stem-like cells in normal samples in each tissue plotted against the malignancy continuum. Samples are colored based on if they are from different disease stage.
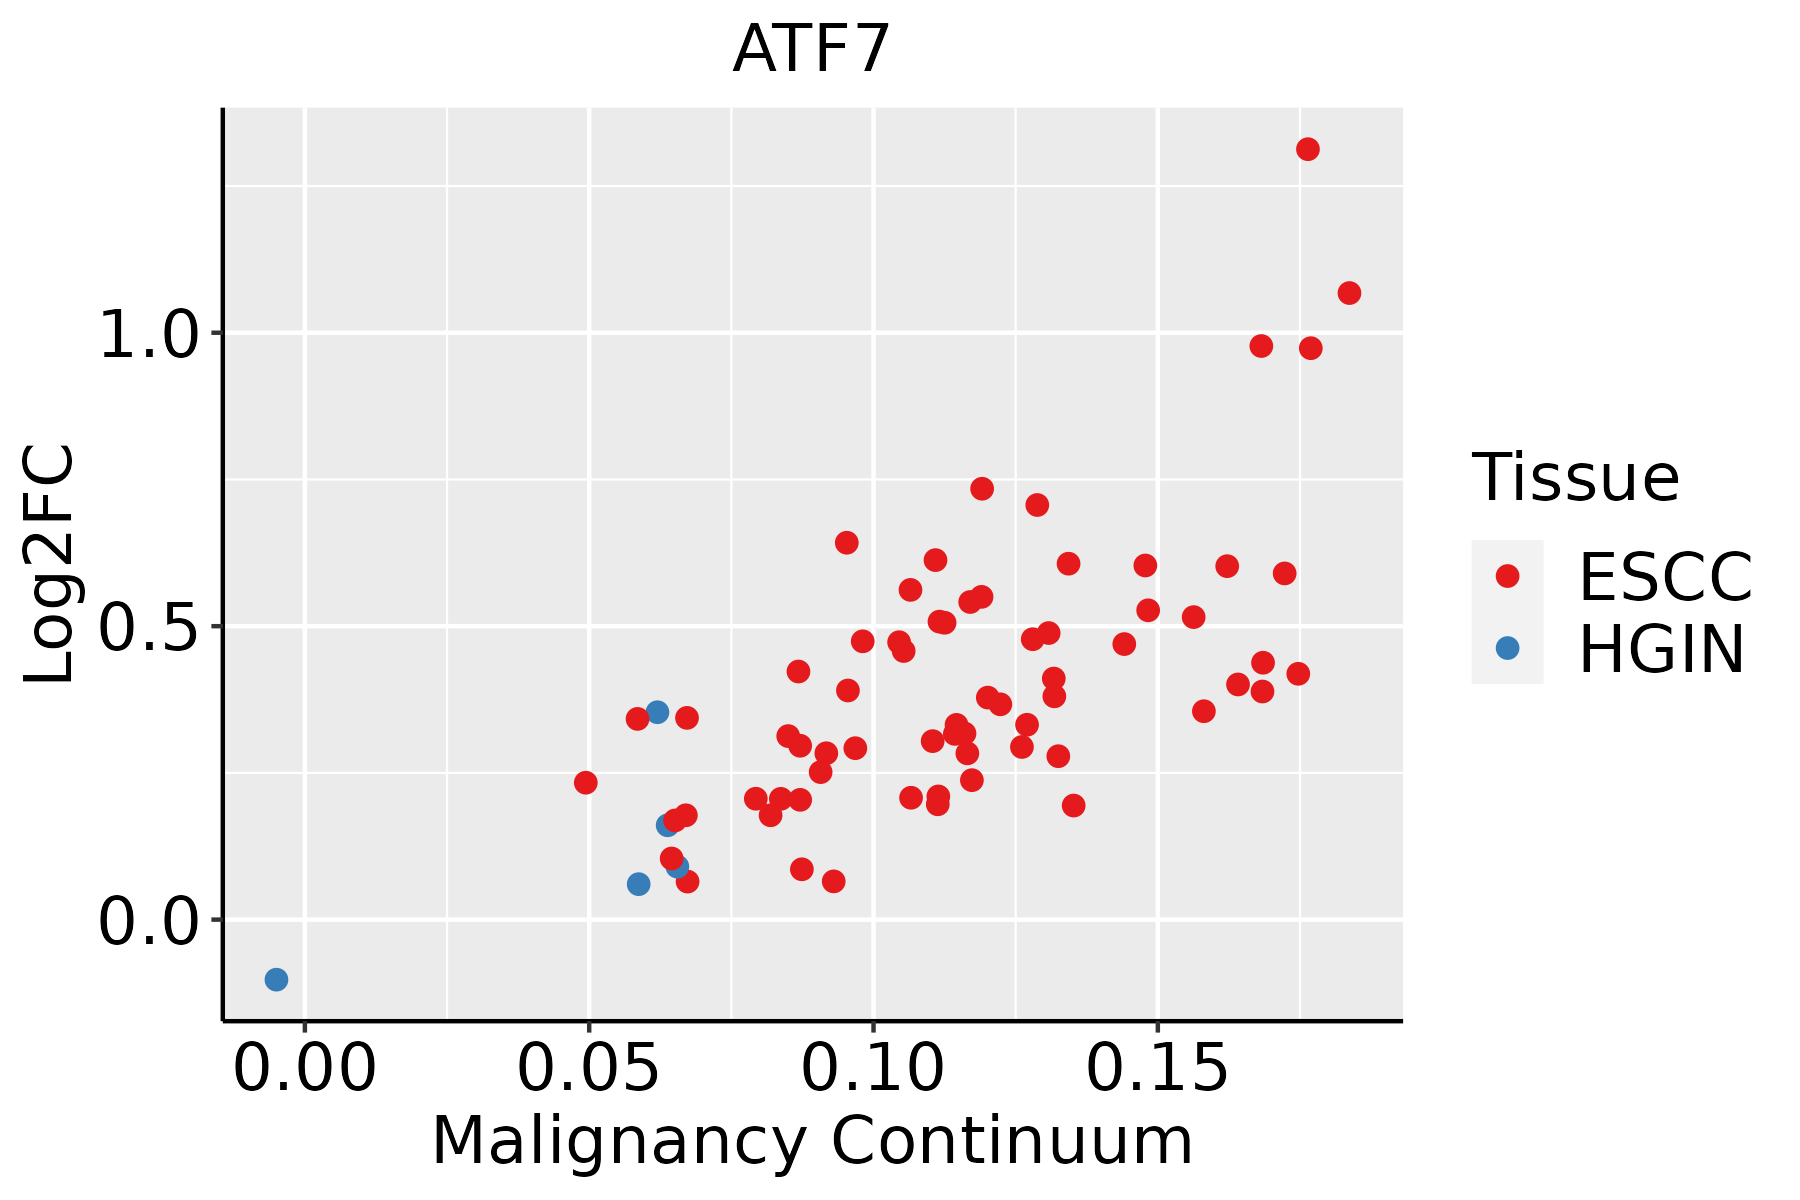
ESCC: Esophageal squamous cell carcinoma
HGIN: High-grade intraepithelial neoplasias
LGIN: Low-grade intraepithelial neoplasias
LiverThe image shows the transcriptomic changes along malignancy continuum.log2FC in expression of this searched gene in stem-like cells from each diseased tissue sample relative to stem-like cells in normal samples in each tissue plotted against the malignancy continuum. Samples are colored based on if they are from different disease stage.
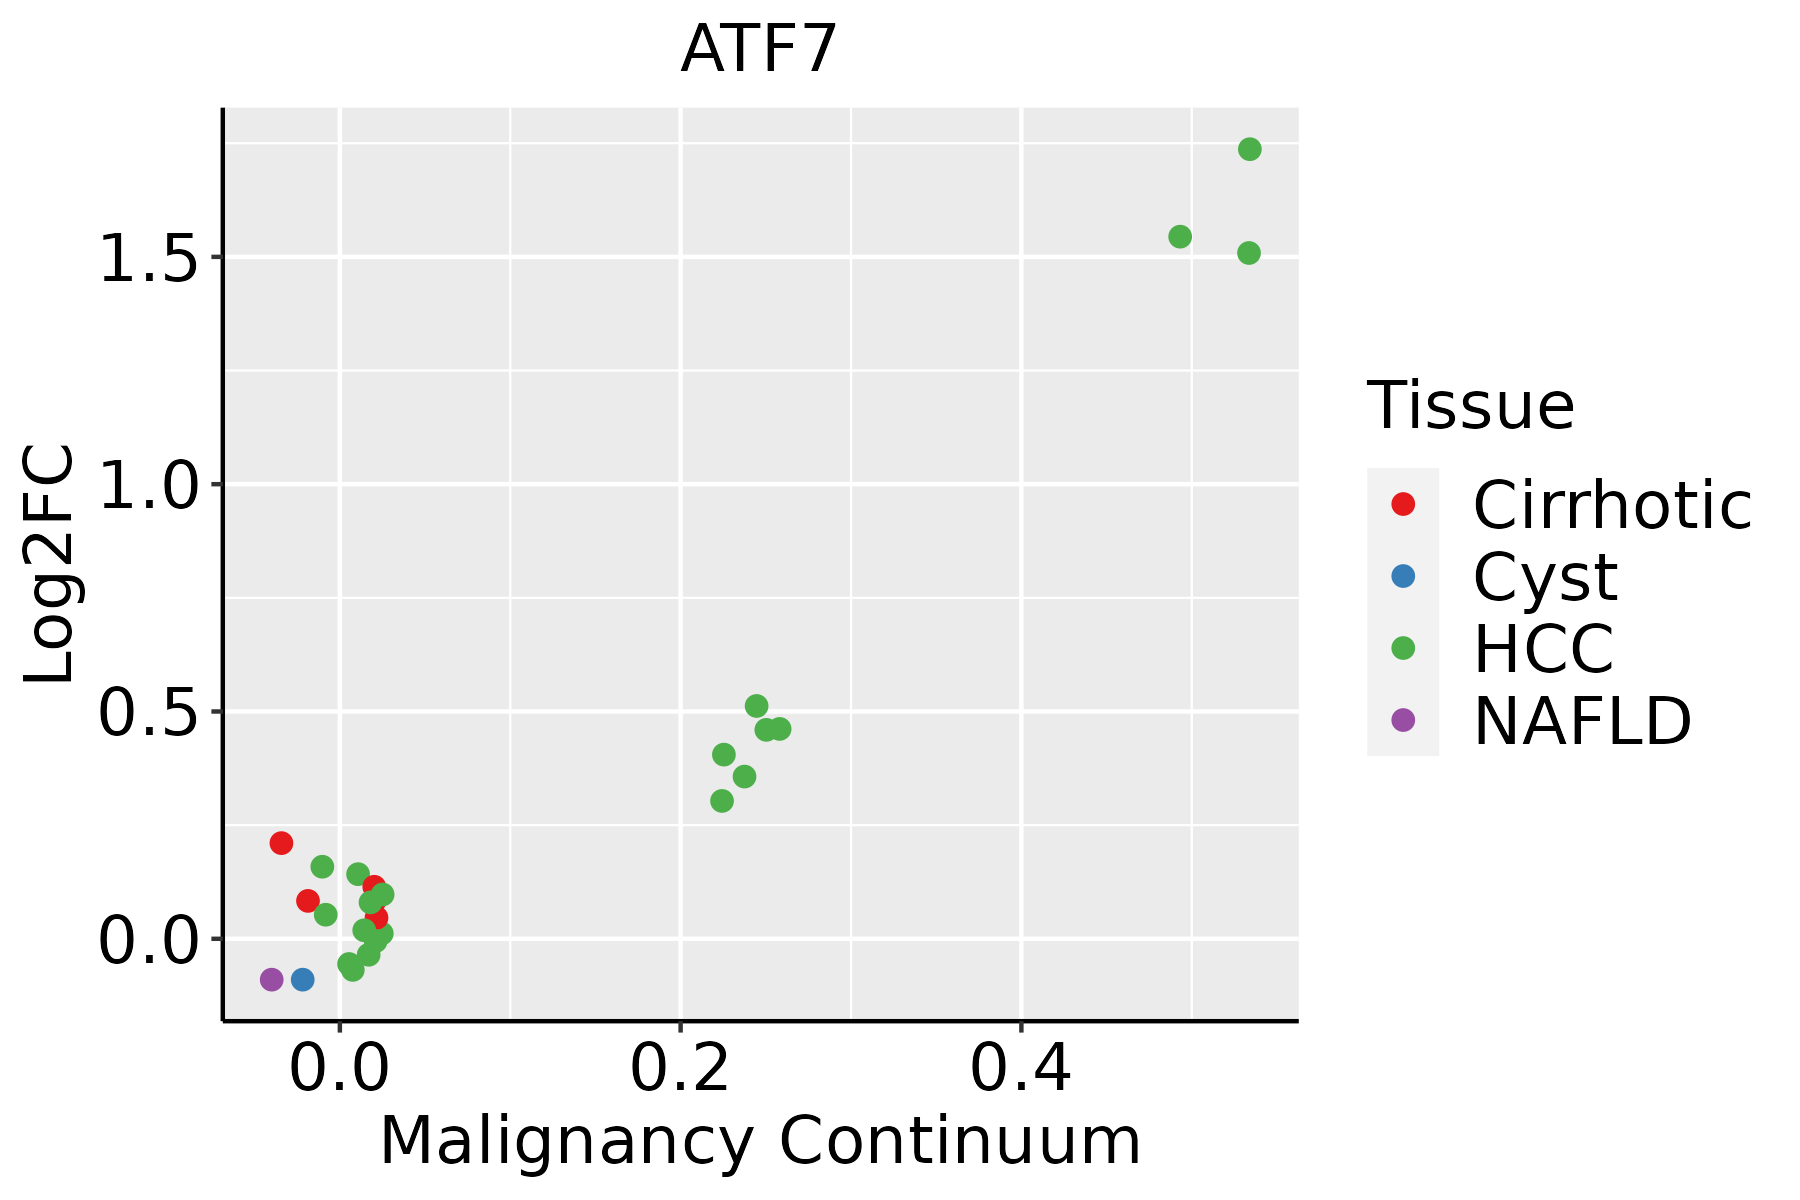
HCC: Hepatocellular carcinoma
NAFLD: Non-alcoholic fatty liver disease
LungThe image shows the transcriptomic changes along malignancy continuum.log2FC in expression of this searched gene in stem-like cells from each diseased tissue sample relative to stem-like cells in normal samples in each tissue plotted against the malignancy continuum. Samples are colored based on if they are from different disease stage.
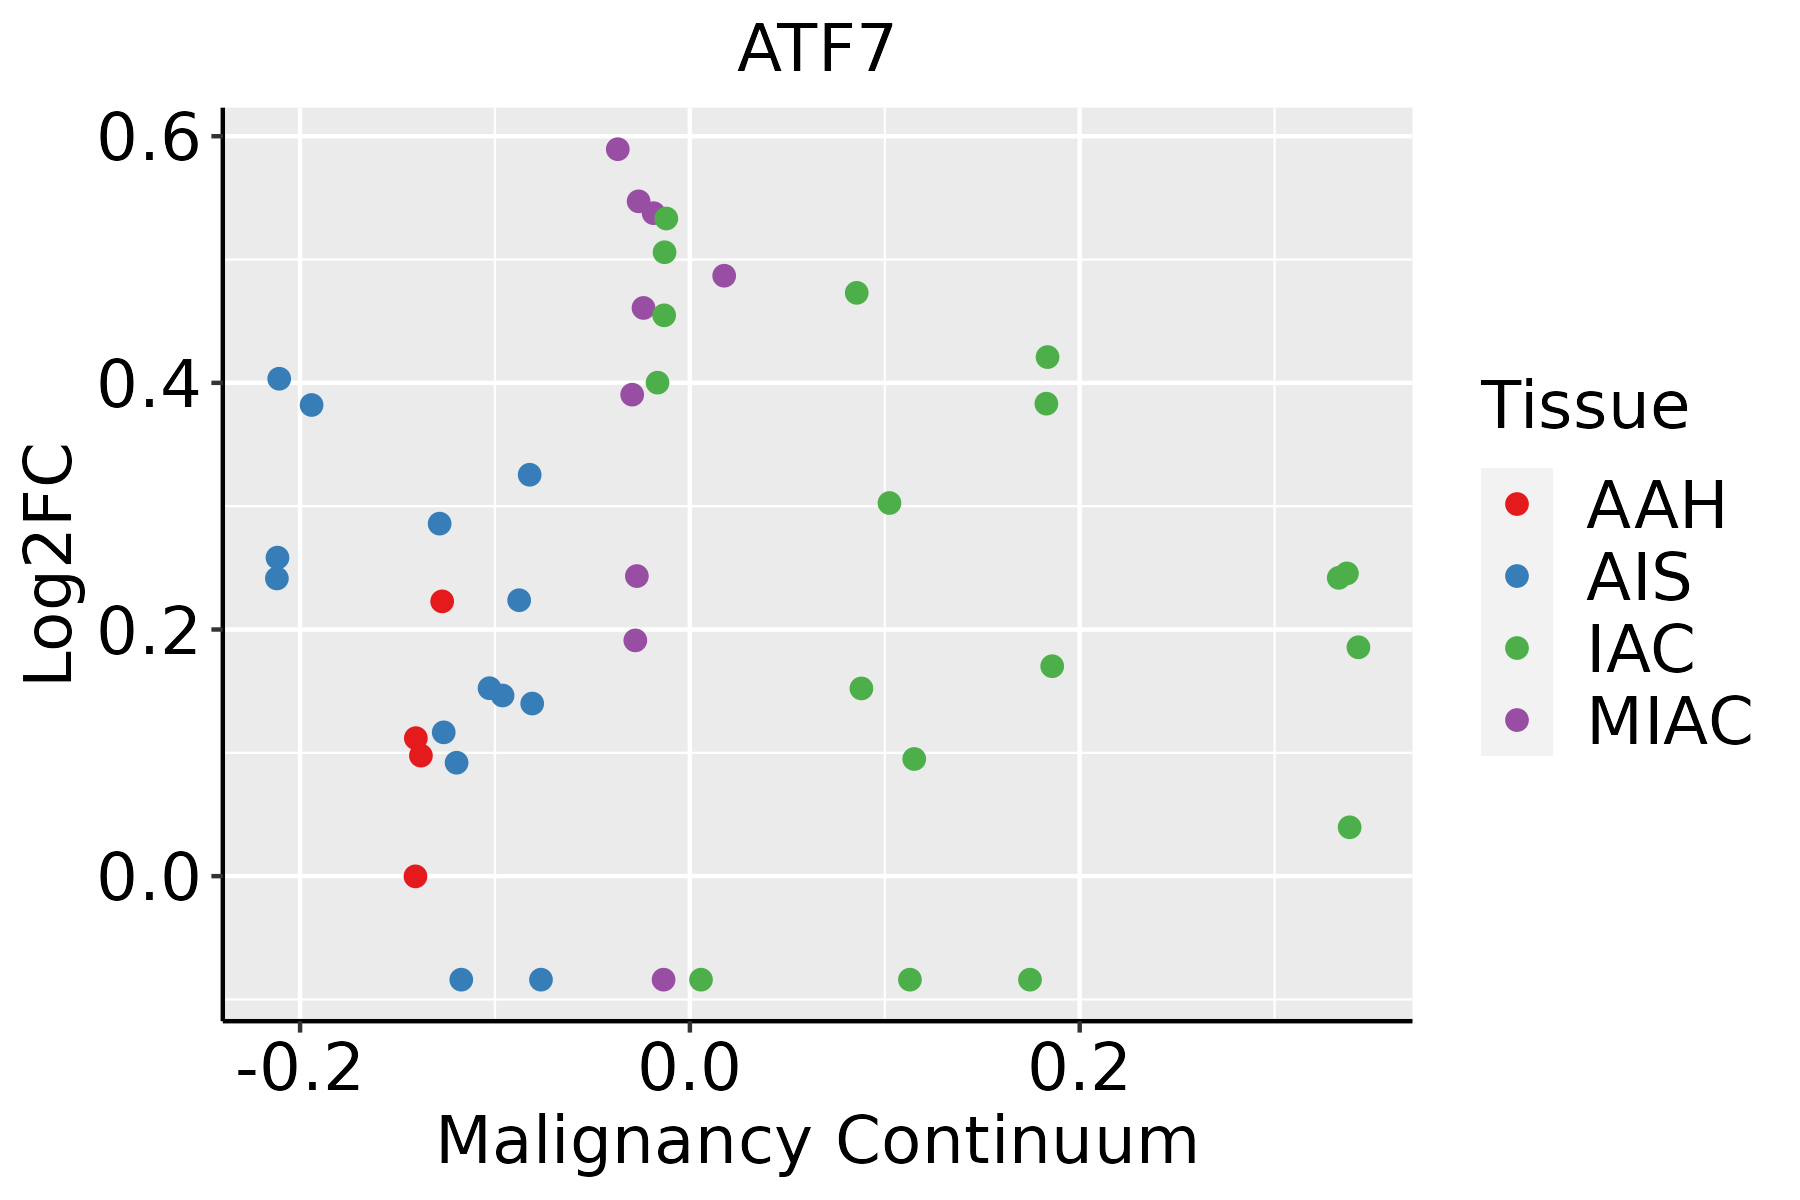
AAH: Atypical adenomatous hyperplasia
AIS: Adenocarcinoma in situ
IAC: Invasive lung adenocarcinoma
MIA: Minimally invasive adenocarcinoma
Oral CavityThe image shows the transcriptomic changes along malignancy continuum.log2FC in expression of this searched gene in stem-like cells from each diseased tissue sample relative to stem-like cells in normal samples in each tissue plotted against the malignancy continuum. Samples are colored based on if they are from different disease stage.
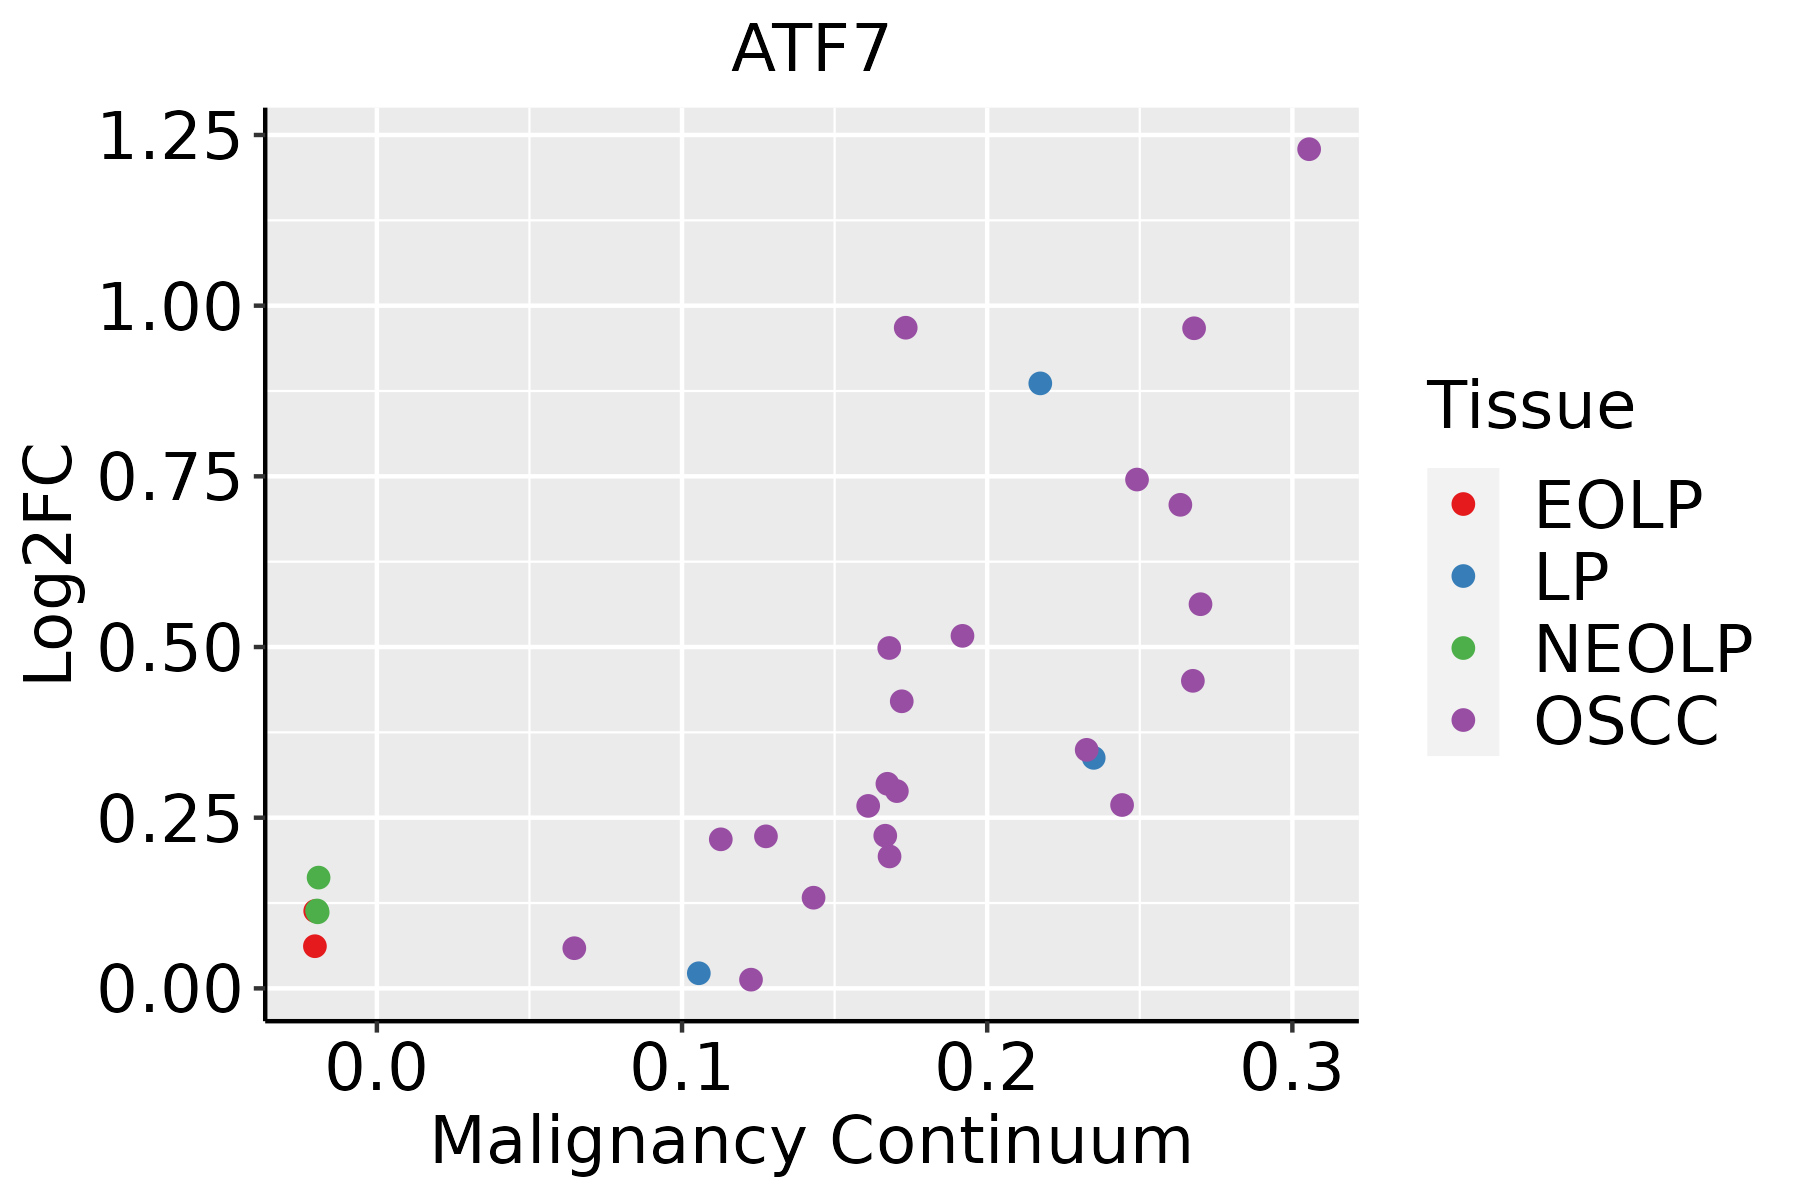
EOLP: Erosive Oral lichen planus
LP: leukoplakia
NEOLP: Non-erosive oral lichen planus
OSCC: Oral squamous cell carcinoma
ThyroidThe image shows the transcriptomic changes along malignancy continuum.log2FC in expression of this searched gene in stem-like cells from each diseased tissue sample relative to stem-like cells in normal samples in each tissue plotted against the malignancy continuum. Samples are colored based on if they are from different disease stage.
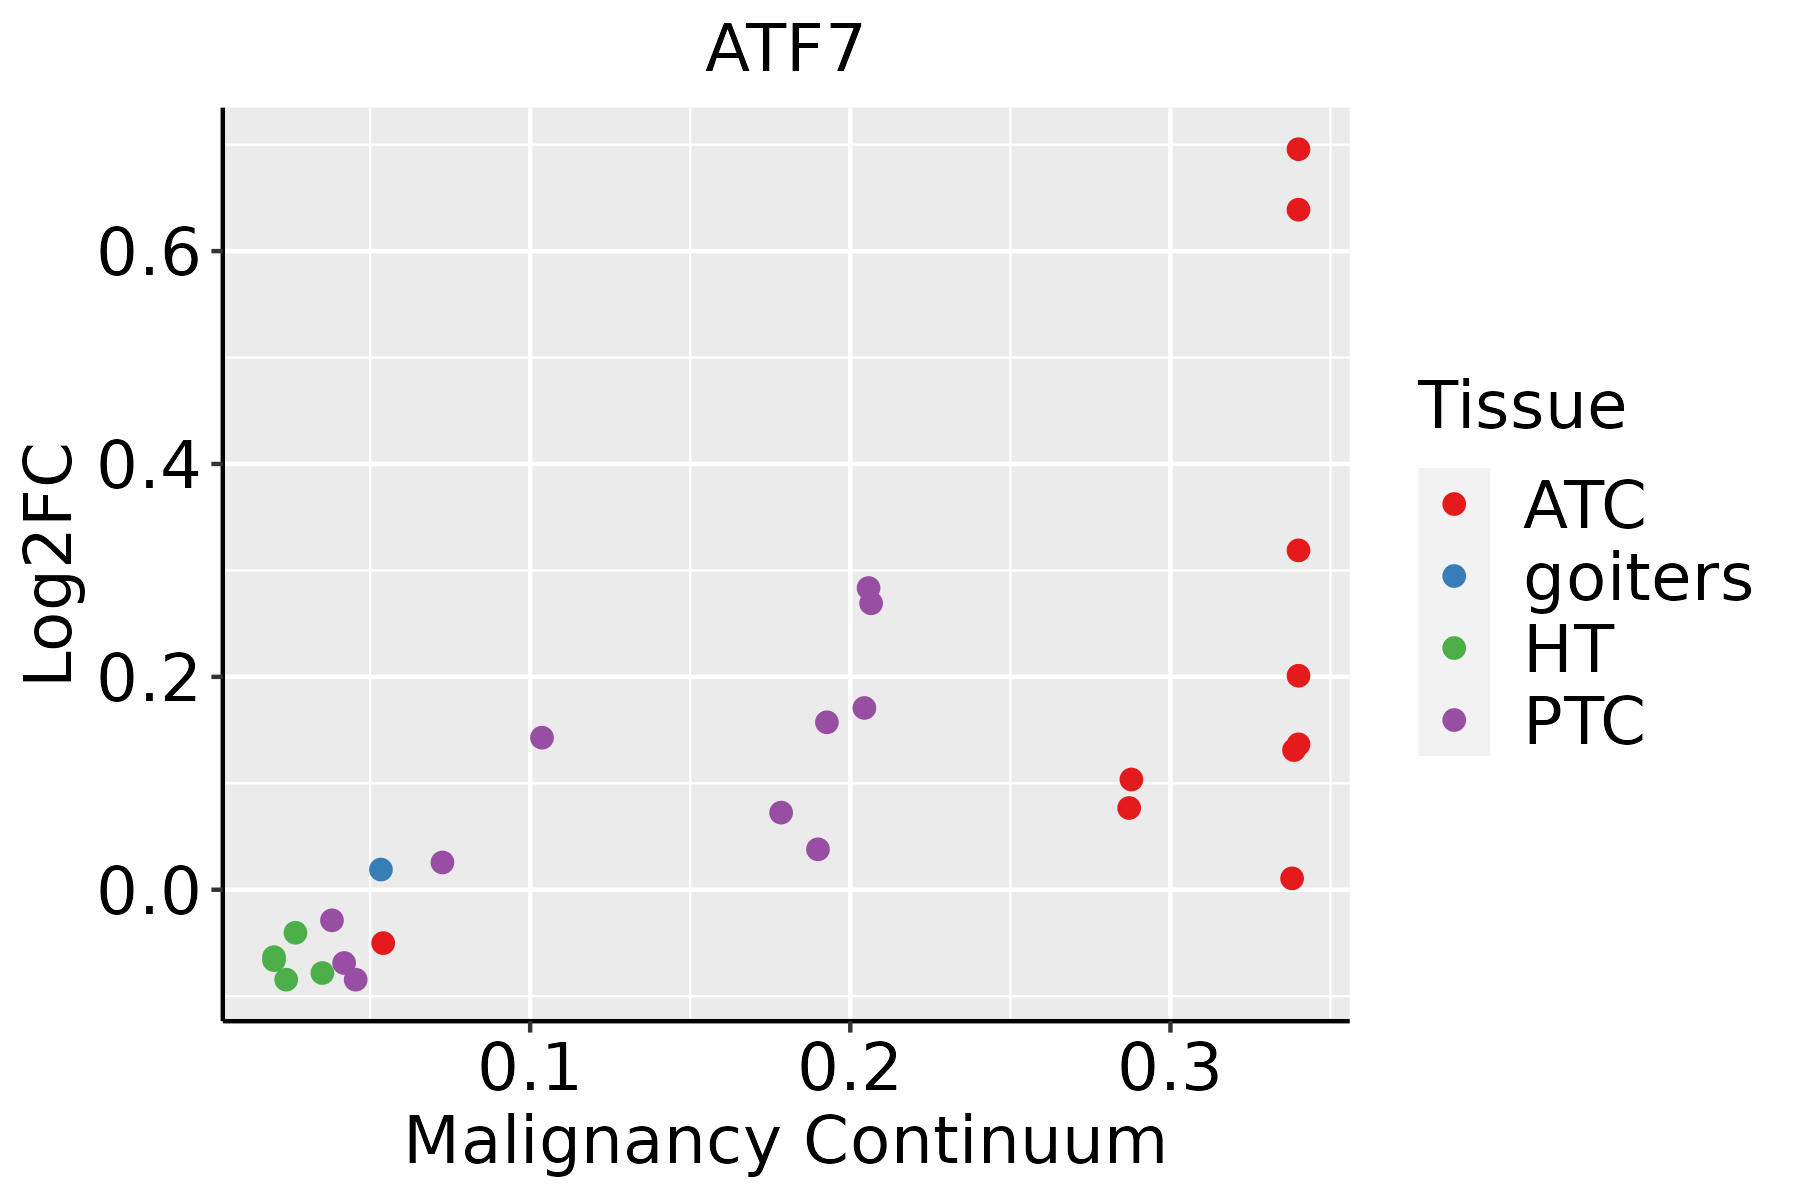
ATC: Anaplastic thyroid cancer
HT: Hashimoto's thyroiditis
PTC: Papillary thyroid cancer
∗log2FC in expression of this searched gene in stem-like cells from each diseased tissue sample relative to stem-like cells in normal samples in each tissue plotted against the malignancy continuum. Samples are colored based on if they are from different disease stage.

Top

Malignant transformation related pathway analysis

check buttonFind out the enriched GO biological processes and KEGG pathways involved in transition from healthy to precancer to cancer
check button Figure of enriched GO biological processes.
TissueDisease StageEnriched GO biological Processes
ColorectumADGO analysis - Figure of enriched GO biological processes: Top 15 enriched GO BP terms are showed in the bar plot of each disease state in each tissue. Each row represents a significant GO biological process which is colored according to the -log10(p.adjust).
ColorectumSERGO analysis - Figure of enriched GO biological processes: Top 15 enriched GO BP terms are showed in the bar plot of each disease state in each tissue. Each row represents a significant GO biological process which is colored according to the -log10(p.adjust).
ColorectumMSSGO analysis - Figure of enriched GO biological processes: Top 15 enriched GO BP terms are showed in the bar plot of each disease state in each tissue. Each row represents a significant GO biological process which is colored according to the -log10(p.adjust).
ColorectumMSI-HGO analysis - Figure of enriched GO biological processes: Top 15 enriched GO BP terms are showed in the bar plot of each disease state in each tissue. Each row represents a significant GO biological process which is colored according to the -log10(p.adjust).
ColorectumFAPGO analysis - Figure of enriched GO biological processes: Top 15 enriched GO BP terms are showed in the bar plot of each disease state in each tissue. Each row represents a significant GO biological process which is colored according to the -log10(p.adjust).
∗Top 15 enriched GO BP terms are showed in the bar plot of each disease state in each tissue. Each row represents a significant GO biological process which is colored according to the -log10(p.adjust).
Page: 1 2 3 4 5 6 7 8 9 

check button Enriched GO biological processes.
GO IDTissueDisease StageDescriptionGene RatioBg Ratiopvaluep.adjustCount
GO:004325410CervixCCregulation of protein-containing complex assembly96/2311428/187232.91e-093.05e-0796
GO:003164710CervixCCregulation of protein stability63/2311298/187231.14e-052.45e-0463
GO:00063257CervixCCchromatin organization78/2311409/187235.40e-058.02e-0478
GO:005082110CervixCCprotein stabilization43/2311191/187235.90e-058.54e-0443
GO:0031647111EsophagusESCCregulation of protein stability223/8552298/187235.76e-251.52e-22223
GO:003304416EsophagusESCCregulation of chromosome organization145/8552187/187233.80e-194.31e-17145
GO:0043254111EsophagusESCCregulation of protein-containing complex assembly278/8552428/187233.81e-162.77e-14278
GO:0050821111EsophagusESCCprotein stabilization140/8552191/187236.50e-153.61e-13140
GO:00434143EsophagusESCCmacromolecule methylation199/8552316/187233.44e-109.57e-09199
GO:200125219EsophagusESCCpositive regulation of chromosome organization64/855282/187231.98e-094.52e-0864
GO:00322592EsophagusESCCmethylation222/8552364/187232.26e-095.09e-08222
GO:000632517EsophagusESCCchromatin organization240/8552409/187236.52e-081.14e-06240
GO:00400295EsophagusESCCregulation of gene expression, epigenetic74/8552105/187232.24e-073.42e-0674
GO:00063673EsophagusESCCtranscription initiation from RNA polymerase II promoter56/855277/187231.30e-061.59e-0556
GO:000635211EsophagusESCCDNA-templated transcription, initiation86/8552130/187231.88e-062.19e-0586
GO:00708973EsophagusESCCtranscription preinitiation complex assembly30/855236/187233.60e-063.95e-0530
GO:00602603EsophagusESCCregulation of transcription initiation from RNA polymerase II promoter25/855233/187234.30e-042.43e-0325
GO:200014212EsophagusESCCregulation of DNA-templated transcription, initiation29/855240/187235.32e-042.93e-0329
GO:00708281EsophagusESCCheterochromatin organization31/855246/187232.42e-031.06e-0231
GO:00511232EsophagusESCCRNA polymerase II preinitiation complex assembly18/855224/187233.43e-031.41e-0218
Page: 1 2 3 4 5 6 7 8 9 10 

check button Enriched KEGG pathways.
Pathway IDTissueDisease StageDescriptionGene RatioBg Ratiopvaluep.adjustqvalueCount
Page: 1 

Top

Cell-cell communication analysis

check buttonIdentification of potential cell-cell interactions between two cell types and their ligand-receptor pairs for different disease states
LigandReceptorLRpairPathwayTissueDisease Stage
Page: 1 

Top

Single-cell gene regulatory network inference analysis

check buttonFind out the significant the regulons (TFs) and the target genes of each regulon across cell types for different disease states
TFCell TypeTissueDisease StageTarget GeneRSSRegulon Activity
ATF7MSCEsophagusHealthyMAP2,ZNF554,NCK1-AS1, etc.9.64e-03The dot plots of a searched regulon are shown for all cell subpopulations in each disease state of each tissue based on the regulon specific score inferred using pySCENIC and by calculating the average expression.
ATF7CD8TEFFProstateADJDCAF17,VSIG10,NFYA, etc.2.58e-02The dot plots of a searched regulon are shown for all cell subpopulations in each disease state of each tissue based on the regulon specific score inferred using pySCENIC and by calculating the average expression.
∗The dot plots of a searched regulon are shown for all cell subpopulations in each disease state of each tissue based on the regulon specific score inferred using pySCENIC and by calculating the average expression.
Page: 1 

Top

Somatic mutation of malignant transformation related genes

check buttonAnnotation of somatic variants for genes involved in malignant transformation
Hugo SymbolVariant ClassVariant ClassificationdbSNP RSHGVScHGVSpHGVSp ShortSWISSPROTBIOTYPESIFTPolyPhenTumor Sample BarcodeTissueHistologySexAgeStageTherapy TypesDrugsOutcome
ATF7SNVMissense_Mutationrs754866750c.733A>Cp.Ile245Leup.I245LP17544protein_codingtolerated(0.66)benign(0)TCGA-A2-A1G4-01Breastbreast invasive carcinomaFemale>=65III/IVChemotherapyadriamycinSD
ATF7SNVMissense_Mutationrs754866750c.733N>Cp.Ile245Leup.I245LP17544protein_codingtolerated(0.66)benign(0)TCGA-AN-A0XR-01Breastbreast invasive carcinomaFemale<65III/IVUnknownUnknownSD
ATF7SNVMissense_Mutationrs754866750c.733A>Cp.Ile245Leup.I245LP17544protein_codingtolerated(0.66)benign(0)TCGA-B6-A1KN-01Breastbreast invasive carcinomaFemale<65III/IVUnknownUnknownSD
ATF7SNVMissense_Mutationrs764112606c.896N>Cp.His299Prop.H299PP17544protein_codingdeleterious(0.03)benign(0.133)TCGA-BH-A0B7-01Breastbreast invasive carcinomaFemale<65I/IIChemotherapyadriamycinCR
ATF7SNVMissense_Mutationrs754866750c.733A>Cp.Ile245Leup.I245LP17544protein_codingtolerated(0.66)benign(0)TCGA-BH-A1FH-01Breastbreast invasive carcinomaFemale<65III/IVUnknownUnknownPD
ATF7SNVMissense_Mutationrs754866750c.733A>Cp.Ile245Leup.I245LP17544protein_codingtolerated(0.66)benign(0)TCGA-C8-A273-01Breastbreast invasive carcinomaFemale<65I/IIHormone TherapytamoxiphenSD
ATF7SNVMissense_Mutationrs754866750c.733N>Cp.Ile245Leup.I245LP17544protein_codingtolerated(0.66)benign(0)TCGA-D8-A1JK-01Breastbreast invasive carcinomaFemale>=65I/IIUnknownUnknownSD
ATF7SNVMissense_Mutationrs754866750c.733A>Cp.Ile245Leup.I245LP17544protein_codingtolerated(0.66)benign(0)TCGA-D8-A1JT-01Breastbreast invasive carcinomaFemale>=65I/IIHormone TherapyarimidexSD
ATF7SNVMissense_Mutationrs754866750c.733A>Cp.Ile245Leup.I245LP17544protein_codingtolerated(0.66)benign(0)TCGA-D8-A1XG-01Breastbreast invasive carcinomaFemale>=65III/IVUnknownUnknownSD
ATF7SNVMissense_Mutationc.61N>Cp.Glu21Glnp.E21QP17544protein_codingdeleterious(0)probably_damaging(0.983)TCGA-E2-A1L7-01Breastbreast invasive carcinomaFemale<65III/IVChemotherapycyclophosphamidePD
Page: 1 2 3 4 5 

Top

Related drugs of malignant transformation related genes

check buttonIdentification of chemicals and drugs interact with genes involved in malignant transfromation
(DGIdb 4.0)
Entrez IDSymbolCategoryInteraction TypesDrug Claim NameDrug NamePMIDs
Page: 1