
|
|||||
|
 | |
| |
| |
| |
| |
| |
|
Gene: ARHGDIB |
Gene summary for ARHGDIB |
| Gene information | Species | Human | Gene symbol | ARHGDIB | Gene ID | 397 |
| Gene name | Rho GDP dissociation inhibitor beta | |
| Gene Alias | D4 | |
| Cytomap | 12p12.3 | |
| Gene Type | protein-coding | GO ID | GO:0000003 | UniProtAcc | A0A024RAS5 |
Top |
Malignant transformation analysis |
| Identification of the aberrant gene expression in precancerous and cancerous lesions by comparing the gene expression of stem-like cells in diseased tissues with normal stem cells |
| Entrez ID | Symbol | Replicates | Species | Organ | Tissue | Adj P-value | Log2FC | Malignancy |
| 397 | ARHGDIB | GSM5252133_BPH389PrSF | Human | Prostate | BPH | 1.44e-02 | 5.55e-01 | -0.2027 |
| 397 | ARHGDIB | GSM5252135_BPH511PrPUr_Fcol_3GEX | Human | Prostate | BPH | 2.53e-02 | 2.62e-01 | -0.1833 |
| 397 | ARHGDIB | 047563_1562-all-cells | Human | Prostate | BPH | 4.37e-05 | 2.38e-01 | 0.0791 |
| 397 | ARHGDIB | Dong_P1 | Human | Prostate | Tumor | 2.85e-25 | 2.94e-01 | 0.035 |
| 397 | ARHGDIB | Dong_P3 | Human | Prostate | Tumor | 3.27e-24 | 4.51e-01 | 0.0278 |
| 397 | ARHGDIB | Dong_P5 | Human | Prostate | Tumor | 2.77e-05 | 1.11e-01 | 0.053 |
| 397 | ARHGDIB | GSM5353216_PA_PB1A_Pool_1_3_S50_L002 | Human | Prostate | Tumor | 4.89e-02 | 6.04e-01 | 0.159 |
| 397 | ARHGDIB | GSM5353221_PA_PB2A_Pool_1_3_S25_L001 | Human | Prostate | Tumor | 4.24e-02 | 3.96e-01 | 0.1633 |
| 397 | ARHGDIB | GSM5353225_PA_PR5196-1_Pool_1_2_3_S53_L002 | Human | Prostate | Tumor | 1.33e-02 | 5.36e-01 | 0.1619 |
| 397 | ARHGDIB | GSM5353226_PA_PR5196-2_Pool_1_2_3_S54_L002 | Human | Prostate | Tumor | 2.09e-03 | 6.99e-01 | 0.159 |
| 397 | ARHGDIB | P2_S3_AK | Human | Skin | AK | 1.67e-02 | -2.54e-01 | -0.3287 |
| 397 | ARHGDIB | P1_cSCC | Human | Skin | cSCC | 5.82e-09 | 7.24e-01 | 0.0292 |
| 397 | ARHGDIB | P2_cSCC | Human | Skin | cSCC | 2.05e-09 | 6.97e-01 | -0.024 |
| 397 | ARHGDIB | P4_cSCC | Human | Skin | cSCC | 8.29e-21 | 8.15e-01 | -0.00290000000000005 |
| 397 | ARHGDIB | P10_cSCC | Human | Skin | cSCC | 2.57e-08 | 6.46e-01 | 0.1017 |
| 397 | ARHGDIB | cSCC_p7 | Human | Skin | cSCC | 4.55e-02 | -2.21e-01 | -0.2332 |
| 397 | ARHGDIB | cSCC_p9 | Human | Skin | cSCC | 7.52e-03 | 2.95e-02 | -0.1991 |
| 397 | ARHGDIB | Adj_PTCwithHT_6 | Human | Thyroid | HT | 1.60e-24 | 9.26e-01 | 0.02 |
| 397 | ARHGDIB | PTCwithHT_6 | Human | Thyroid | HT | 5.48e-19 | 8.88e-01 | 0.02 |
| 397 | ARHGDIB | PTCwithHT_8 | Human | Thyroid | HT | 5.02e-03 | 4.75e-01 | 0.0351 |
| Page: 1 2 3 4 5 6 7 |
| Tissue | Expression Dynamics | Abbreviation |
| Breast | 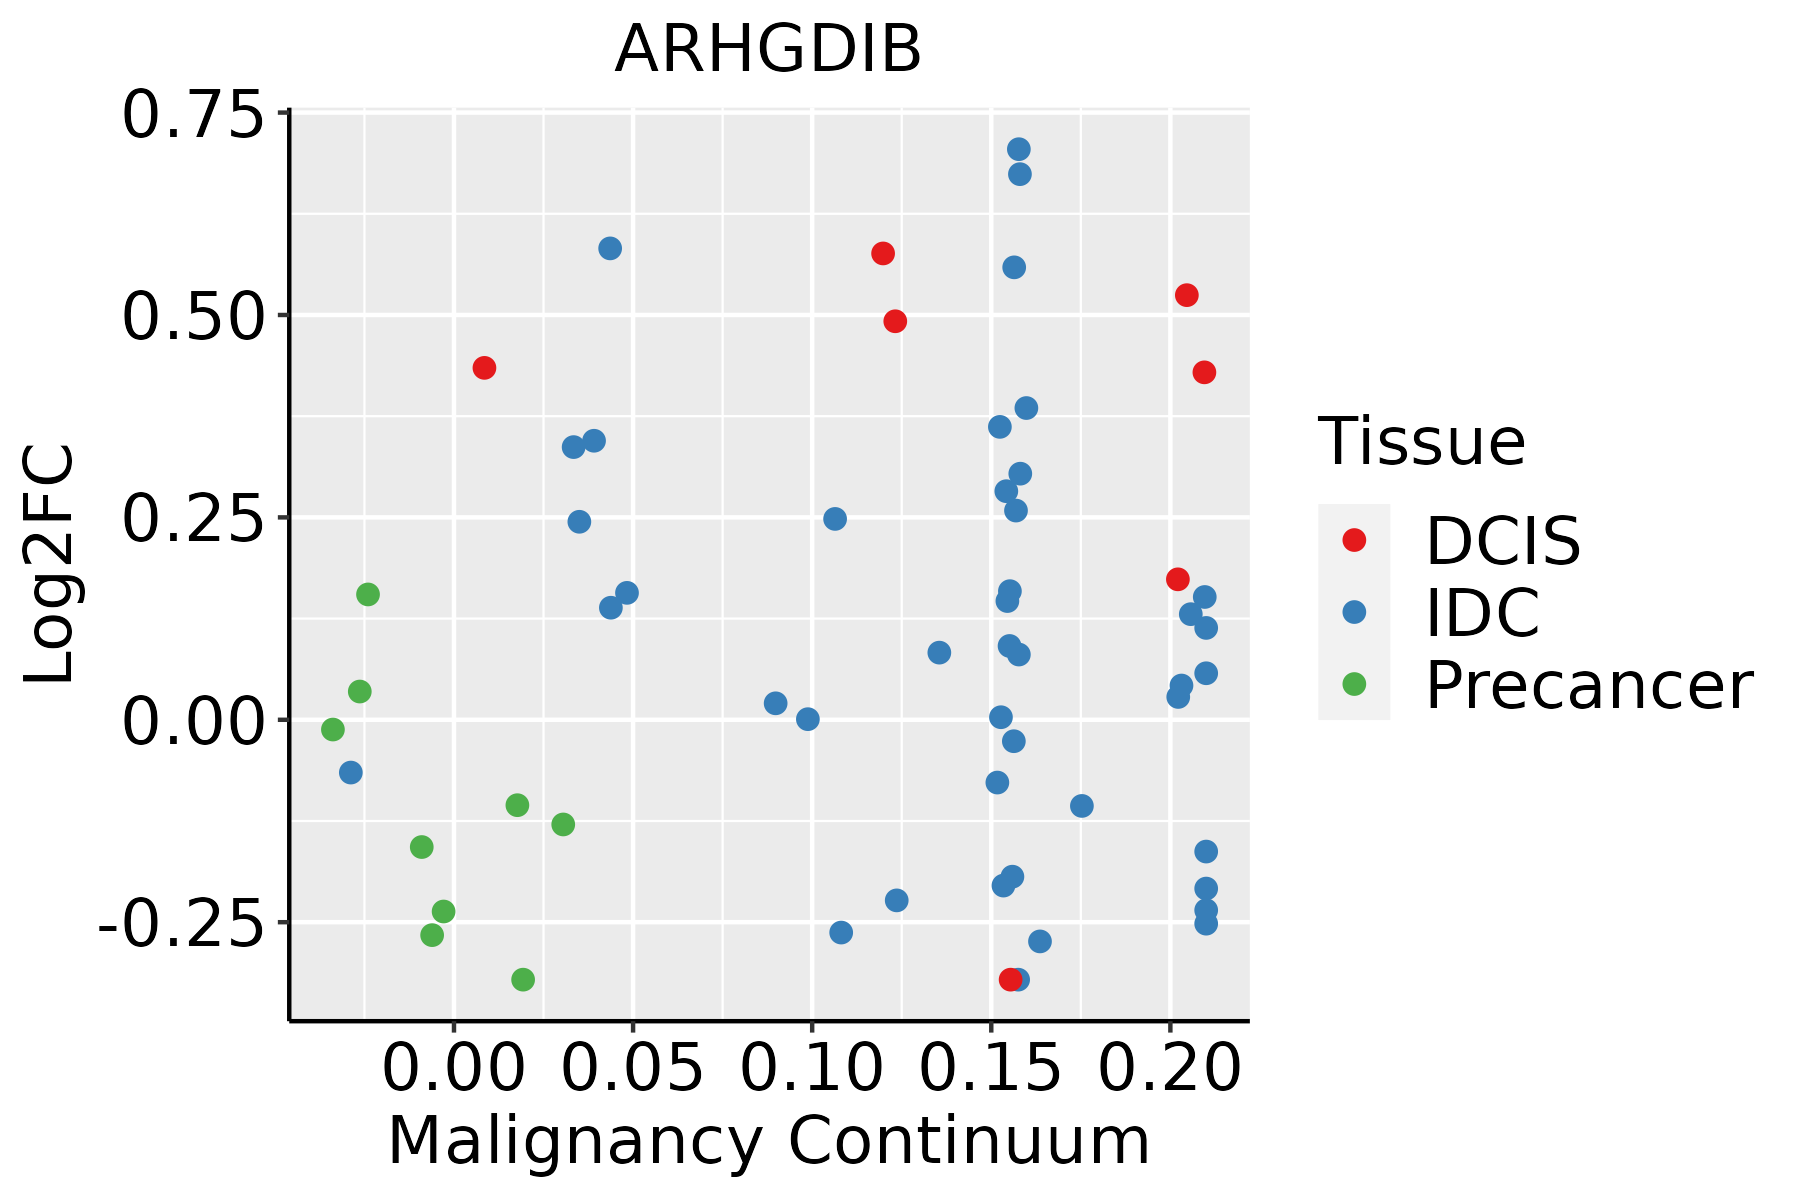 | IDC: Invasive ductal carcinoma |
| DCIS: Ductal carcinoma in situ | ||
| Precancer(BRCA1-mut): Precancerous lesion from BRCA1 mutation carriers | ||
| Cervix | 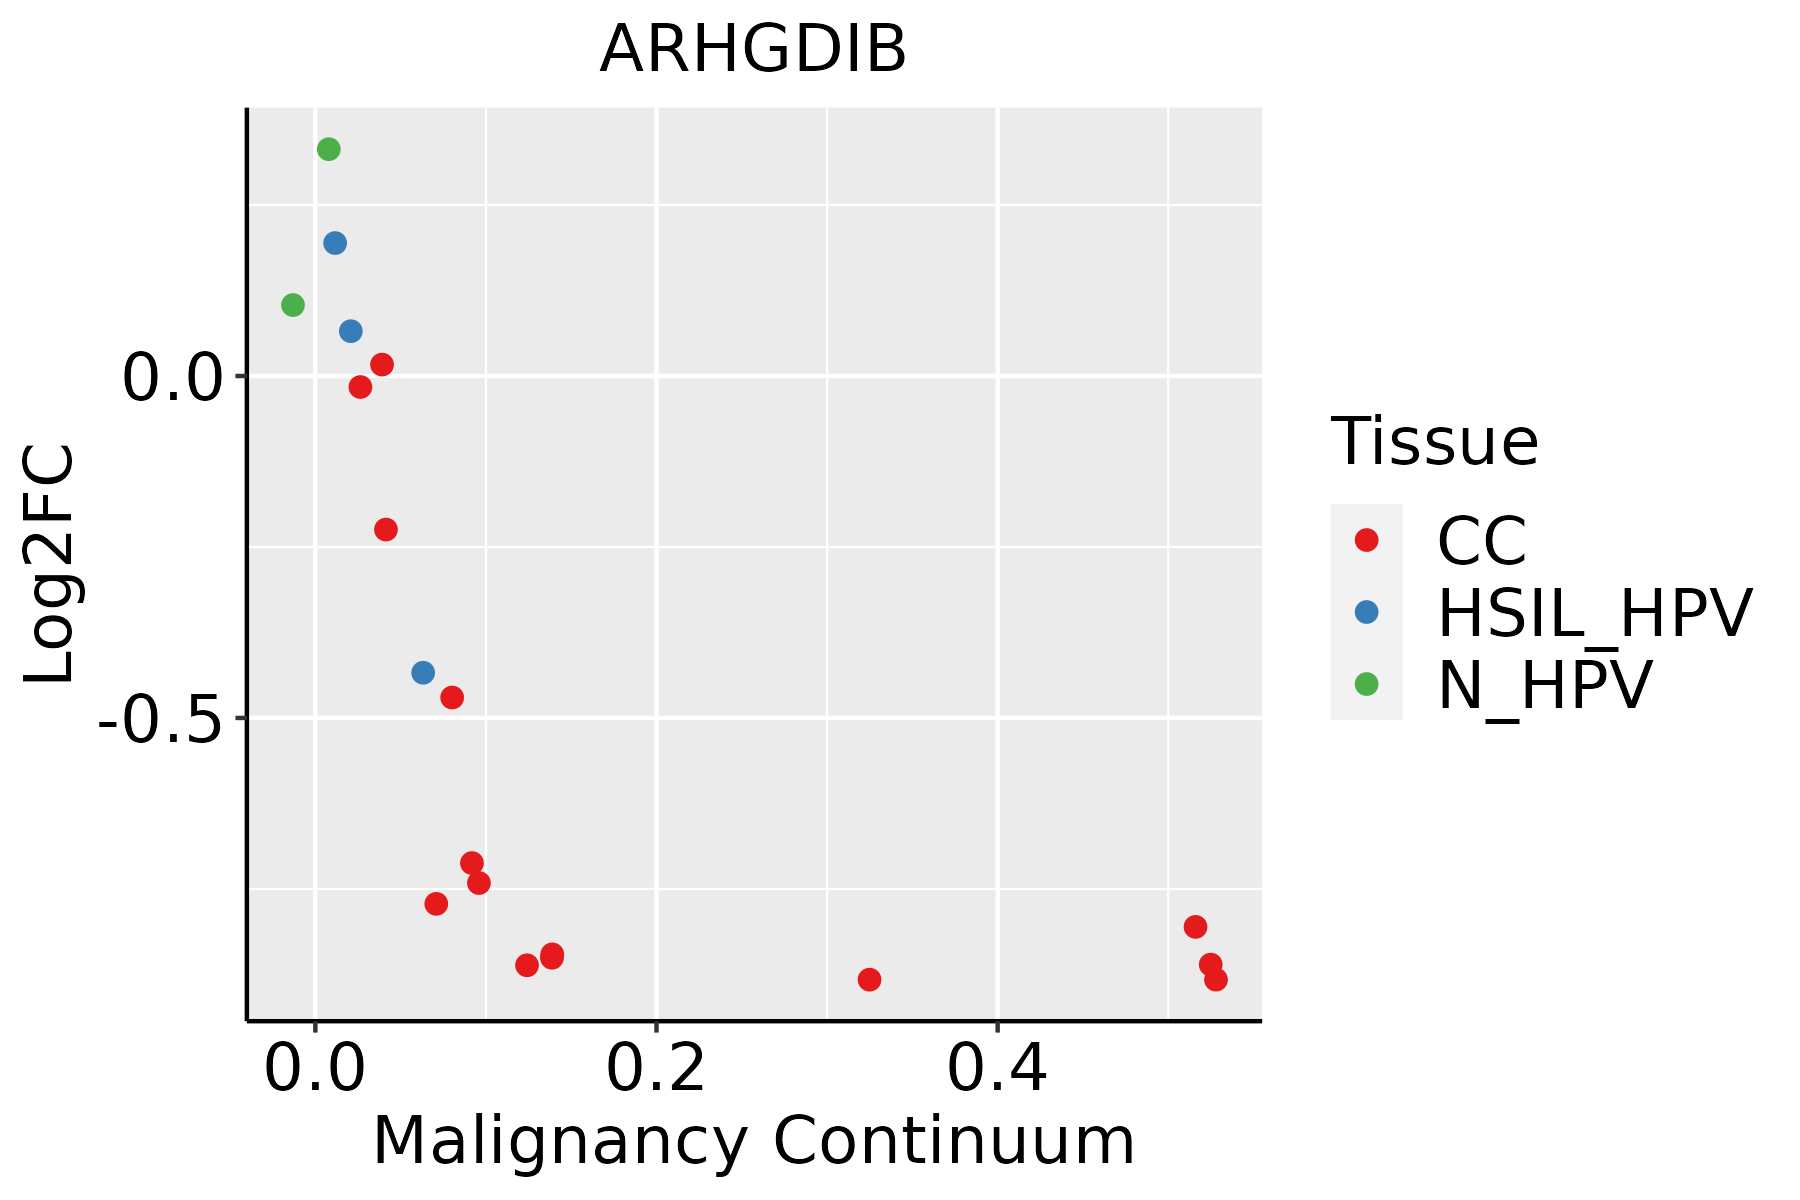 | CC: Cervix cancer |
| HSIL_HPV: HPV-infected high-grade squamous intraepithelial lesions | ||
| N_HPV: HPV-infected normal cervix | ||
| Esophagus | 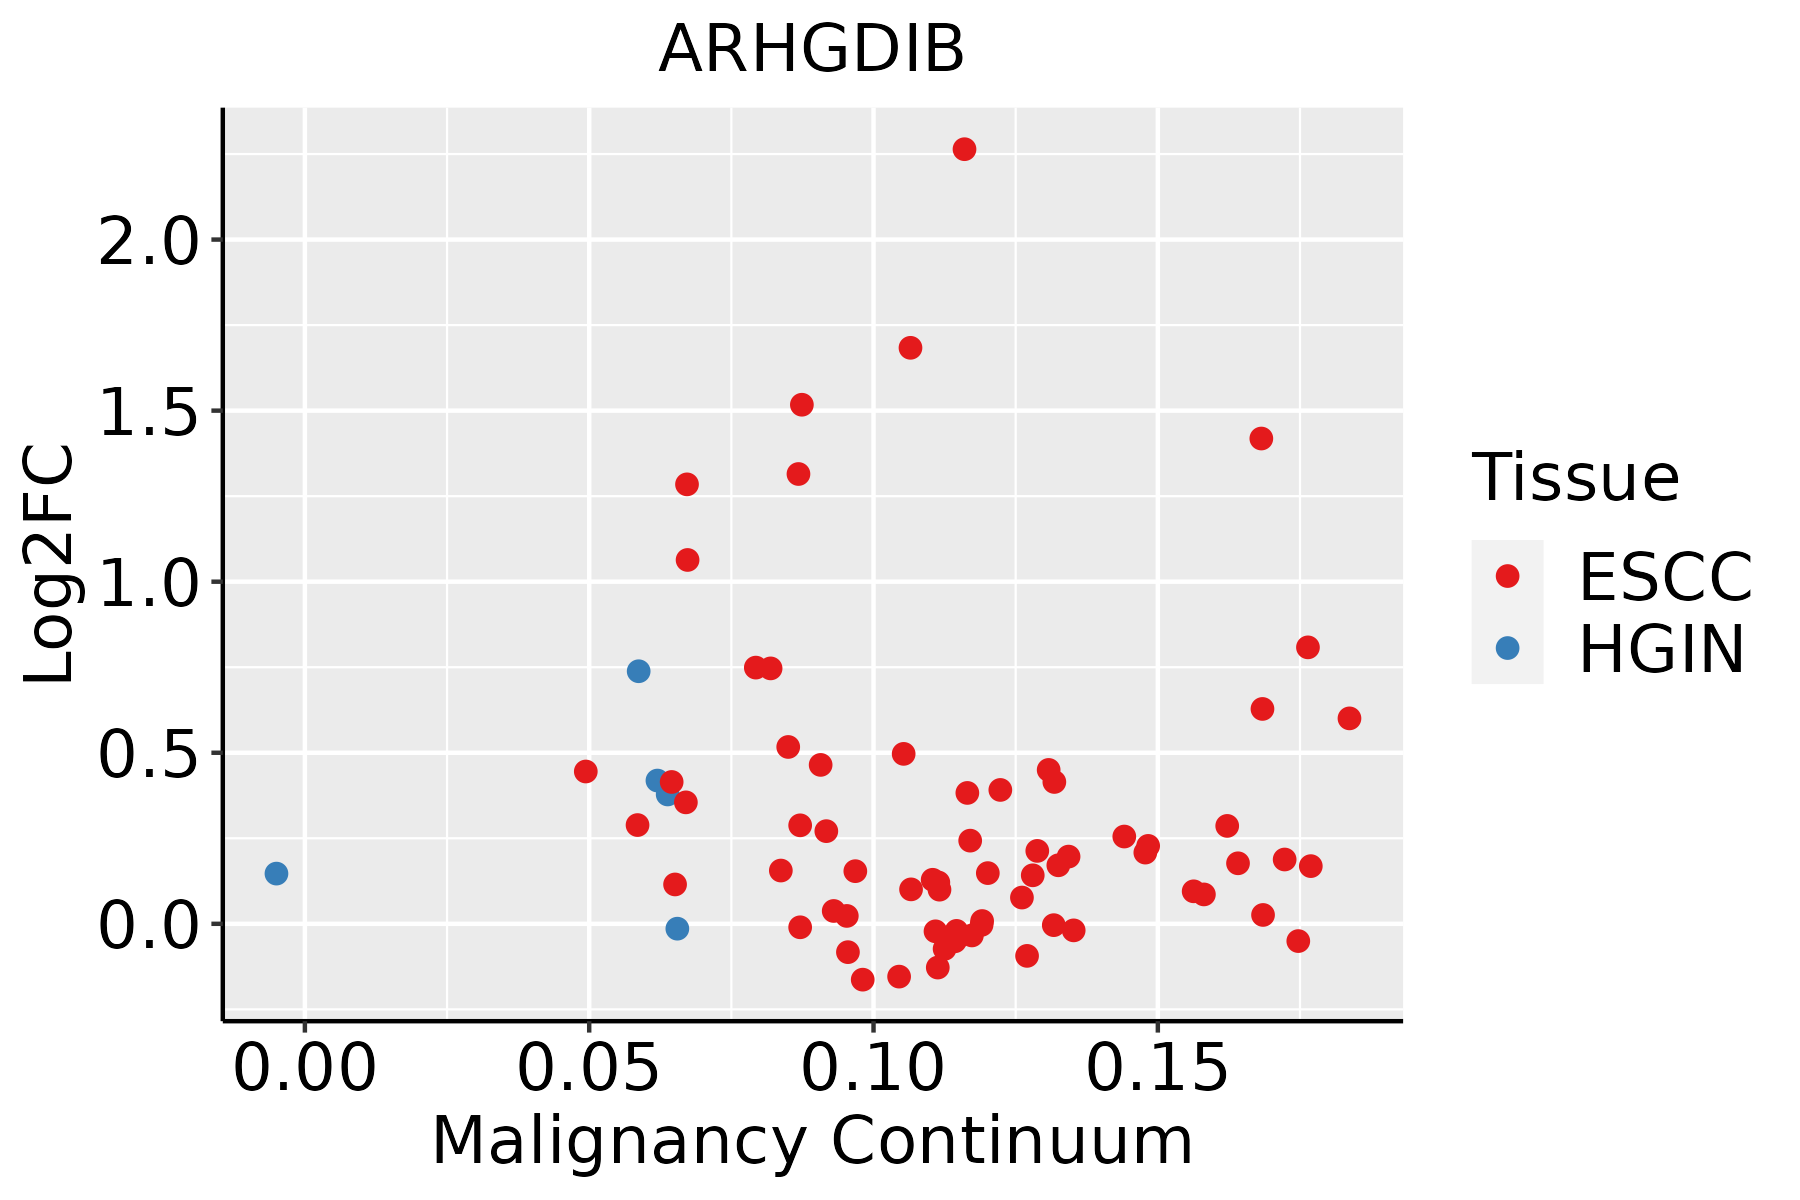 | ESCC: Esophageal squamous cell carcinoma |
| HGIN: High-grade intraepithelial neoplasias | ||
| LGIN: Low-grade intraepithelial neoplasias | ||
| Liver | 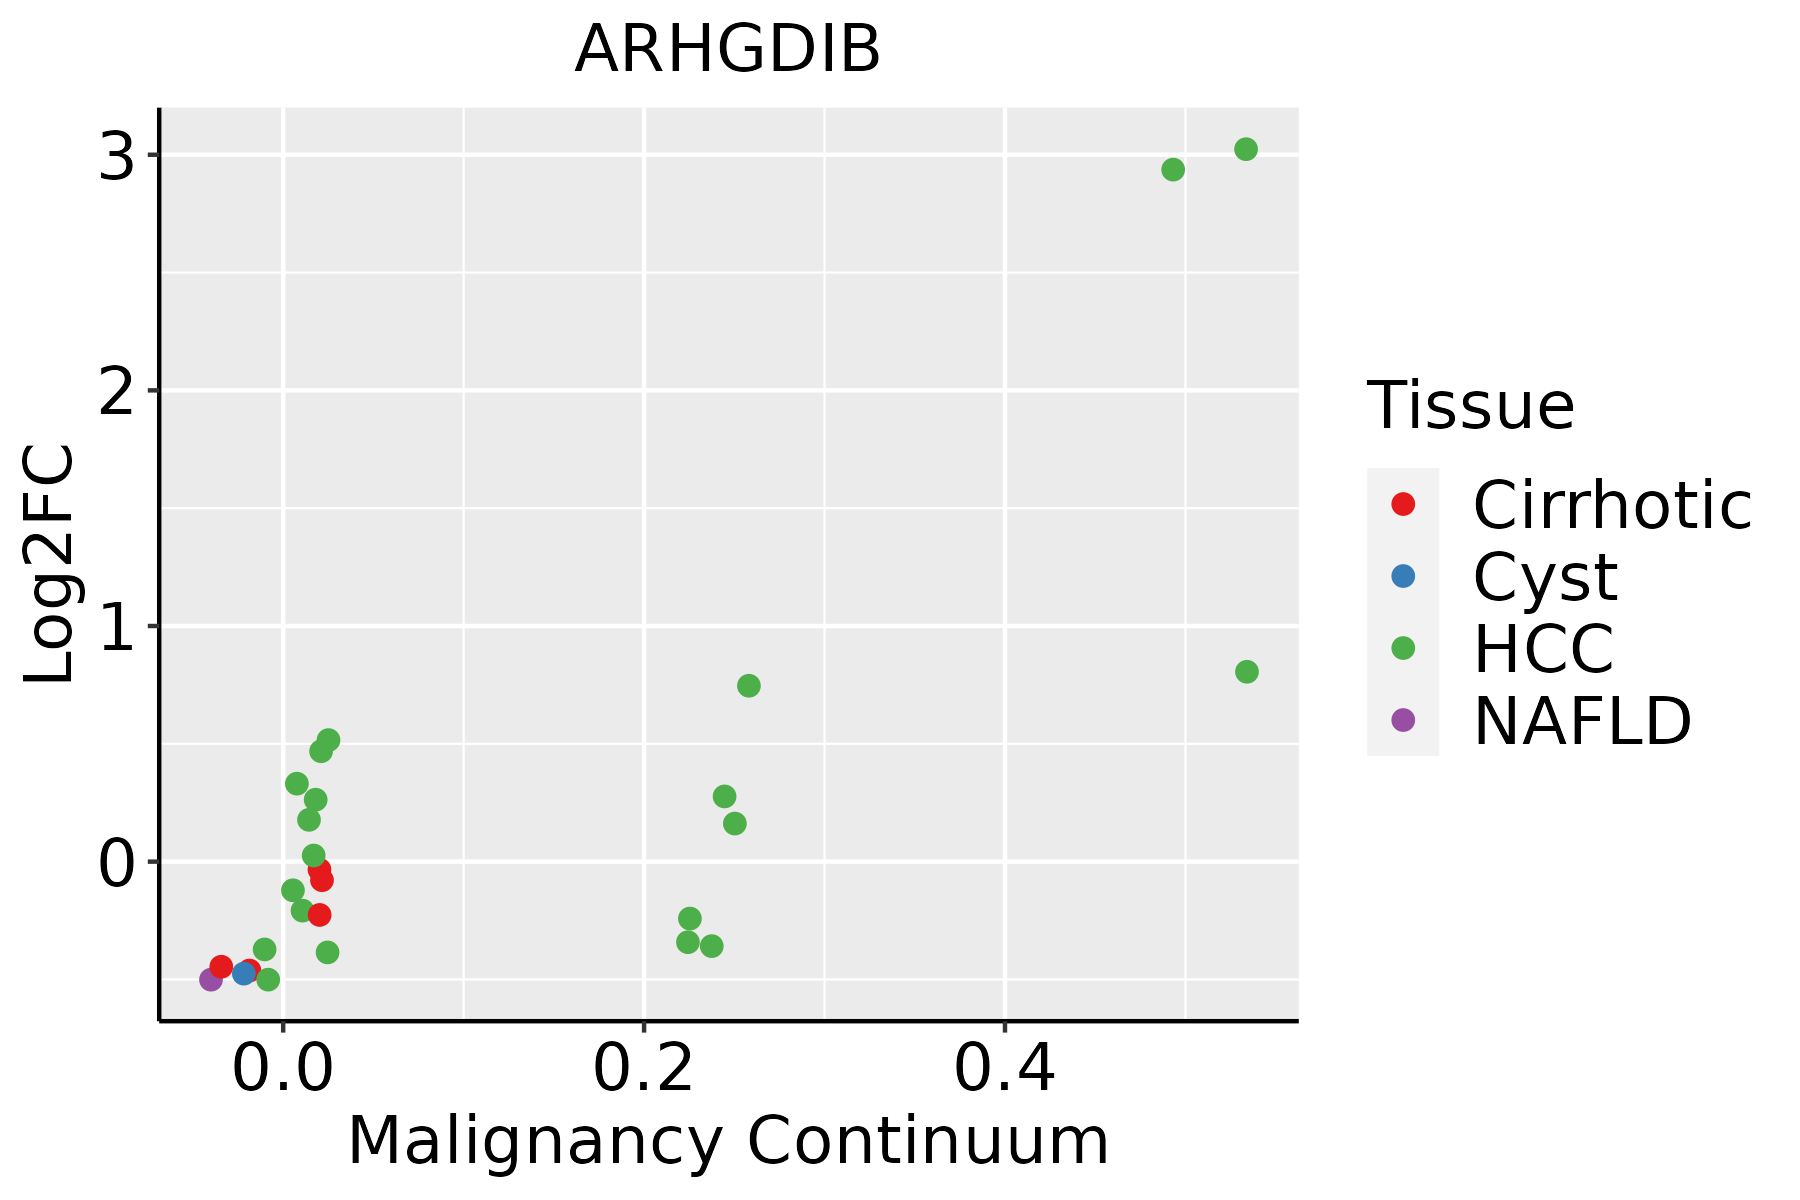 | HCC: Hepatocellular carcinoma |
| NAFLD: Non-alcoholic fatty liver disease | ||
| Oral Cavity | 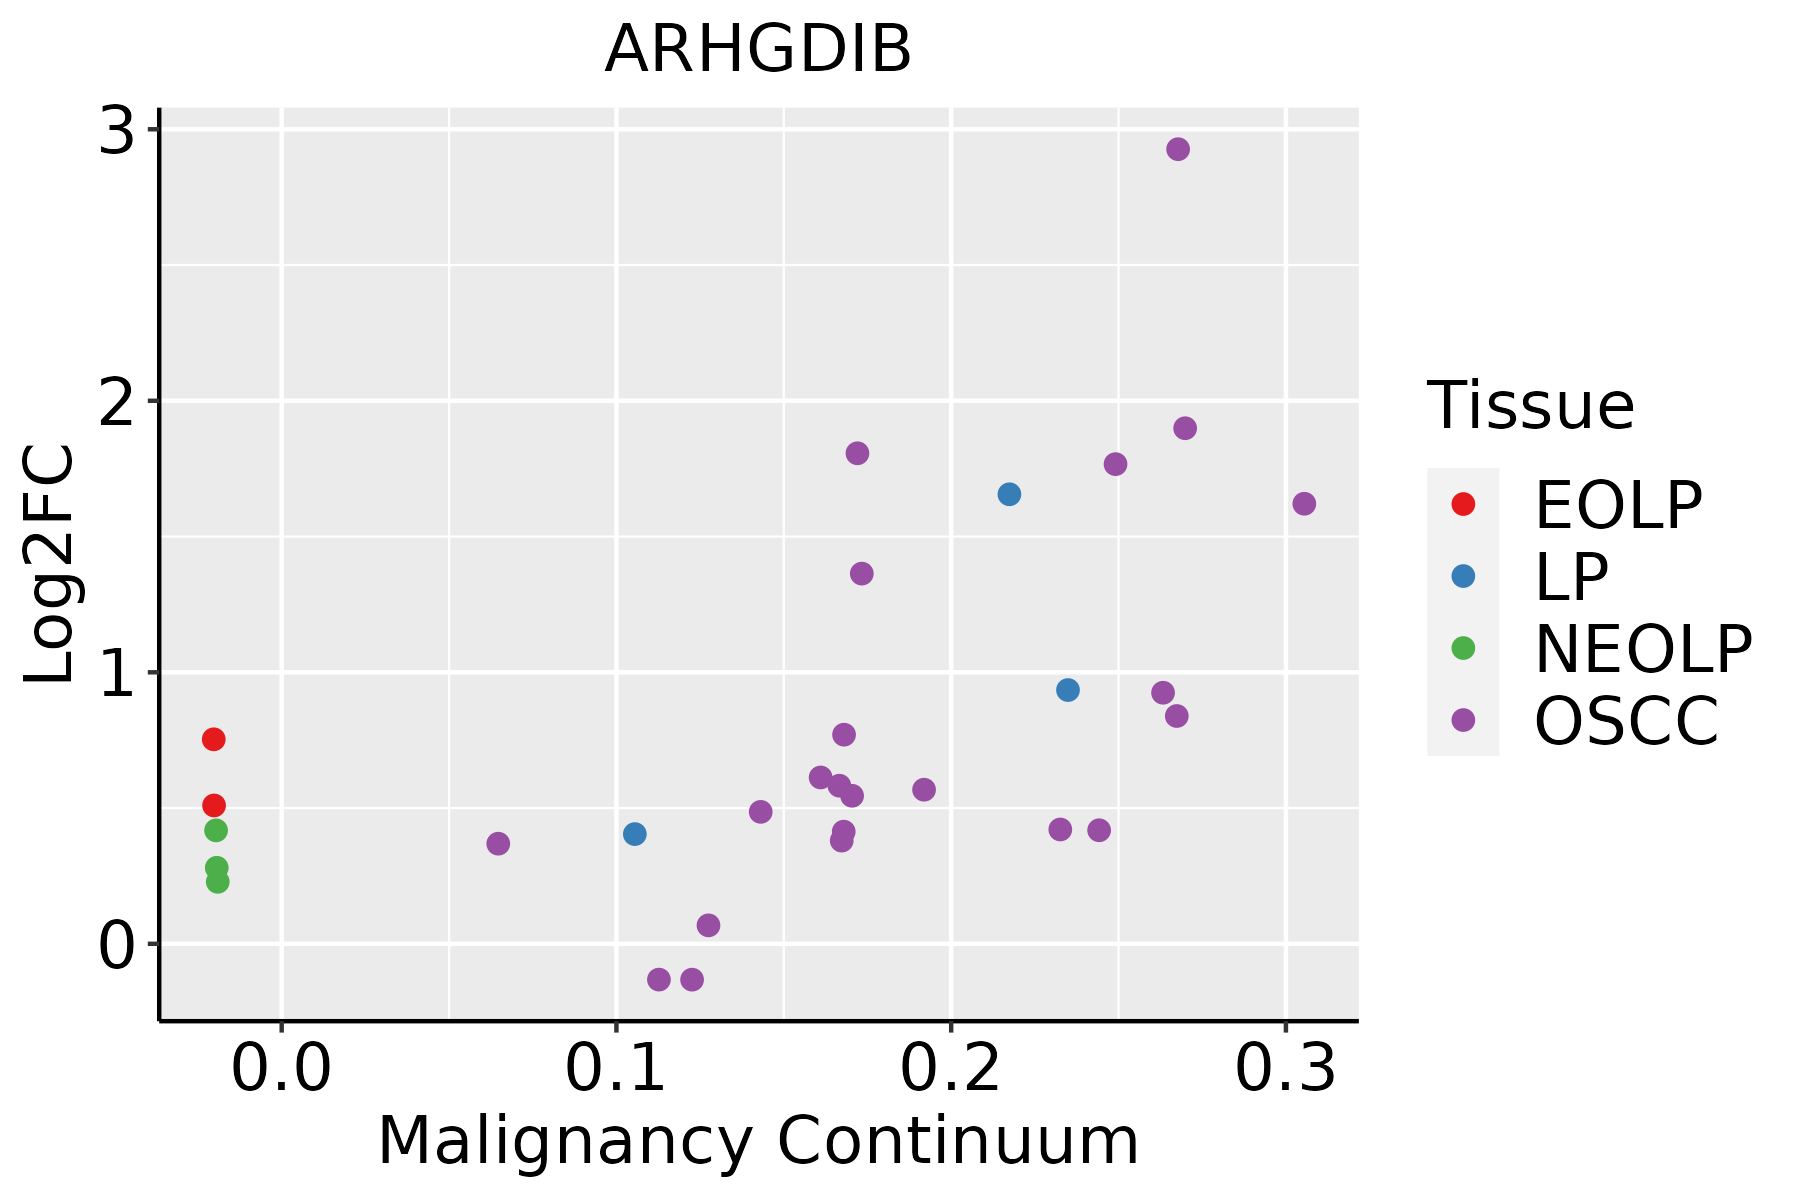 | EOLP: Erosive Oral lichen planus |
| LP: leukoplakia | ||
| NEOLP: Non-erosive oral lichen planus | ||
| OSCC: Oral squamous cell carcinoma | ||
| Prostate | 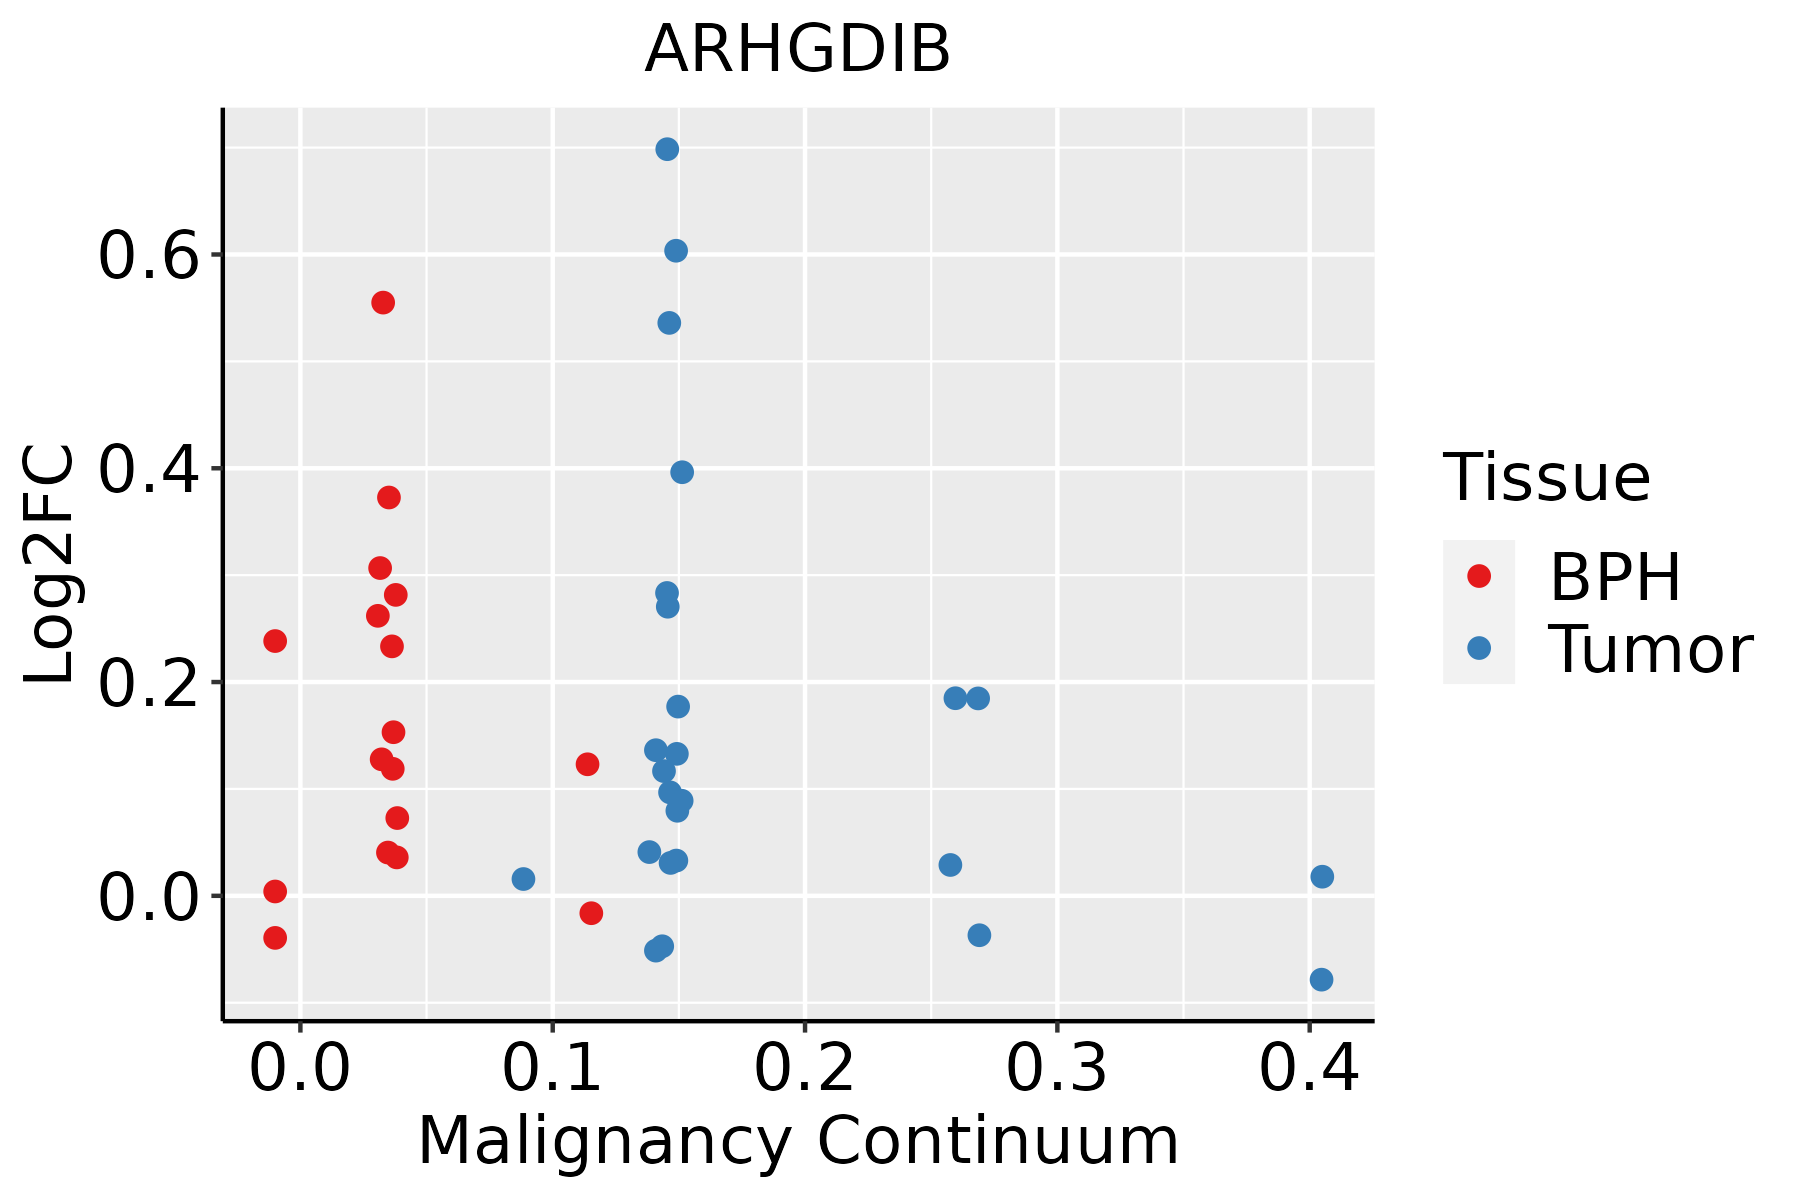 | BPH: Benign Prostatic Hyperplasia |
| Skin | 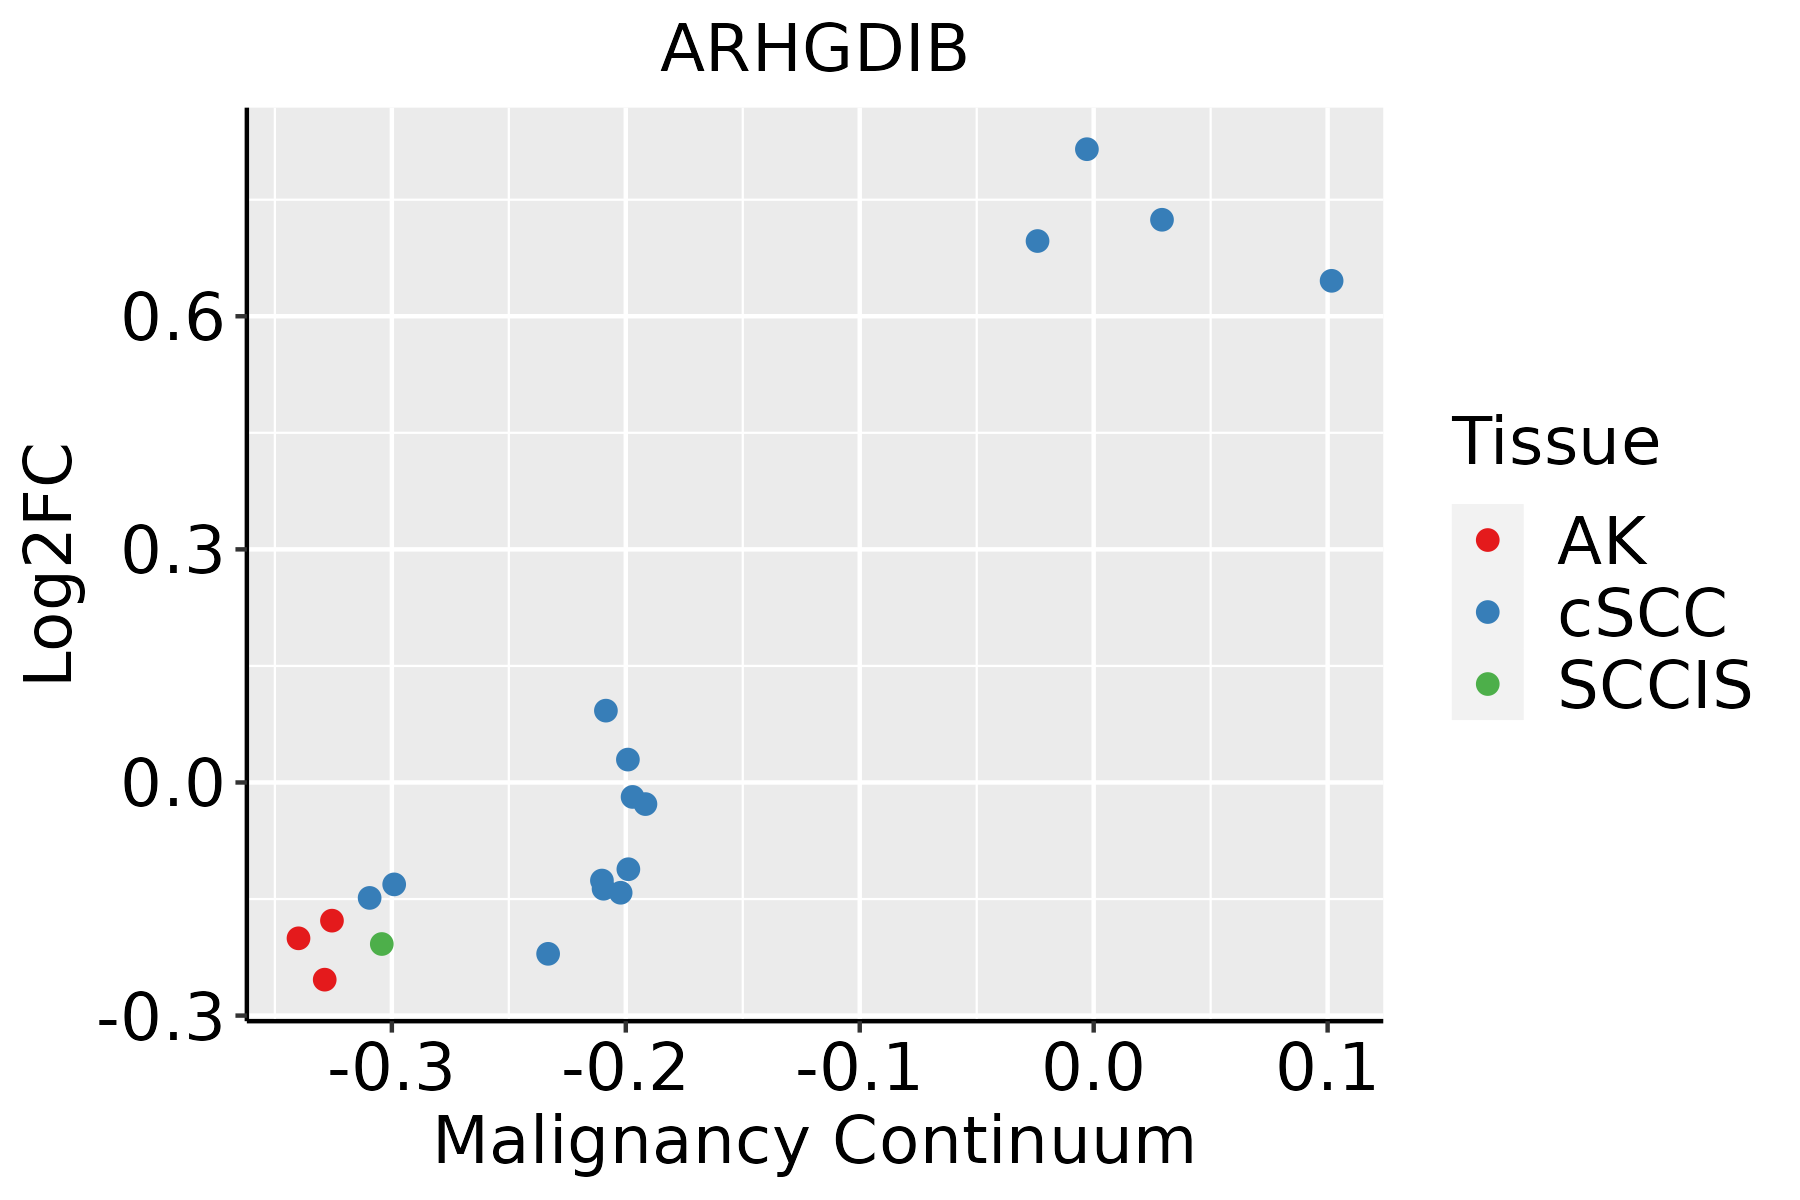 | AK: Actinic keratosis |
| cSCC: Cutaneous squamous cell carcinoma | ||
| SCCIS:squamous cell carcinoma in situ | ||
| Thyroid | 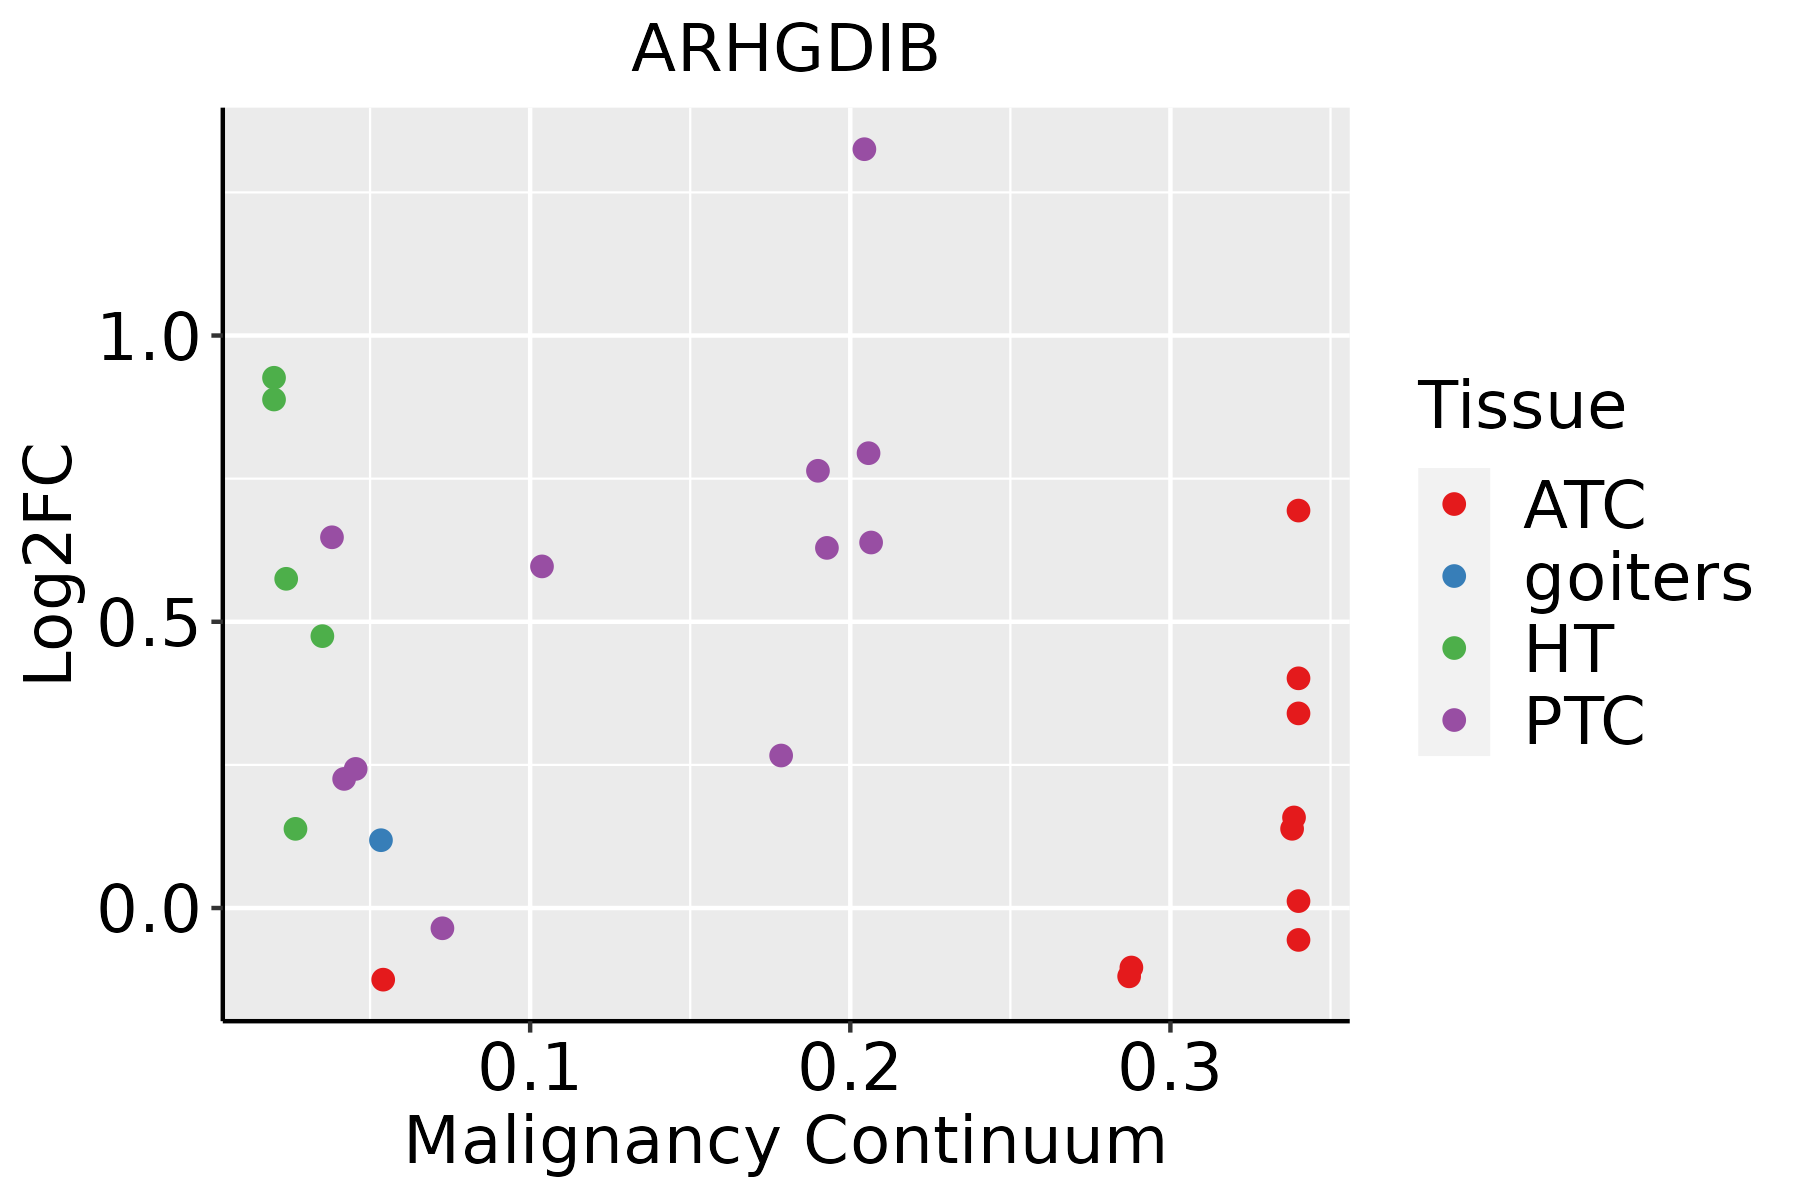 | ATC: Anaplastic thyroid cancer |
| HT: Hashimoto's thyroiditis | ||
| PTC: Papillary thyroid cancer |
| ∗log2FC in expression of this searched gene in stem-like cells from each diseased tissue sample relative to stem-like cells in normal samples in each tissue plotted against the malignancy continuum. Samples are colored based on if they are from different disease stage. |
Top |
Malignant transformation related pathway analysis |
| Find out the enriched GO biological processes and KEGG pathways involved in transition from healthy to precancer to cancer |
| Tissue | Disease Stage | Enriched GO biological Processes |
| Colorectum | AD |  |
| Colorectum | SER |  |
| Colorectum | MSS |  |
| Colorectum | MSI-H |  |
| Colorectum | FAP |  |
| ∗Top 15 enriched GO BP terms are showed in the bar plot of each disease state in each tissue. Each row represents a significant GO biological process which is colored according to the -log10(p.adjust). |
| Page: 1 2 3 4 5 6 7 8 9 |
| GO ID | Tissue | Disease Stage | Description | Gene Ratio | Bg Ratio | pvalue | p.adjust | Count |
| GO:00075653 | Breast | Precancer | female pregnancy | 29/1080 | 193/18723 | 2.07e-06 | 7.31e-05 | 29 |
| GO:00447063 | Breast | Precancer | multi-multicellular organism process | 31/1080 | 220/18723 | 3.73e-06 | 1.19e-04 | 31 |
| GO:00329709 | Breast | Precancer | regulation of actin filament-based process | 42/1080 | 397/18723 | 1.11e-04 | 2.01e-03 | 42 |
| GO:00075663 | Breast | Precancer | embryo implantation | 11/1080 | 53/18723 | 1.82e-04 | 2.95e-03 | 11 |
| GO:00016678 | Breast | Precancer | ameboidal-type cell migration | 47/1080 | 475/18723 | 2.19e-04 | 3.35e-03 | 47 |
| GO:00329569 | Breast | Precancer | regulation of actin cytoskeleton organization | 36/1080 | 358/18723 | 8.56e-04 | 9.88e-03 | 36 |
| GO:000756511 | Breast | IDC | female pregnancy | 39/1434 | 193/18723 | 1.81e-08 | 1.27e-06 | 39 |
| GO:00447061 | Breast | IDC | multi-multicellular organism process | 41/1434 | 220/18723 | 8.58e-08 | 5.19e-06 | 41 |
| GO:003297014 | Breast | IDC | regulation of actin filament-based process | 56/1434 | 397/18723 | 6.37e-06 | 1.99e-04 | 56 |
| GO:000166714 | Breast | IDC | ameboidal-type cell migration | 64/1434 | 475/18723 | 6.65e-06 | 2.05e-04 | 64 |
| GO:000756611 | Breast | IDC | embryo implantation | 14/1434 | 53/18723 | 3.14e-05 | 7.32e-04 | 14 |
| GO:003295614 | Breast | IDC | regulation of actin cytoskeleton organization | 48/1434 | 358/18723 | 1.03e-04 | 1.96e-03 | 48 |
| GO:00512712 | Breast | IDC | negative regulation of cellular component movement | 48/1434 | 367/18723 | 1.88e-04 | 3.12e-03 | 48 |
| GO:20001462 | Breast | IDC | negative regulation of cell motility | 46/1434 | 359/18723 | 4.01e-04 | 5.60e-03 | 46 |
| GO:00303362 | Breast | IDC | negative regulation of cell migration | 43/1434 | 344/18723 | 1.01e-03 | 1.13e-02 | 43 |
| GO:00400132 | Breast | IDC | negative regulation of locomotion | 47/1434 | 391/18723 | 1.39e-03 | 1.43e-02 | 47 |
| GO:00071625 | Breast | IDC | negative regulation of cell adhesion | 37/1434 | 303/18723 | 3.27e-03 | 2.75e-02 | 37 |
| GO:1901163 | Breast | IDC | regulation of trophoblast cell migration | 5/1434 | 16/18723 | 5.59e-03 | 4.07e-02 | 5 |
| GO:00075652 | Breast | DCIS | female pregnancy | 37/1390 | 193/18723 | 7.85e-08 | 4.47e-06 | 37 |
| GO:00447062 | Breast | DCIS | multi-multicellular organism process | 39/1390 | 220/18723 | 3.05e-07 | 1.46e-05 | 39 |
| Page: 1 2 3 4 5 6 7 8 9 10 11 12 13 |
| Pathway ID | Tissue | Disease Stage | Description | Gene Ratio | Bg Ratio | pvalue | p.adjust | qvalue | Count |
| hsa0472214 | Cervix | CC | Neurotrophin signaling pathway | 32/1267 | 119/8465 | 5.01e-04 | 2.42e-03 | 1.43e-03 | 32 |
| hsa0472215 | Cervix | CC | Neurotrophin signaling pathway | 32/1267 | 119/8465 | 5.01e-04 | 2.42e-03 | 1.43e-03 | 32 |
| hsa049627 | Esophagus | HGIN | Vasopressin-regulated water reabsorption | 14/1383 | 44/8465 | 8.21e-03 | 4.71e-02 | 3.74e-02 | 14 |
| hsa0496214 | Esophagus | HGIN | Vasopressin-regulated water reabsorption | 14/1383 | 44/8465 | 8.21e-03 | 4.71e-02 | 3.74e-02 | 14 |
| hsa0472225 | Esophagus | ESCC | Neurotrophin signaling pathway | 80/4205 | 119/8465 | 7.33e-05 | 3.07e-04 | 1.57e-04 | 80 |
| hsa0496223 | Esophagus | ESCC | Vasopressin-regulated water reabsorption | 33/4205 | 44/8465 | 5.27e-04 | 1.78e-03 | 9.13e-04 | 33 |
| hsa04722111 | Esophagus | ESCC | Neurotrophin signaling pathway | 80/4205 | 119/8465 | 7.33e-05 | 3.07e-04 | 1.57e-04 | 80 |
| hsa0496233 | Esophagus | ESCC | Vasopressin-regulated water reabsorption | 33/4205 | 44/8465 | 5.27e-04 | 1.78e-03 | 9.13e-04 | 33 |
| hsa0472210 | Liver | HCC | Neurotrophin signaling pathway | 74/4020 | 119/8465 | 8.27e-04 | 3.26e-03 | 1.81e-03 | 74 |
| hsa049624 | Liver | HCC | Vasopressin-regulated water reabsorption | 30/4020 | 44/8465 | 4.41e-03 | 1.32e-02 | 7.34e-03 | 30 |
| hsa0472211 | Liver | HCC | Neurotrophin signaling pathway | 74/4020 | 119/8465 | 8.27e-04 | 3.26e-03 | 1.81e-03 | 74 |
| hsa0496211 | Liver | HCC | Vasopressin-regulated water reabsorption | 30/4020 | 44/8465 | 4.41e-03 | 1.32e-02 | 7.34e-03 | 30 |
| hsa0472220 | Oral cavity | OSCC | Neurotrophin signaling pathway | 74/3704 | 119/8465 | 3.55e-05 | 1.49e-04 | 7.58e-05 | 74 |
| hsa049626 | Oral cavity | OSCC | Vasopressin-regulated water reabsorption | 29/3704 | 44/8465 | 2.47e-03 | 6.52e-03 | 3.32e-03 | 29 |
| hsa04722110 | Oral cavity | OSCC | Neurotrophin signaling pathway | 74/3704 | 119/8465 | 3.55e-05 | 1.49e-04 | 7.58e-05 | 74 |
| hsa0496213 | Oral cavity | OSCC | Vasopressin-regulated water reabsorption | 29/3704 | 44/8465 | 2.47e-03 | 6.52e-03 | 3.32e-03 | 29 |
| hsa0472224 | Oral cavity | LP | Neurotrophin signaling pathway | 46/2418 | 119/8465 | 1.07e-02 | 3.77e-02 | 2.43e-02 | 46 |
| hsa0496222 | Oral cavity | LP | Vasopressin-regulated water reabsorption | 20/2418 | 44/8465 | 1.24e-02 | 4.10e-02 | 2.64e-02 | 20 |
| hsa0472234 | Oral cavity | LP | Neurotrophin signaling pathway | 46/2418 | 119/8465 | 1.07e-02 | 3.77e-02 | 2.43e-02 | 46 |
| hsa0496232 | Oral cavity | LP | Vasopressin-regulated water reabsorption | 20/2418 | 44/8465 | 1.24e-02 | 4.10e-02 | 2.64e-02 | 20 |
| Page: 1 2 |
Top |
Cell-cell communication analysis |
| Identification of potential cell-cell interactions between two cell types and their ligand-receptor pairs for different disease states |
| Ligand | Receptor | LRpair | Pathway | Tissue | Disease Stage |
| Page: 1 |
Top |
Single-cell gene regulatory network inference analysis |
| Find out the significant the regulons (TFs) and the target genes of each regulon across cell types for different disease states |
| TF | Cell Type | Tissue | Disease Stage | Target Gene | RSS | Regulon Activity |
| ∗The dot plots of a searched regulon are shown for all cell subpopulations in each disease state of each tissue based on the regulon specific score inferred using pySCENIC and by calculating the average expression. |
| Page: 1 |
Top |
Somatic mutation of malignant transformation related genes |
| Annotation of somatic variants for genes involved in malignant transformation |
| Hugo Symbol | Variant Class | Variant Classification | dbSNP RS | HGVSc | HGVSp | HGVSp Short | SWISSPROT | BIOTYPE | SIFT | PolyPhen | Tumor Sample Barcode | Tissue | Histology | Sex | Age | Stage | Therapy Types | Drugs | Outcome |
| ARHGDIB | SNV | Missense_Mutation | c.462N>T | p.Glu154Asp | p.E154D | P52566 | protein_coding | tolerated(0.06) | benign(0.005) | TCGA-A8-A075-01 | Breast | breast invasive carcinoma | Female | <65 | I/II | Chemotherapy | epirubicin | CR | |
| ARHGDIB | SNV | Missense_Mutation | novel | c.362C>T | p.Ser121Leu | p.S121L | P52566 | protein_coding | deleterious(0.01) | probably_damaging(0.996) | TCGA-AN-A0XW-01 | Breast | breast invasive carcinoma | Female | <65 | III/IV | Unknown | Unknown | SD |
| ARHGDIB | SNV | Missense_Mutation | c.515N>G | p.Tyr172Cys | p.Y172C | P52566 | protein_coding | deleterious(0) | probably_damaging(1) | TCGA-A6-5665-01 | Colorectum | colon adenocarcinoma | Female | >=65 | I/II | Unknown | Unknown | PD | |
| ARHGDIB | SNV | Missense_Mutation | c.430N>T | p.Gly144Cys | p.G144C | P52566 | protein_coding | deleterious(0) | probably_damaging(1) | TCGA-AA-3679-01 | Colorectum | colon adenocarcinoma | Male | <65 | III/IV | Chemotherapy | folinic | SD | |
| ARHGDIB | SNV | Missense_Mutation | novel | c.323N>T | p.Arg108Ile | p.R108I | P52566 | protein_coding | deleterious(0) | benign(0.372) | TCGA-AA-3949-01 | Colorectum | colon adenocarcinoma | Female | >=65 | III/IV | Unknown | Unknown | SD |
| ARHGDIB | SNV | Missense_Mutation | novel | c.178A>G | p.Thr60Ala | p.T60A | P52566 | protein_coding | tolerated(0.78) | benign(0) | TCGA-AM-5821-01 | Colorectum | colon adenocarcinoma | Female | >=65 | I/II | Unknown | Unknown | SD |
| ARHGDIB | SNV | Missense_Mutation | rs774401441 | c.581N>T | p.Ser194Leu | p.S194L | P52566 | protein_coding | tolerated(0.19) | benign(0.196) | TCGA-AZ-4315-01 | Colorectum | colon adenocarcinoma | Male | <65 | I/II | Unknown | Unknown | SD |
| ARHGDIB | SNV | Missense_Mutation | novel | c.333N>G | p.Ile111Met | p.I111M | P52566 | protein_coding | deleterious(0) | probably_damaging(0.992) | TCGA-CA-6717-01 | Colorectum | colon adenocarcinoma | Male | <65 | I/II | Chemotherapy | oxaliplatin | CR |
| ARHGDIB | SNV | Missense_Mutation | rs369111462 | c.503N>T | p.Ala168Val | p.A168V | P52566 | protein_coding | tolerated(0.31) | benign(0.442) | TCGA-F4-6570-01 | Colorectum | colon adenocarcinoma | Female | >=65 | I/II | Unknown | Unknown | SD |
| ARHGDIB | SNV | Missense_Mutation | c.593N>G | p.Glu198Gly | p.E198G | P52566 | protein_coding | deleterious(0.02) | benign(0.011) | TCGA-AP-A051-01 | Endometrium | uterine corpus endometrioid carcinoma | Female | >=65 | I/II | Unknown | Unknown | SD |
| Page: 1 2 3 |
Top |
Related drugs of malignant transformation related genes |
| Identification of chemicals and drugs interact with genes involved in malignant transfromation |
| (DGIdb 4.0) |
| Entrez ID | Symbol | Category | Interaction Types | Drug Claim Name | Drug Name | PMIDs |
| Page: 1 |

Copyright 2023-Present -The University of Texas Health Science Center at Houston |