Schematic overview of the cellular and molecular mechanisms involved in the cancer progression, including the proposed cellular and molecular mechanisms in cancer cells trajectory. AT1: alveolar type 1 cells; AT2: alveolar type 2 cells; AAH: atypical adenomatous hyperplasia; AIS: adenocarcinoma in situ; MIA: minimally invasive adenocarcinoma; IA: invasive adenocarcinoma; EMT: epithelial-mesenchymal transition

Home

Download

Statistics

Help

Contact

Center for Computational Systems Medicine
leaf

Gene summary

leaf

Malignant transformation analysis

leaf

Malignant transformation related pathway analysis

leaf

Cell-cell communication analysis

leaf

Single-cell gene regulatory network inference analysis

leaf

Somatic mutation of malignant transformation related genes

leaf

Related drugs of malignant transformation related genes

Gene: ABHD14B

Gene summary for ABHD14B

check button Gene summary.

Gene informationSpeciesHuman
Gene symbol

ABHD14B

Gene ID

84836

Gene nameabhydrolase domain containing 14B
Gene AliasCIB
Cytomap3p21.2
Gene Typeprotein-coding
GO ID

GO:0006082

UniProtAcc

Q96IU4


Top

Malignant transformation analysis

check button Identification of the aberrant gene expression in precancerous and cancerous lesions by comparing the gene expression of stem-like cells in diseased tissues with normal stem cells
check button Malignant transformation involving gene list.
Entrez IDSymbolReplicatesSpeciesOrganTissueAdj P-valueLog2FCMalignancy
84836ABHD14BP127T-EHumanEsophagusESCC1.49e-223.34e-010.0826
84836ABHD14BP128T-EHumanEsophagusESCC2.71e-329.46e-010.1241
84836ABHD14BP130T-EHumanEsophagusESCC1.19e-489.35e-010.1676
84836ABHD14BS43HumanLiverCirrhotic6.64e-06-1.52e-01-0.0187
84836ABHD14BHCC1_MengHumanLiverHCC1.11e-813.16e-010.0246
84836ABHD14BHCC2_MengHumanLiverHCC1.71e-358.32e-020.0107
84836ABHD14Bcirrhotic1HumanLiverCirrhotic1.33e-072.12e-010.0202
84836ABHD14Bcirrhotic2HumanLiverCirrhotic6.84e-082.75e-010.0201
84836ABHD14BHCC1HumanLiverHCC5.29e-084.05e+000.5336
84836ABHD14BPt13.bHumanLiverHCC2.61e-162.24e-010.0251
84836ABHD14BPt14.aHumanLiverHCC6.28e-054.68e-010.0169
84836ABHD14BS014HumanLiverHCC8.26e-291.30e+000.2254
84836ABHD14BS015HumanLiverHCC5.71e-251.35e+000.2375
84836ABHD14BS016HumanLiverHCC1.29e-291.27e+000.2243
84836ABHD14BS027HumanLiverHCC1.79e-071.12e+000.2446
84836ABHD14BS028HumanLiverHCC4.28e-291.61e+000.2503
84836ABHD14BS029HumanLiverHCC1.39e-262.06e+000.2581
84836ABHD14BC04HumanOral cavityOSCC2.94e-097.28e-010.2633
84836ABHD14BC21HumanOral cavityOSCC4.88e-156.03e-010.2678
84836ABHD14BC30HumanOral cavityOSCC1.61e-311.26e+000.3055
Page: 1 2 3 4 5 6 7 8 

check button Transcriptomic changes along malignancy continuum.
TissueExpression DynamicsAbbreviation
Colorectum (GSE201348)The image shows the transcriptomic changes along malignancy continuum.log2FC in expression of this searched gene in stem-like cells from each diseased tissue sample relative to stem-like cells in normal samples in each tissue plotted against the malignancy continuum. Samples are colored based on if they are from different disease stage.FAP: Familial adenomatous polyposis
CRC: Colorectal cancer
Colorectum (HTA11)The image shows the transcriptomic changes along malignancy continuum.log2FC in expression of this searched gene in stem-like cells from each diseased tissue sample relative to stem-like cells in normal samples in each tissue plotted against the malignancy continuum. Samples are colored based on if they are from different disease stage.AD: Adenomas
SER: Sessile serrated lesions
MSI-H: Microsatellite-high colorectal cancer
MSS: Microsatellite stable colorectal cancer
EsophagusThe image shows the transcriptomic changes along malignancy continuum.log2FC in expression of this searched gene in stem-like cells from each diseased tissue sample relative to stem-like cells in normal samples in each tissue plotted against the malignancy continuum. Samples are colored based on if they are from different disease stage.
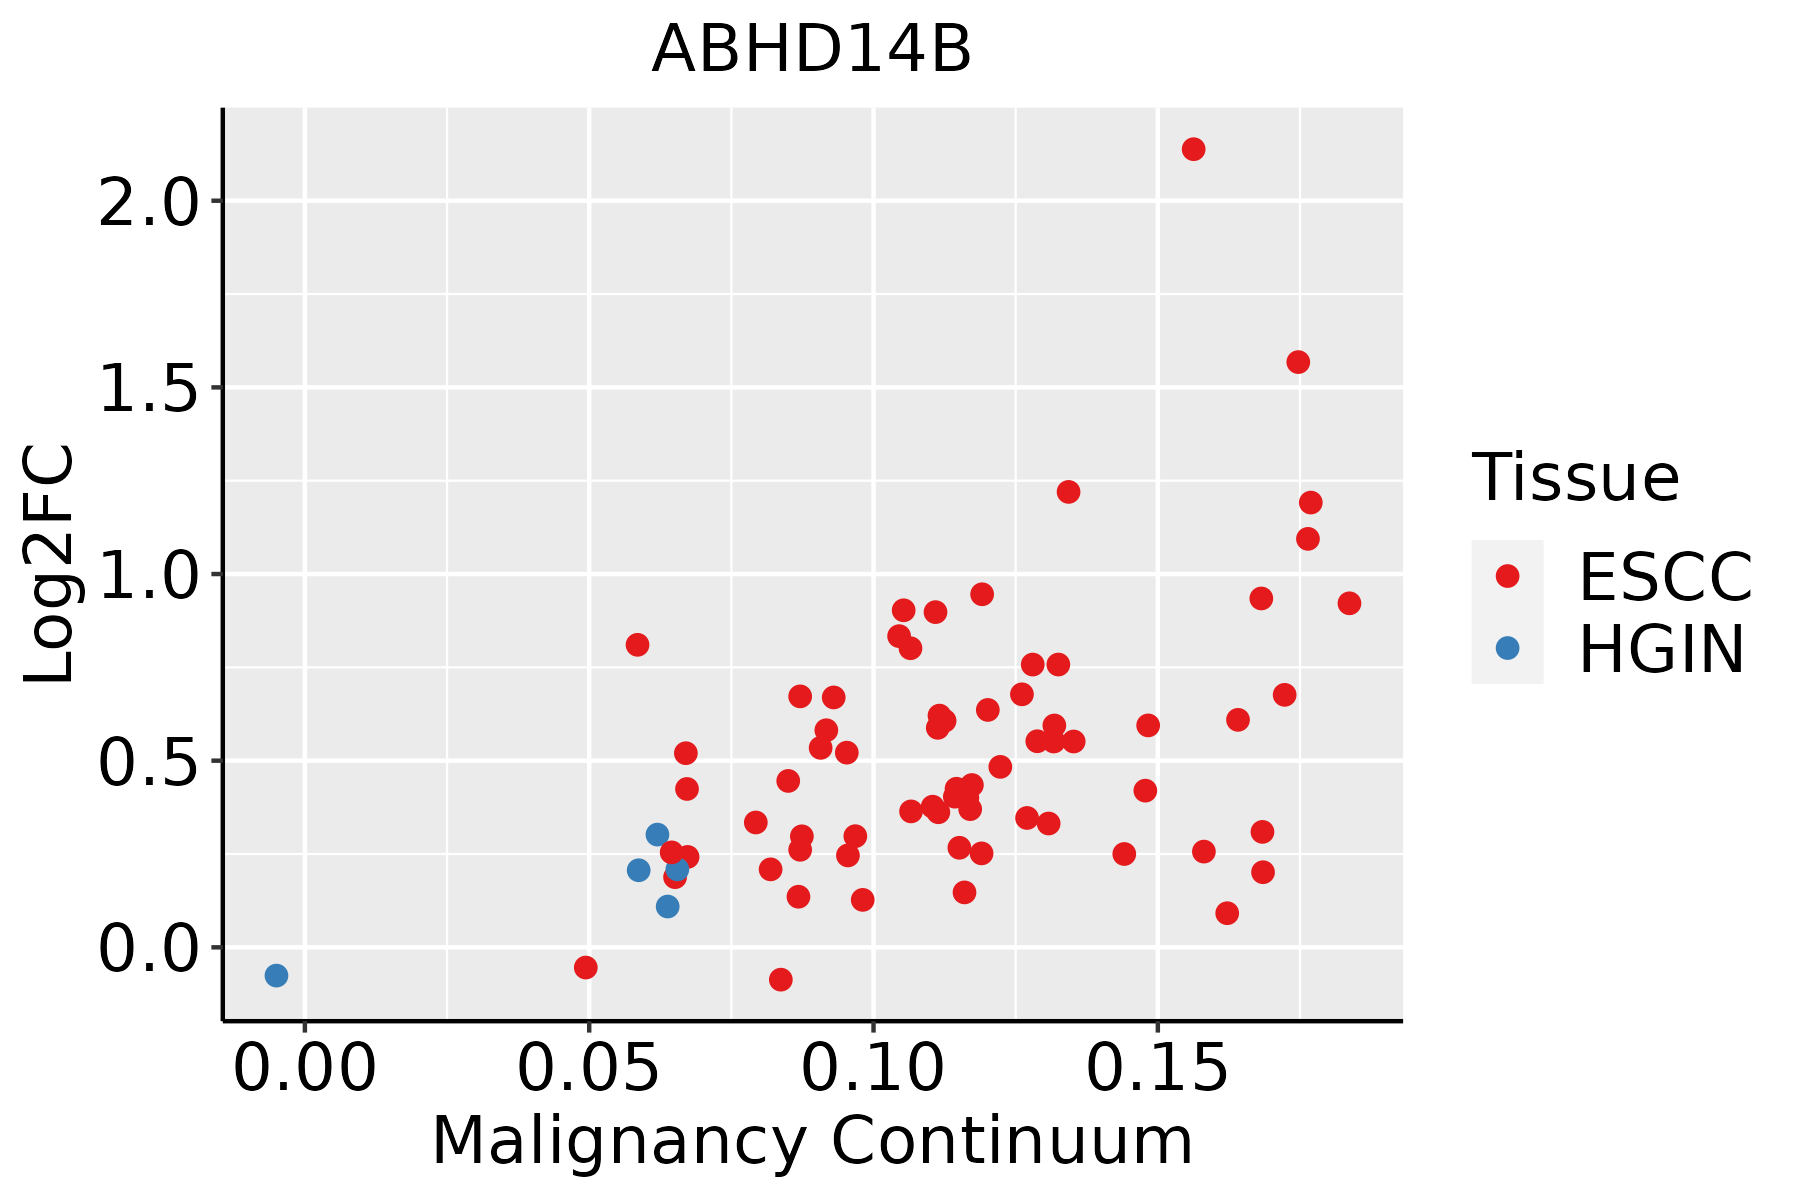
ESCC: Esophageal squamous cell carcinoma
HGIN: High-grade intraepithelial neoplasias
LGIN: Low-grade intraepithelial neoplasias
LiverThe image shows the transcriptomic changes along malignancy continuum.log2FC in expression of this searched gene in stem-like cells from each diseased tissue sample relative to stem-like cells in normal samples in each tissue plotted against the malignancy continuum. Samples are colored based on if they are from different disease stage.
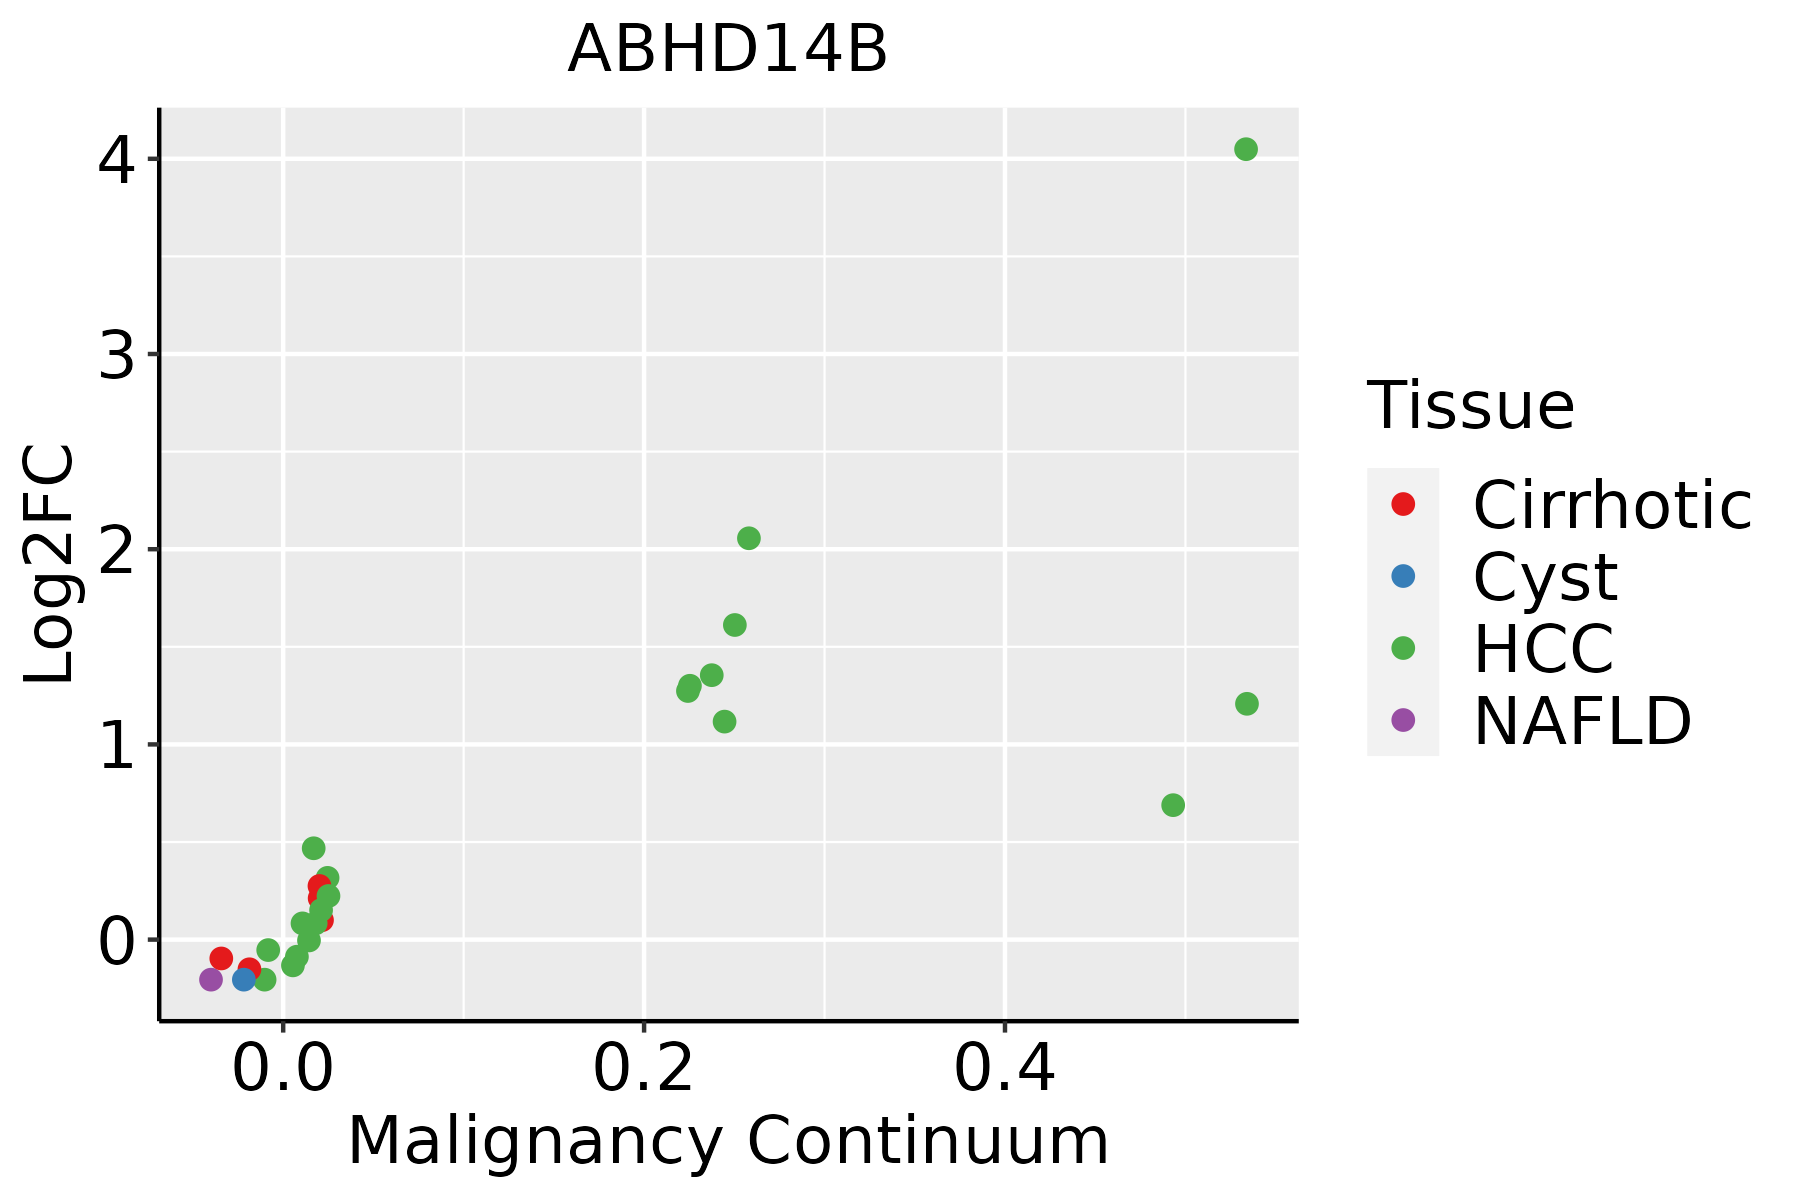
HCC: Hepatocellular carcinoma
NAFLD: Non-alcoholic fatty liver disease
Oral CavityThe image shows the transcriptomic changes along malignancy continuum.log2FC in expression of this searched gene in stem-like cells from each diseased tissue sample relative to stem-like cells in normal samples in each tissue plotted against the malignancy continuum. Samples are colored based on if they are from different disease stage.EOLP: Erosive Oral lichen planus
LP: leukoplakia
NEOLP: Non-erosive oral lichen planus
OSCC: Oral squamous cell carcinoma
ThyroidThe image shows the transcriptomic changes along malignancy continuum.log2FC in expression of this searched gene in stem-like cells from each diseased tissue sample relative to stem-like cells in normal samples in each tissue plotted against the malignancy continuum. Samples are colored based on if they are from different disease stage.
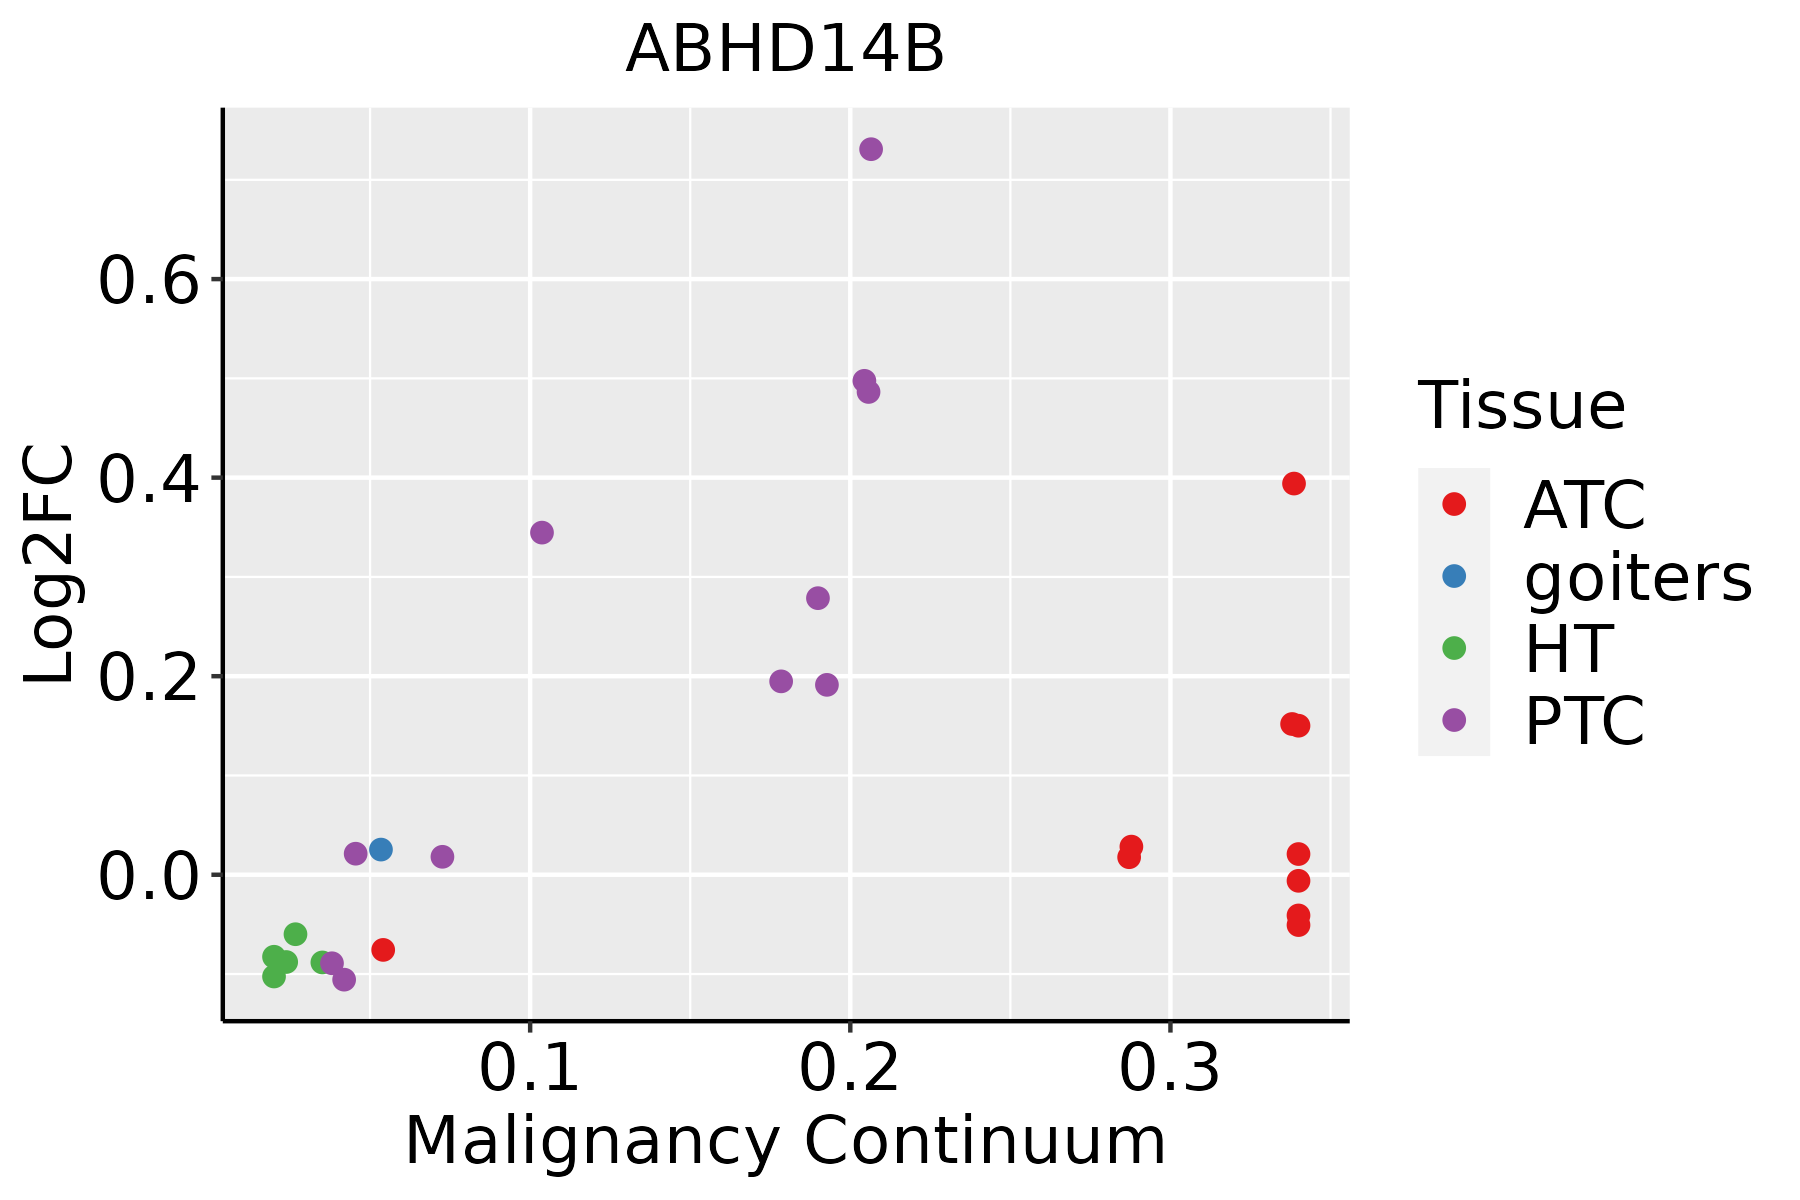
ATC: Anaplastic thyroid cancer
HT: Hashimoto's thyroiditis
PTC: Papillary thyroid cancer
∗log2FC in expression of this searched gene in stem-like cells from each diseased tissue sample relative to stem-like cells in normal samples in each tissue plotted against the malignancy continuum. Samples are colored based on if they are from different disease stage.

Top

Malignant transformation related pathway analysis

check buttonFind out the enriched GO biological processes and KEGG pathways involved in transition from healthy to precancer to cancer
check button Figure of enriched GO biological processes.
TissueDisease StageEnriched GO biological Processes
ColorectumADGO analysis - Figure of enriched GO biological processes: Top 15 enriched GO BP terms are showed in the bar plot of each disease state in each tissue. Each row represents a significant GO biological process which is colored according to the -log10(p.adjust).
ColorectumSERGO analysis - Figure of enriched GO biological processes: Top 15 enriched GO BP terms are showed in the bar plot of each disease state in each tissue. Each row represents a significant GO biological process which is colored according to the -log10(p.adjust).
ColorectumMSSGO analysis - Figure of enriched GO biological processes: Top 15 enriched GO BP terms are showed in the bar plot of each disease state in each tissue. Each row represents a significant GO biological process which is colored according to the -log10(p.adjust).
ColorectumMSI-HGO analysis - Figure of enriched GO biological processes: Top 15 enriched GO BP terms are showed in the bar plot of each disease state in each tissue. Each row represents a significant GO biological process which is colored according to the -log10(p.adjust).
ColorectumFAPGO analysis - Figure of enriched GO biological processes: Top 15 enriched GO BP terms are showed in the bar plot of each disease state in each tissue. Each row represents a significant GO biological process which is colored according to the -log10(p.adjust).
∗Top 15 enriched GO BP terms are showed in the bar plot of each disease state in each tissue. Each row represents a significant GO biological process which is colored according to the -log10(p.adjust).
Page: 1 2 3 4 5 6 7 8 9 

check button Enriched GO biological processes.
GO IDTissueDisease StageDescriptionGene RatioBg Ratiopvaluep.adjustCount
GO:0009150ColorectumADpurine ribonucleotide metabolic process142/3918368/187234.29e-151.17e-12142
GO:0006163ColorectumADpurine nucleotide metabolic process149/3918396/187231.08e-142.80e-12149
GO:0072521ColorectumADpurine-containing compound metabolic process153/3918416/187234.34e-141.01e-11153
GO:0009259ColorectumADribonucleotide metabolic process144/3918385/187235.25e-141.13e-11144
GO:0019693ColorectumADribose phosphate metabolic process145/3918396/187233.01e-135.71e-11145
GO:0009117ColorectumADnucleotide metabolic process168/3918489/187232.20e-123.36e-10168
GO:0006753ColorectumADnucleoside phosphate metabolic process169/3918497/187234.99e-126.98e-10169
GO:0006790ColorectumADsulfur compound metabolic process101/3918339/187236.46e-051.07e-03101
GO:0033865ColorectumADnucleoside bisphosphate metabolic process42/3918128/187231.12e-031.02e-0242
GO:0033875ColorectumADribonucleoside bisphosphate metabolic process42/3918128/187231.12e-031.02e-0242
GO:0034032ColorectumADpurine nucleoside bisphosphate metabolic process42/3918128/187231.12e-031.02e-0242
GO:0034035ColorectumADpurine ribonucleoside bisphosphate metabolic process11/391821/187231.43e-031.22e-0211
GO:0050427ColorectumAD3'-phosphoadenosine 5'-phosphosulfate metabolic process11/391821/187231.43e-031.22e-0211
GO:00061631ColorectumSERpurine nucleotide metabolic process109/2897396/187234.26e-105.44e-08109
GO:00091501ColorectumSERpurine ribonucleotide metabolic process103/2897368/187234.69e-105.68e-08103
GO:00725211ColorectumSERpurine-containing compound metabolic process113/2897416/187234.80e-105.68e-08113
GO:00092591ColorectumSERribonucleotide metabolic process104/2897385/187233.27e-093.04e-07104
GO:00196931ColorectumSERribose phosphate metabolic process105/2897396/187238.15e-097.14e-07105
GO:00091171ColorectumSERnucleotide metabolic process122/2897489/187232.50e-081.76e-06122
GO:00067531ColorectumSERnucleoside phosphate metabolic process122/2897497/187236.64e-084.33e-06122
Page: 1 2 3 4 5 6 

check button Enriched KEGG pathways.
Pathway IDTissueDisease StageDescriptionGene RatioBg Ratiopvaluep.adjustqvalueCount
Page: 1 

Top

Cell-cell communication analysis

check buttonIdentification of potential cell-cell interactions between two cell types and their ligand-receptor pairs for different disease states
LigandReceptorLRpairPathwayTissueDisease Stage
Page: 1 

Top

Single-cell gene regulatory network inference analysis

check buttonFind out the significant the regulons (TFs) and the target genes of each regulon across cell types for different disease states
TFCell TypeTissueDisease StageTarget GeneRSSRegulon Activity
∗The dot plots of a searched regulon are shown for all cell subpopulations in each disease state of each tissue based on the regulon specific score inferred using pySCENIC and by calculating the average expression.
Page: 1 

Top

Somatic mutation of malignant transformation related genes

check buttonAnnotation of somatic variants for genes involved in malignant transformation
Hugo SymbolVariant ClassVariant ClassificationdbSNP RSHGVScHGVSpHGVSp ShortSWISSPROTBIOTYPESIFTPolyPhenTumor Sample BarcodeTissueHistologySexAgeStageTherapy TypesDrugsOutcome
ABHD14BSNVMissense_Mutationnovelc.518N>Gp.Lys173Argp.K173RQ96IU4protein_codingtolerated(0.99)benign(0.056)TCGA-A5-A1OF-01Endometriumuterine corpus endometrioid carcinomaFemale<65I/IIUnknownUnknownSD
ABHD14BSNVMissense_Mutationrs575308151c.65G>Ap.Arg22Glnp.R22QQ96IU4protein_codingdeleterious(0)probably_damaging(0.953)TCGA-AP-A1DK-01Endometriumuterine corpus endometrioid carcinomaFemale<65I/IIUnknownUnknownSD
ABHD14BSNVMissense_Mutationrs751636953c.403N>Ap.Ala135Thrp.A135TQ96IU4protein_codingdeleterious(0)probably_damaging(1)TCGA-B5-A3FA-01Endometriumuterine corpus endometrioid carcinomaFemale>=65I/IIUnknownUnknownSD
ABHD14BSNVMissense_Mutationrs199563943c.241N>Tp.Pro81Serp.P81SQ96IU4protein_codingtolerated(0.13)benign(0.003)TCGA-D1-A1O7-01Endometriumuterine corpus endometrioid carcinomaFemale<65I/IIUnknownUnknownSD
ABHD14BSNVMissense_Mutationc.125G>Ap.Arg42Hisp.R42HQ96IU4protein_codingtolerated(0.08)benign(0.03)TCGA-E6-A1LX-01Endometriumuterine corpus endometrioid carcinomaFemale<65I/IIUnknownUnknownSD
ABHD14BSNVMissense_Mutationnovelc.80N>Ap.Gly27Aspp.G27DQ96IU4protein_codingtolerated(0.63)benign(0.075)TCGA-EY-A1GI-01Endometriumuterine corpus endometrioid carcinomaFemale<65I/IIUnknownUnknownSD
ABHD14BSNVMissense_Mutationc.622N>Ap.Gly208Argp.G208RQ96IU4protein_codingtolerated(0.49)benign(0.055)TCGA-BC-A10R-01Liverliver hepatocellular carcinomaFemale>=65III/IVOther, specify in noteschemoembolizationunknownPD
ABHD14BSNVMissense_Mutationc.328N>Tp.Pro110Serp.P110SQ96IU4protein_codingdeleterious(0.04)probably_damaging(1)TCGA-78-7150-01Lunglung adenocarcinomaMale<65I/IIChemotherapycarboplatinPD
ABHD14BSNVMissense_Mutationnovelc.63N>Gp.Phe21Leup.F21LQ96IU4protein_codingdeleterious(0.01)benign(0.007)TCGA-85-A53L-01Lunglung squamous cell carcinomaMale<65I/IIUnknownUnknownSD
Page: 1 

Top

Related drugs of malignant transformation related genes

check buttonIdentification of chemicals and drugs interact with genes involved in malignant transfromation
(DGIdb 4.0)
Entrez IDSymbolCategoryInteraction TypesDrug Claim NameDrug NamePMIDs
Page: 1