
|
|||||
|
 | |
| |
| |
| |
| |
| |
|
Gene: SLC40A1 |
Gene summary for SLC40A1 |
| Gene information | Species | Human | Gene symbol | SLC40A1 | Gene ID | 30061 |
| Gene name | solute carrier family 40 member 1 | |
| Gene Alias | FPN1 | |
| Cytomap | 2q32.2 | |
| Gene Type | protein-coding | GO ID | GO:0000041 | UniProtAcc | Q9NP59 |
Top |
Malignant transformation analysis |
| Identification of the aberrant gene expression in precancerous and cancerous lesions by comparing the gene expression of stem-like cells in diseased tissues with normal stem cells |
| Entrez ID | Symbol | Replicates | Species | Organ | Tissue | Adj P-value | Log2FC | Malignancy |
| 30061 | SLC40A1 | P76T-E | Human | Esophagus | ESCC | 1.05e-06 | 1.79e-01 | 0.1207 |
| 30061 | SLC40A1 | P79T-E | Human | Esophagus | ESCC | 1.40e-22 | 5.61e-01 | 0.1154 |
| 30061 | SLC40A1 | P82T-E | Human | Esophagus | ESCC | 1.49e-12 | 1.27e+00 | 0.1072 |
| 30061 | SLC40A1 | P94T-E | Human | Esophagus | ESCC | 1.77e-02 | 6.77e-01 | 0.0879 |
| 30061 | SLC40A1 | P104T-E | Human | Esophagus | ESCC | 7.77e-04 | 3.90e-01 | 0.0931 |
| 30061 | SLC40A1 | P107T-E | Human | Esophagus | ESCC | 1.13e-04 | 2.26e-01 | 0.171 |
| 30061 | SLC40A1 | P127T-E | Human | Esophagus | ESCC | 2.22e-24 | 9.13e-01 | 0.0826 |
| 30061 | SLC40A1 | P128T-E | Human | Esophagus | ESCC | 1.58e-20 | 8.76e-01 | 0.1241 |
| 30061 | SLC40A1 | P130T-E | Human | Esophagus | ESCC | 3.17e-11 | 3.28e-01 | 0.1676 |
| 30061 | SLC40A1 | S43 | Human | Liver | Cirrhotic | 4.26e-10 | -6.40e-02 | -0.0187 |
| 30061 | SLC40A1 | HCC1_Meng | Human | Liver | HCC | 5.29e-70 | 3.27e-02 | 0.0246 |
| 30061 | SLC40A1 | HCC2_Meng | Human | Liver | HCC | 1.57e-40 | 6.24e-01 | 0.0107 |
| 30061 | SLC40A1 | cirrhotic1 | Human | Liver | Cirrhotic | 2.54e-08 | -1.28e-01 | 0.0202 |
| 30061 | SLC40A1 | cirrhotic2 | Human | Liver | Cirrhotic | 1.14e-19 | 2.96e-01 | 0.0201 |
| 30061 | SLC40A1 | cirrhotic3 | Human | Liver | Cirrhotic | 1.48e-04 | -1.57e-01 | 0.0215 |
| 30061 | SLC40A1 | HCC1 | Human | Liver | HCC | 4.93e-12 | 4.88e+00 | 0.5336 |
| 30061 | SLC40A1 | HCC2 | Human | Liver | HCC | 5.96e-38 | 5.94e+00 | 0.5341 |
| 30061 | SLC40A1 | Pt13.a | Human | Liver | HCC | 8.19e-06 | 4.99e-01 | 0.021 |
| 30061 | SLC40A1 | Pt13.b | Human | Liver | HCC | 8.18e-10 | 4.94e-02 | 0.0251 |
| 30061 | SLC40A1 | Pt13.c | Human | Liver | HCC | 9.03e-17 | 8.31e-01 | 0.0076 |
| Page: 1 2 3 4 5 6 7 |
| Tissue | Expression Dynamics | Abbreviation |
| Breast | 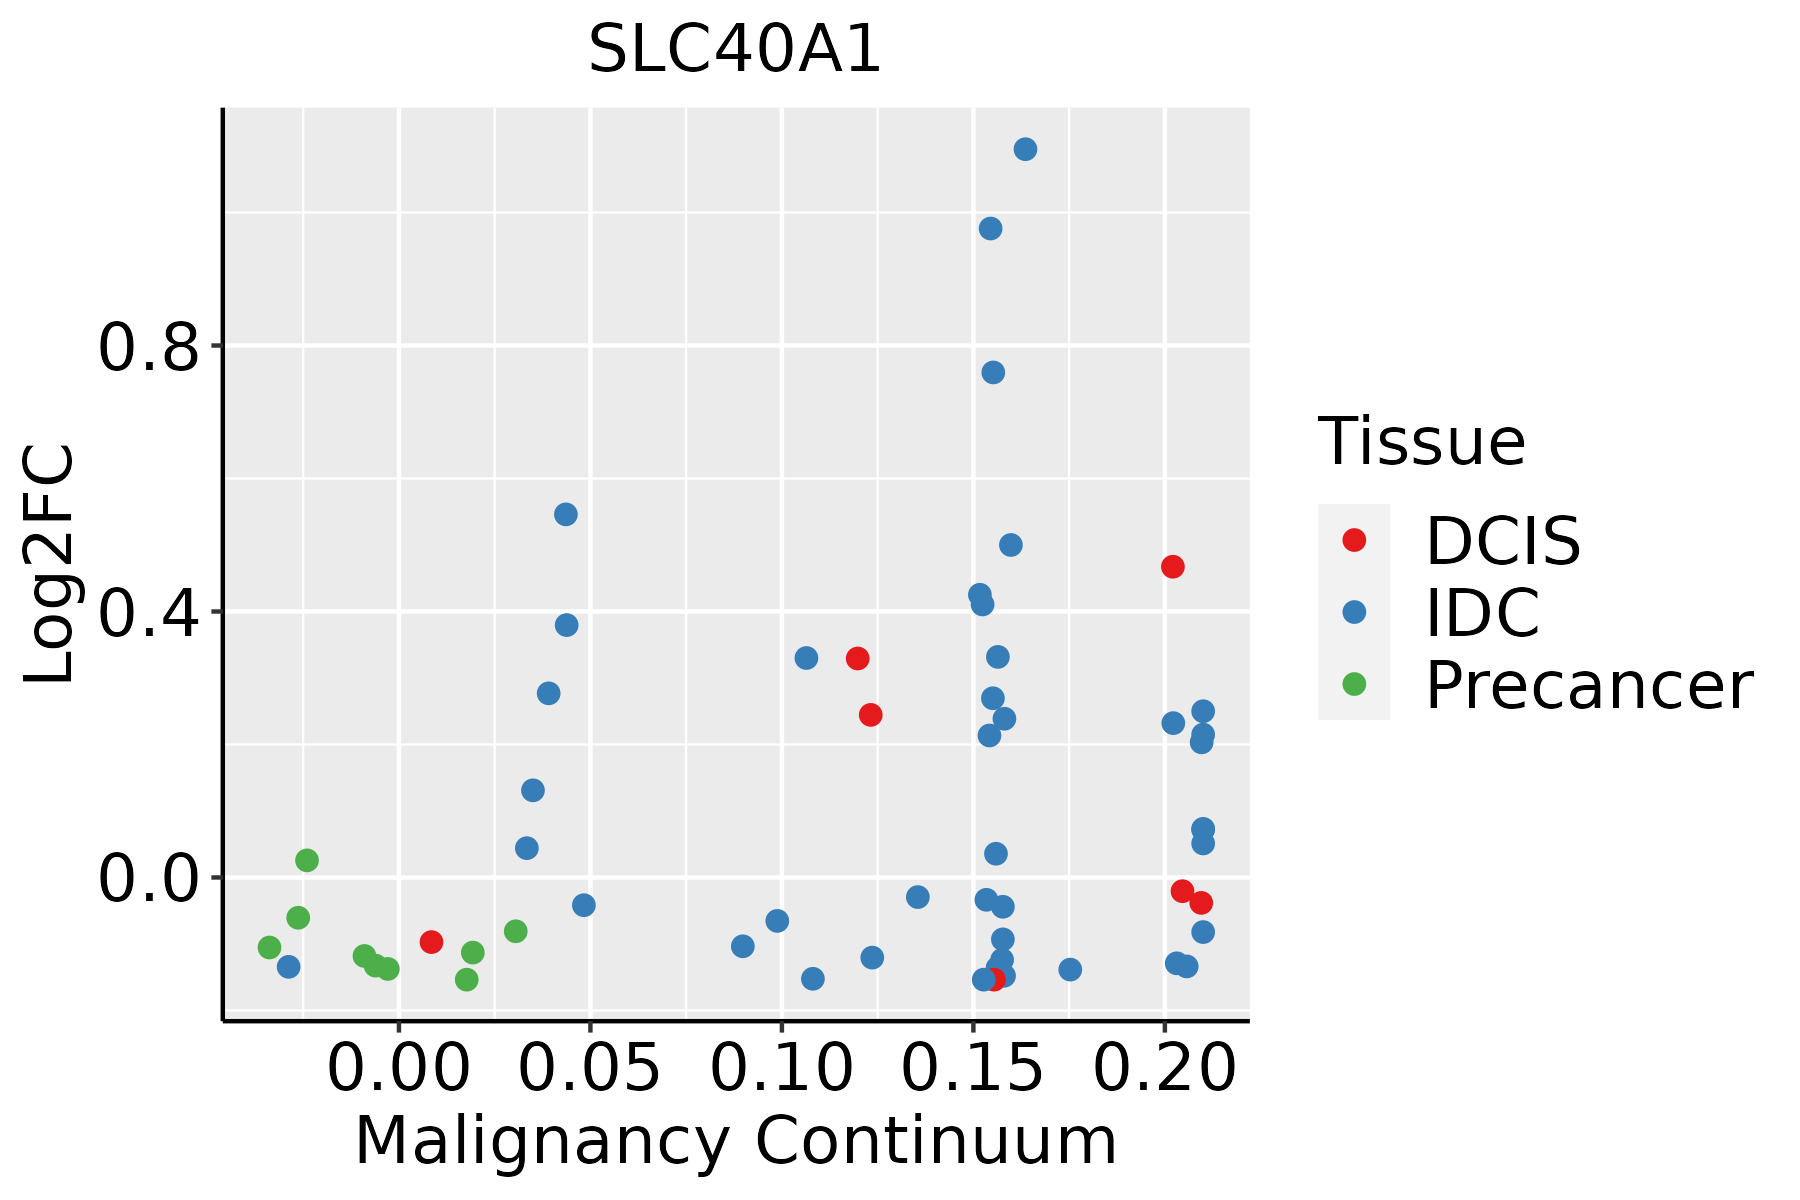 | IDC: Invasive ductal carcinoma |
| DCIS: Ductal carcinoma in situ | ||
| Precancer(BRCA1-mut): Precancerous lesion from BRCA1 mutation carriers | ||
| Colorectum (GSE201348) |  | FAP: Familial adenomatous polyposis |
| CRC: Colorectal cancer | ||
| Colorectum (HTA11) |  | AD: Adenomas |
| SER: Sessile serrated lesions | ||
| MSI-H: Microsatellite-high colorectal cancer | ||
| MSS: Microsatellite stable colorectal cancer | ||
| Endometrium |  | AEH: Atypical endometrial hyperplasia |
| EEC: Endometrioid Cancer | ||
| Esophagus |  | ESCC: Esophageal squamous cell carcinoma |
| HGIN: High-grade intraepithelial neoplasias | ||
| LGIN: Low-grade intraepithelial neoplasias | ||
| Liver |  | HCC: Hepatocellular carcinoma |
| NAFLD: Non-alcoholic fatty liver disease | ||
| Oral Cavity | 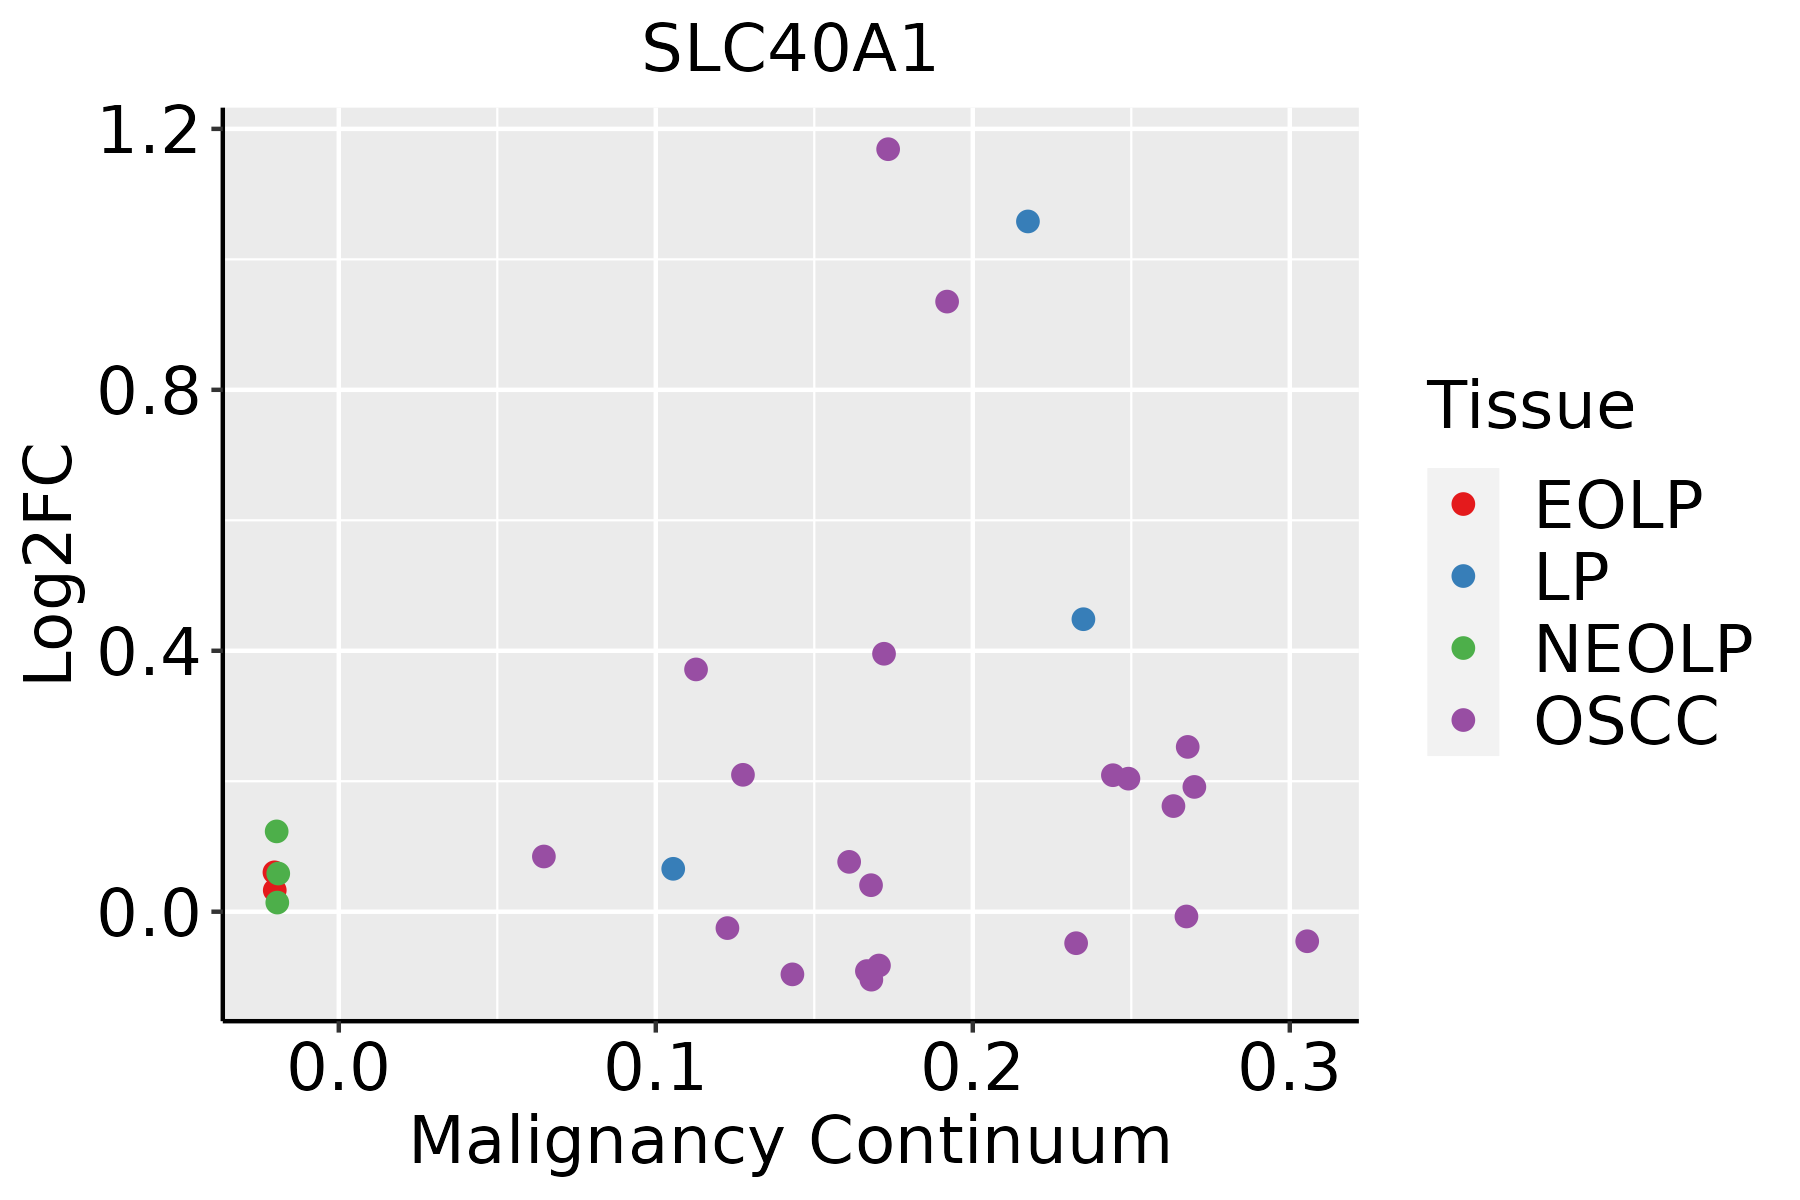 | EOLP: Erosive Oral lichen planus |
| LP: leukoplakia | ||
| NEOLP: Non-erosive oral lichen planus | ||
| OSCC: Oral squamous cell carcinoma | ||
| Prostate |  | BPH: Benign Prostatic Hyperplasia |
| Thyroid |  | ATC: Anaplastic thyroid cancer |
| HT: Hashimoto's thyroiditis | ||
| PTC: Papillary thyroid cancer |
| ∗log2FC in expression of this searched gene in stem-like cells from each diseased tissue sample relative to stem-like cells in normal samples in each tissue plotted against the malignancy continuum. Samples are colored based on if they are from different disease stage. |
Top |
Malignant transformation related pathway analysis |
| Find out the enriched GO biological processes and KEGG pathways involved in transition from healthy to precancer to cancer |
| Tissue | Disease Stage | Enriched GO biological Processes |
| Colorectum | AD |  |
| Colorectum | SER |  |
| Colorectum | MSS |  |
| Colorectum | MSI-H |  |
| Colorectum | FAP |  |
| ∗Top 15 enriched GO BP terms are showed in the bar plot of each disease state in each tissue. Each row represents a significant GO biological process which is colored according to the -log10(p.adjust). |
| Page: 1 2 3 4 5 6 7 8 9 |
| GO ID | Tissue | Disease Stage | Description | Gene Ratio | Bg Ratio | pvalue | p.adjust | Count |
| GO:005507613 | Breast | IDC | transition metal ion homeostasis | 23/1434 | 138/18723 | 3.20e-04 | 4.79e-03 | 23 |
| GO:004691612 | Breast | IDC | cellular transition metal ion homeostasis | 20/1434 | 115/18723 | 4.35e-04 | 5.90e-03 | 20 |
| GO:000682611 | Breast | IDC | iron ion transport | 11/1434 | 58/18723 | 4.10e-03 | 3.25e-02 | 11 |
| GO:005507212 | Breast | IDC | iron ion homeostasis | 14/1434 | 85/18723 | 4.98e-03 | 3.77e-02 | 14 |
| GO:0070839 | Breast | IDC | metal ion export | 10/1434 | 54/18723 | 7.22e-03 | 4.96e-02 | 10 |
| GO:005507622 | Breast | DCIS | transition metal ion homeostasis | 23/1390 | 138/18723 | 2.04e-04 | 3.27e-03 | 23 |
| GO:004691621 | Breast | DCIS | cellular transition metal ion homeostasis | 20/1390 | 115/18723 | 2.91e-04 | 4.27e-03 | 20 |
| GO:000682621 | Breast | DCIS | iron ion transport | 11/1390 | 58/18723 | 3.23e-03 | 2.73e-02 | 11 |
| GO:005507221 | Breast | DCIS | iron ion homeostasis | 14/1390 | 85/18723 | 3.78e-03 | 3.03e-02 | 14 |
| GO:00708391 | Breast | DCIS | metal ion export | 10/1390 | 54/18723 | 5.83e-03 | 4.18e-02 | 10 |
| GO:0055076 | Colorectum | AD | transition metal ion homeostasis | 53/3918 | 138/18723 | 1.89e-06 | 5.65e-05 | 53 |
| GO:0046916 | Colorectum | AD | cellular transition metal ion homeostasis | 43/3918 | 115/18723 | 3.62e-05 | 6.56e-04 | 43 |
| GO:0055072 | Colorectum | AD | iron ion homeostasis | 32/3918 | 85/18723 | 2.97e-04 | 3.60e-03 | 32 |
| GO:0006879 | Colorectum | AD | cellular iron ion homeostasis | 25/3918 | 67/18723 | 1.51e-03 | 1.27e-02 | 25 |
| GO:00550762 | Colorectum | MSS | transition metal ion homeostasis | 45/3467 | 138/18723 | 4.99e-05 | 9.02e-04 | 45 |
| GO:00550722 | Colorectum | MSS | iron ion homeostasis | 29/3467 | 85/18723 | 4.44e-04 | 5.32e-03 | 29 |
| GO:00469162 | Colorectum | MSS | cellular transition metal ion homeostasis | 35/3467 | 115/18723 | 1.33e-03 | 1.26e-02 | 35 |
| GO:00068791 | Colorectum | MSS | cellular iron ion homeostasis | 22/3467 | 67/18723 | 3.57e-03 | 2.64e-02 | 22 |
| GO:00550764 | Colorectum | FAP | transition metal ion homeostasis | 33/2622 | 138/18723 | 1.22e-03 | 1.14e-02 | 33 |
| GO:00550723 | Colorectum | FAP | iron ion homeostasis | 21/2622 | 85/18723 | 5.89e-03 | 3.75e-02 | 21 |
| Page: 1 2 3 |
| Pathway ID | Tissue | Disease Stage | Description | Gene Ratio | Bg Ratio | pvalue | p.adjust | qvalue | Count |
| hsa0497812 | Breast | IDC | Mineral absorption | 13/867 | 60/8465 | 6.73e-03 | 3.42e-02 | 2.56e-02 | 13 |
| hsa0497813 | Breast | IDC | Mineral absorption | 13/867 | 60/8465 | 6.73e-03 | 3.42e-02 | 2.56e-02 | 13 |
| hsa0497821 | Breast | DCIS | Mineral absorption | 13/846 | 60/8465 | 5.48e-03 | 2.81e-02 | 2.07e-02 | 13 |
| hsa0497831 | Breast | DCIS | Mineral absorption | 13/846 | 60/8465 | 5.48e-03 | 2.81e-02 | 2.07e-02 | 13 |
| hsa04216 | Colorectum | AD | Ferroptosis | 21/2092 | 41/8465 | 2.23e-04 | 1.78e-03 | 1.13e-03 | 21 |
| hsa042161 | Colorectum | AD | Ferroptosis | 21/2092 | 41/8465 | 2.23e-04 | 1.78e-03 | 1.13e-03 | 21 |
| hsa042162 | Colorectum | MSS | Ferroptosis | 18/1875 | 41/8465 | 1.53e-03 | 8.53e-03 | 5.23e-03 | 18 |
| hsa042163 | Colorectum | MSS | Ferroptosis | 18/1875 | 41/8465 | 1.53e-03 | 8.53e-03 | 5.23e-03 | 18 |
| hsa042164 | Colorectum | FAP | Ferroptosis | 18/1404 | 41/8465 | 3.49e-05 | 3.65e-04 | 2.22e-04 | 18 |
| hsa042165 | Colorectum | FAP | Ferroptosis | 18/1404 | 41/8465 | 3.49e-05 | 3.65e-04 | 2.22e-04 | 18 |
| hsa042166 | Colorectum | CRC | Ferroptosis | 13/1091 | 41/8465 | 1.36e-03 | 1.08e-02 | 7.33e-03 | 13 |
| hsa042167 | Colorectum | CRC | Ferroptosis | 13/1091 | 41/8465 | 1.36e-03 | 1.08e-02 | 7.33e-03 | 13 |
| hsa0421616 | Endometrium | AEH | Ferroptosis | 15/1197 | 41/8465 | 2.83e-04 | 2.30e-03 | 1.68e-03 | 15 |
| hsa0421617 | Endometrium | AEH | Ferroptosis | 15/1197 | 41/8465 | 2.83e-04 | 2.30e-03 | 1.68e-03 | 15 |
| hsa0421625 | Endometrium | EEC | Ferroptosis | 16/1237 | 41/8465 | 1.09e-04 | 1.08e-03 | 8.08e-04 | 16 |
| hsa0421635 | Endometrium | EEC | Ferroptosis | 16/1237 | 41/8465 | 1.09e-04 | 1.08e-03 | 8.08e-04 | 16 |
| hsa0421629 | Esophagus | ESCC | Ferroptosis | 33/4205 | 41/8465 | 4.58e-05 | 1.99e-04 | 1.02e-04 | 33 |
| hsa0421638 | Esophagus | ESCC | Ferroptosis | 33/4205 | 41/8465 | 4.58e-05 | 1.99e-04 | 1.02e-04 | 33 |
| hsa0421621 | Liver | Cirrhotic | Ferroptosis | 23/2530 | 41/8465 | 4.09e-04 | 2.57e-03 | 1.58e-03 | 23 |
| hsa0421631 | Liver | Cirrhotic | Ferroptosis | 23/2530 | 41/8465 | 4.09e-04 | 2.57e-03 | 1.58e-03 | 23 |
| Page: 1 2 |
Top |
Cell-cell communication analysis |
| Identification of potential cell-cell interactions between two cell types and their ligand-receptor pairs for different disease states |
| Ligand | Receptor | LRpair | Pathway | Tissue | Disease Stage |
| Page: 1 |
Top |
Single-cell gene regulatory network inference analysis |
| Find out the significant the regulons (TFs) and the target genes of each regulon across cell types for different disease states |
| TF | Cell Type | Tissue | Disease Stage | Target Gene | RSS | Regulon Activity |
| ∗The dot plots of a searched regulon are shown for all cell subpopulations in each disease state of each tissue based on the regulon specific score inferred using pySCENIC and by calculating the average expression. |
| Page: 1 |
Top |
Somatic mutation of malignant transformation related genes |
| Annotation of somatic variants for genes involved in malignant transformation |
| Hugo Symbol | Variant Class | Variant Classification | dbSNP RS | HGVSc | HGVSp | HGVSp Short | SWISSPROT | BIOTYPE | SIFT | PolyPhen | Tumor Sample Barcode | Tissue | Histology | Sex | Age | Stage | Therapy Types | Drugs | Outcome |
| SLC40A1 | SNV | Missense_Mutation | rs142456282 | c.1570N>A | p.Val524Ile | p.V524I | Q9NP59 | protein_coding | tolerated(0.12) | probably_damaging(1) | TCGA-BH-A1FC-01 | Breast | breast invasive carcinoma | Female | >=65 | I/II | Unknown | Unknown | SD |
| SLC40A1 | SNV | Missense_Mutation | c.1121T>G | p.Leu374Arg | p.L374R | Q9NP59 | protein_coding | deleterious(0) | possibly_damaging(0.682) | TCGA-E2-A154-01 | Breast | breast invasive carcinoma | Female | >=65 | I/II | Hormone Therapy | arimidex | SD | |
| SLC40A1 | SNV | Missense_Mutation | rs146240138 | c.1111C>T | p.Arg371Trp | p.R371W | Q9NP59 | protein_coding | deleterious(0) | possibly_damaging(0.809) | TCGA-E2-A15O-01 | Breast | breast invasive carcinoma | Female | >=65 | I/II | Hormone Therapy | arimidex | PD |
| SLC40A1 | SNV | Missense_Mutation | c.1190C>A | p.Pro397His | p.P397H | Q9NP59 | protein_coding | deleterious(0) | probably_damaging(0.983) | TCGA-E2-A1L9-01 | Breast | breast invasive carcinoma | Female | <65 | I/II | Chemotherapy | cytoxan | SD | |
| SLC40A1 | insertion | Nonsense_Mutation | novel | c.1473_1474insCCCTACCCTTTAAGAAAATAAAAG | p.Ile491_Ile492insProTyrProLeuArgLysTerLys | p.I491_I492insPYPLRK*K | Q9NP59 | protein_coding | TCGA-AN-A0FX-01 | Breast | breast invasive carcinoma | Female | <65 | I/II | Unknown | Unknown | SD | ||
| SLC40A1 | deletion | Frame_Shift_Del | novel | c.308delT | p.Val103AlafsTer8 | p.V103Afs*8 | Q9NP59 | protein_coding | TCGA-D8-A27V-01 | Breast | breast invasive carcinoma | Female | <65 | I/II | Hormone Therapy | tamoxiphen | SD | ||
| SLC40A1 | SNV | Missense_Mutation | c.284C>T | p.Ser95Leu | p.S95L | Q9NP59 | protein_coding | deleterious(0.04) | probably_damaging(0.991) | TCGA-2W-A8YY-01 | Cervix | cervical & endocervical cancer | Female | <65 | I/II | Chemotherapy | cisplatin | CR | |
| SLC40A1 | SNV | Missense_Mutation | novel | c.1552N>A | p.Glu518Lys | p.E518K | Q9NP59 | protein_coding | deleterious(0.01) | possibly_damaging(0.871) | TCGA-VS-A958-01 | Cervix | cervical & endocervical cancer | Female | <65 | I/II | Chemotherapy | cisplatin | CR |
| SLC40A1 | SNV | Missense_Mutation | c.1236C>A | p.Phe412Leu | p.F412L | Q9NP59 | protein_coding | tolerated(0.73) | benign(0.003) | TCGA-A6-6141-01 | Colorectum | colon adenocarcinoma | Male | <65 | I/II | Chemotherapy | 5-fu | SD | |
| SLC40A1 | SNV | Missense_Mutation | rs80248011 | c.118C>T | p.Arg40Trp | p.R40W | Q9NP59 | protein_coding | deleterious(0) | probably_damaging(0.999) | TCGA-AA-3984-01 | Colorectum | colon adenocarcinoma | Female | <65 | I/II | Unknown | Unknown | SD |
| Page: 1 2 3 4 5 |
Top |
Related drugs of malignant transformation related genes |
| Identification of chemicals and drugs interact with genes involved in malignant transfromation |
| (DGIdb 4.0) |
| Entrez ID | Symbol | Category | Interaction Types | Drug Claim Name | Drug Name | PMIDs |
| 30061 | SLC40A1 | TRANSPORTER, DRUGGABLE GENOME | Ferroportin mab | 24552640 | ||
| 30061 | SLC40A1 | TRANSPORTER, DRUGGABLE GENOME | LY2928057 | 22290531 | ||
| 30061 | SLC40A1 | TRANSPORTER, DRUGGABLE GENOME | antibody | 252166626 |
| Page: 1 |

Copyright 2023-Present -The University of Texas Health Science Center at Houston |