
|
|||||
|
 | |
| |
| |
| |
| |
| |
|
Gene: ZNF524 |
Gene summary for ZNF524 |
| Gene information | Species | Human | Gene symbol | ZNF524 | Gene ID | 147807 |
| Gene name | zinc finger protein 524 | |
| Gene Alias | ZNF524 | |
| Cytomap | 19q13.42 | |
| Gene Type | protein-coding | GO ID | GO:0006139 | UniProtAcc | Q96C55 |
Top |
Malignant transformation analysis |
| Identification of the aberrant gene expression in precancerous and cancerous lesions by comparing the gene expression of stem-like cells in diseased tissues with normal stem cells |
| Entrez ID | Symbol | Replicates | Species | Organ | Tissue | Adj P-value | Log2FC | Malignancy |
| 147807 | ZNF524 | C06 | Human | Oral cavity | OSCC | 5.08e-03 | 6.67e-01 | 0.2699 |
| 147807 | ZNF524 | C07 | Human | Oral cavity | OSCC | 2.83e-02 | 6.94e-01 | 0.2491 |
| 147807 | ZNF524 | C08 | Human | Oral cavity | OSCC | 9.23e-09 | 3.17e-01 | 0.1919 |
| 147807 | ZNF524 | C09 | Human | Oral cavity | OSCC | 3.12e-04 | 2.37e-01 | 0.1431 |
| 147807 | ZNF524 | LN38 | Human | Oral cavity | OSCC | 1.71e-02 | 7.10e-01 | 0.168 |
| 147807 | ZNF524 | LN46 | Human | Oral cavity | OSCC | 1.18e-06 | 4.52e-01 | 0.1666 |
| 147807 | ZNF524 | LP15 | Human | Oral cavity | LP | 3.06e-03 | 6.54e-01 | 0.2174 |
| 147807 | ZNF524 | SYSMH1 | Human | Oral cavity | OSCC | 1.77e-17 | 3.29e-01 | 0.1127 |
| 147807 | ZNF524 | SYSMH2 | Human | Oral cavity | OSCC | 1.88e-16 | 4.05e-01 | 0.2326 |
| 147807 | ZNF524 | SYSMH3 | Human | Oral cavity | OSCC | 1.06e-18 | 4.78e-01 | 0.2442 |
| 147807 | ZNF524 | SYSMH4 | Human | Oral cavity | OSCC | 5.08e-07 | 2.15e-01 | 0.1226 |
| 147807 | ZNF524 | SYSMH6 | Human | Oral cavity | OSCC | 8.71e-15 | 3.40e-01 | 0.1275 |
| 147807 | ZNF524 | male-WTA | Human | Thyroid | PTC | 1.29e-11 | 1.39e-01 | 0.1037 |
| 147807 | ZNF524 | PTC01 | Human | Thyroid | PTC | 4.66e-10 | 2.43e-01 | 0.1899 |
| 147807 | ZNF524 | PTC04 | Human | Thyroid | PTC | 2.24e-09 | 1.93e-01 | 0.1927 |
| 147807 | ZNF524 | PTC05 | Human | Thyroid | PTC | 2.85e-19 | 7.47e-01 | 0.2065 |
| 147807 | ZNF524 | PTC06 | Human | Thyroid | PTC | 1.41e-24 | 5.79e-01 | 0.2057 |
| 147807 | ZNF524 | PTC07 | Human | Thyroid | PTC | 3.63e-25 | 5.13e-01 | 0.2044 |
| 147807 | ZNF524 | ATC11 | Human | Thyroid | ATC | 8.82e-03 | 3.49e-01 | 0.3386 |
| 147807 | ZNF524 | ATC12 | Human | Thyroid | ATC | 2.33e-07 | 1.47e-01 | 0.34 |
| Page: 1 2 3 4 5 6 |
| Tissue | Expression Dynamics | Abbreviation |
| Esophagus |  | ESCC: Esophageal squamous cell carcinoma |
| HGIN: High-grade intraepithelial neoplasias | ||
| LGIN: Low-grade intraepithelial neoplasias | ||
| Liver | 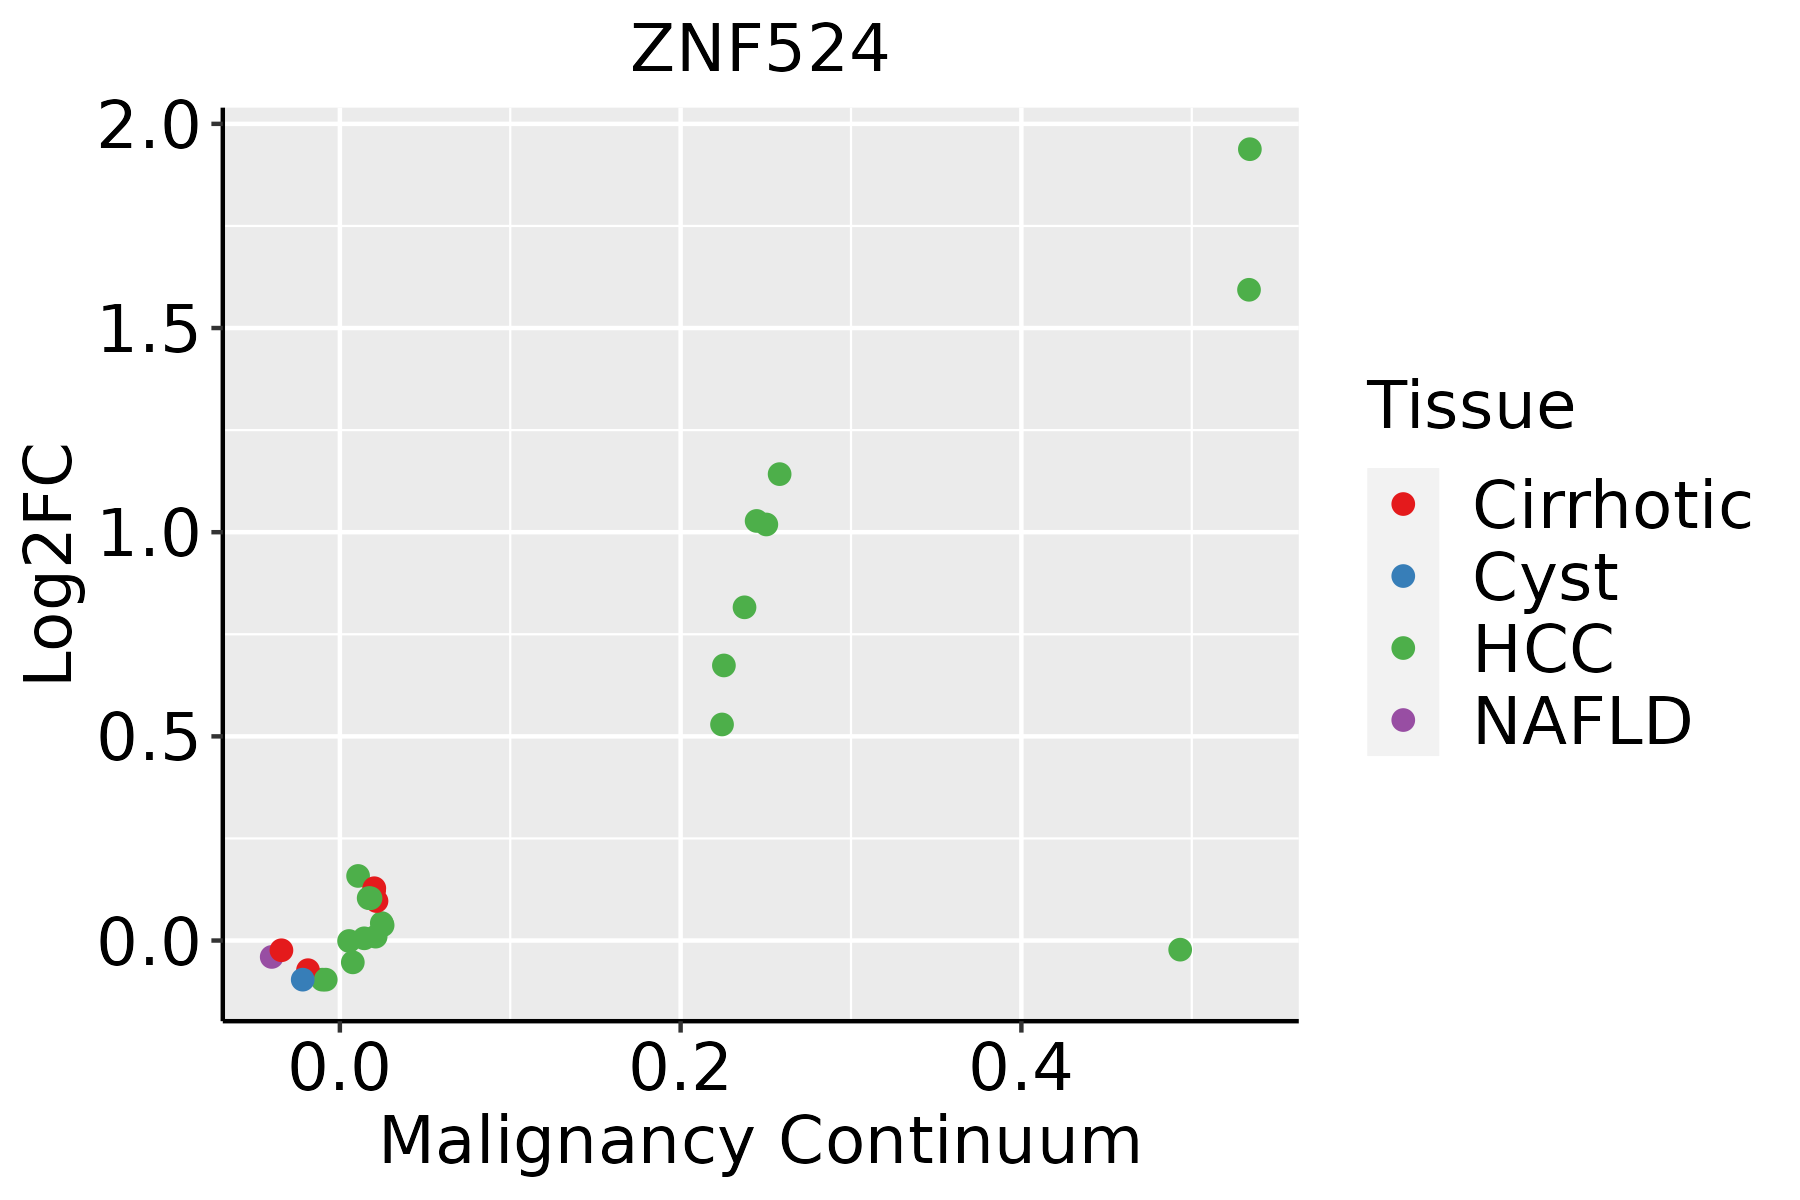 | HCC: Hepatocellular carcinoma |
| NAFLD: Non-alcoholic fatty liver disease | ||
| Oral Cavity | 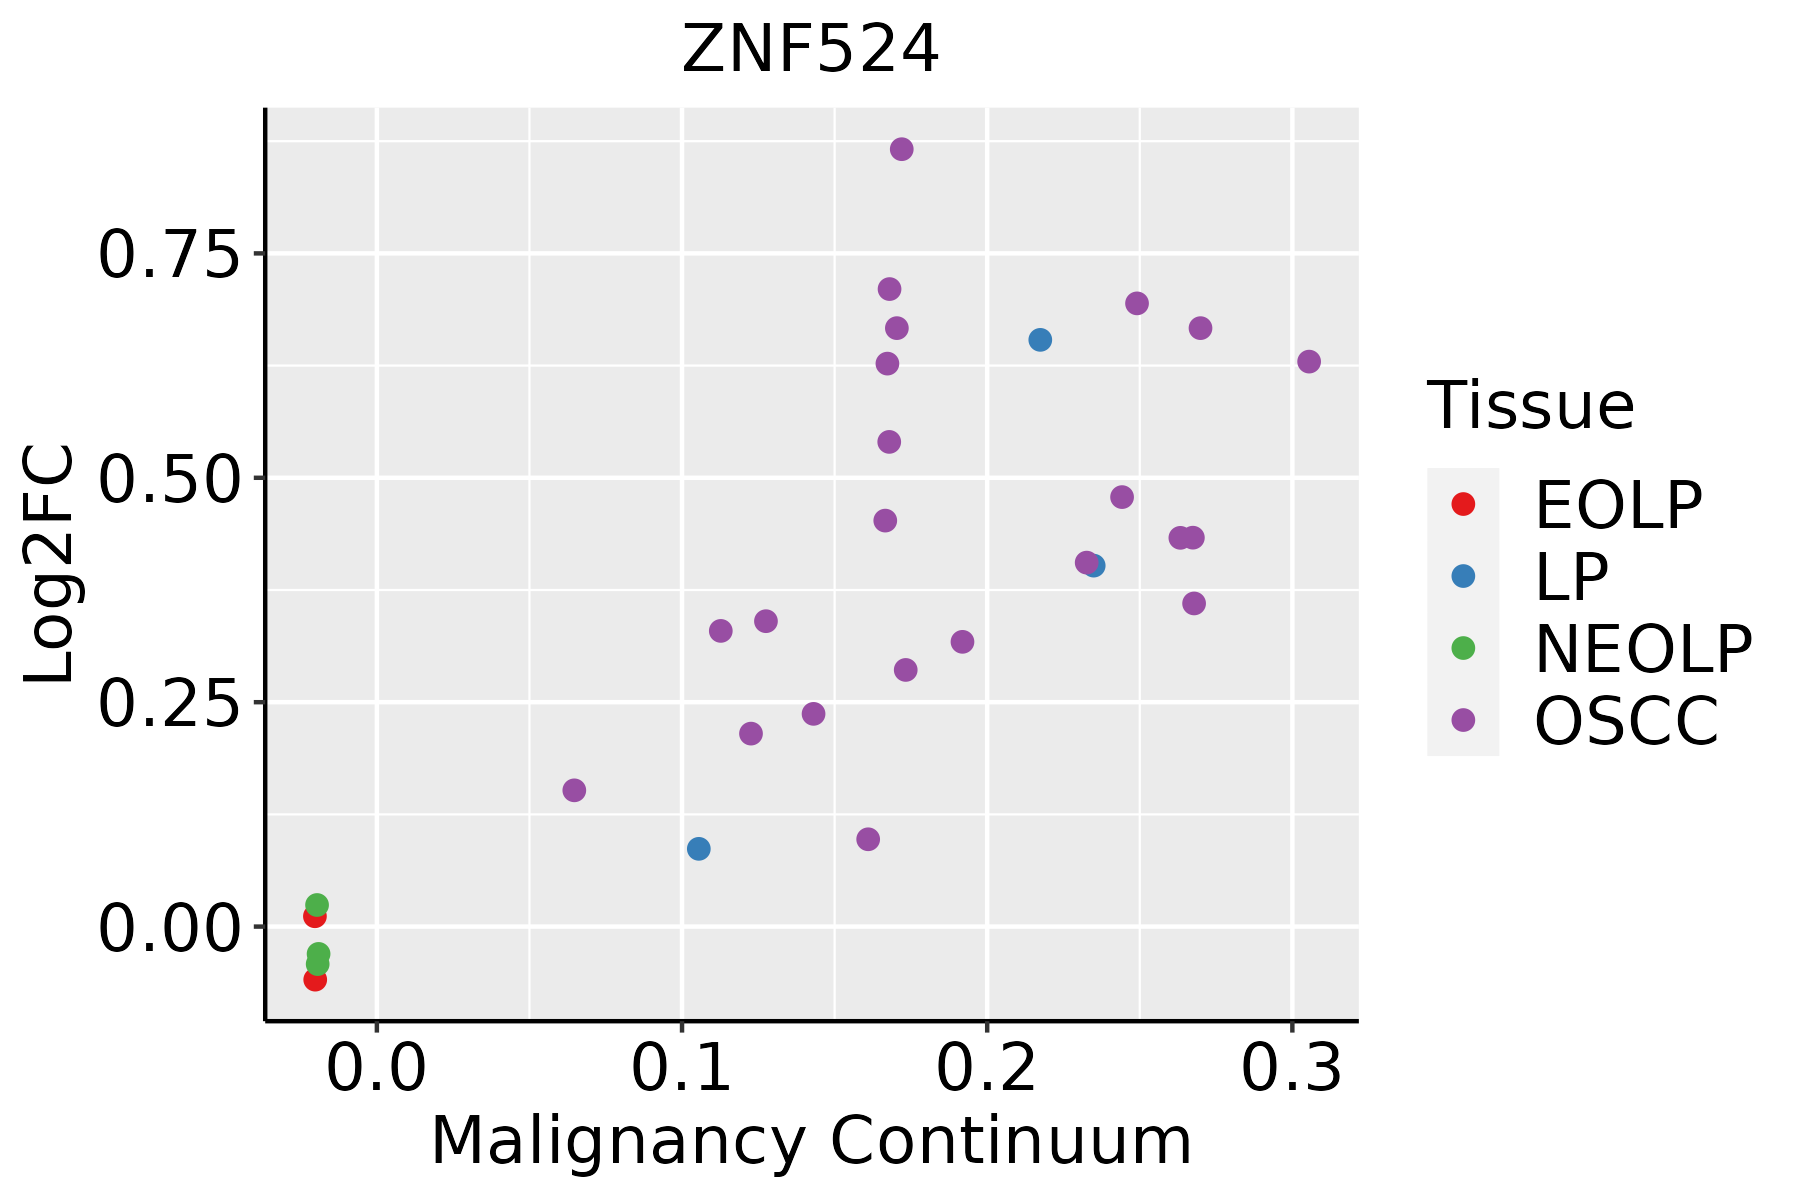 | EOLP: Erosive Oral lichen planus |
| LP: leukoplakia | ||
| NEOLP: Non-erosive oral lichen planus | ||
| OSCC: Oral squamous cell carcinoma | ||
| Thyroid | 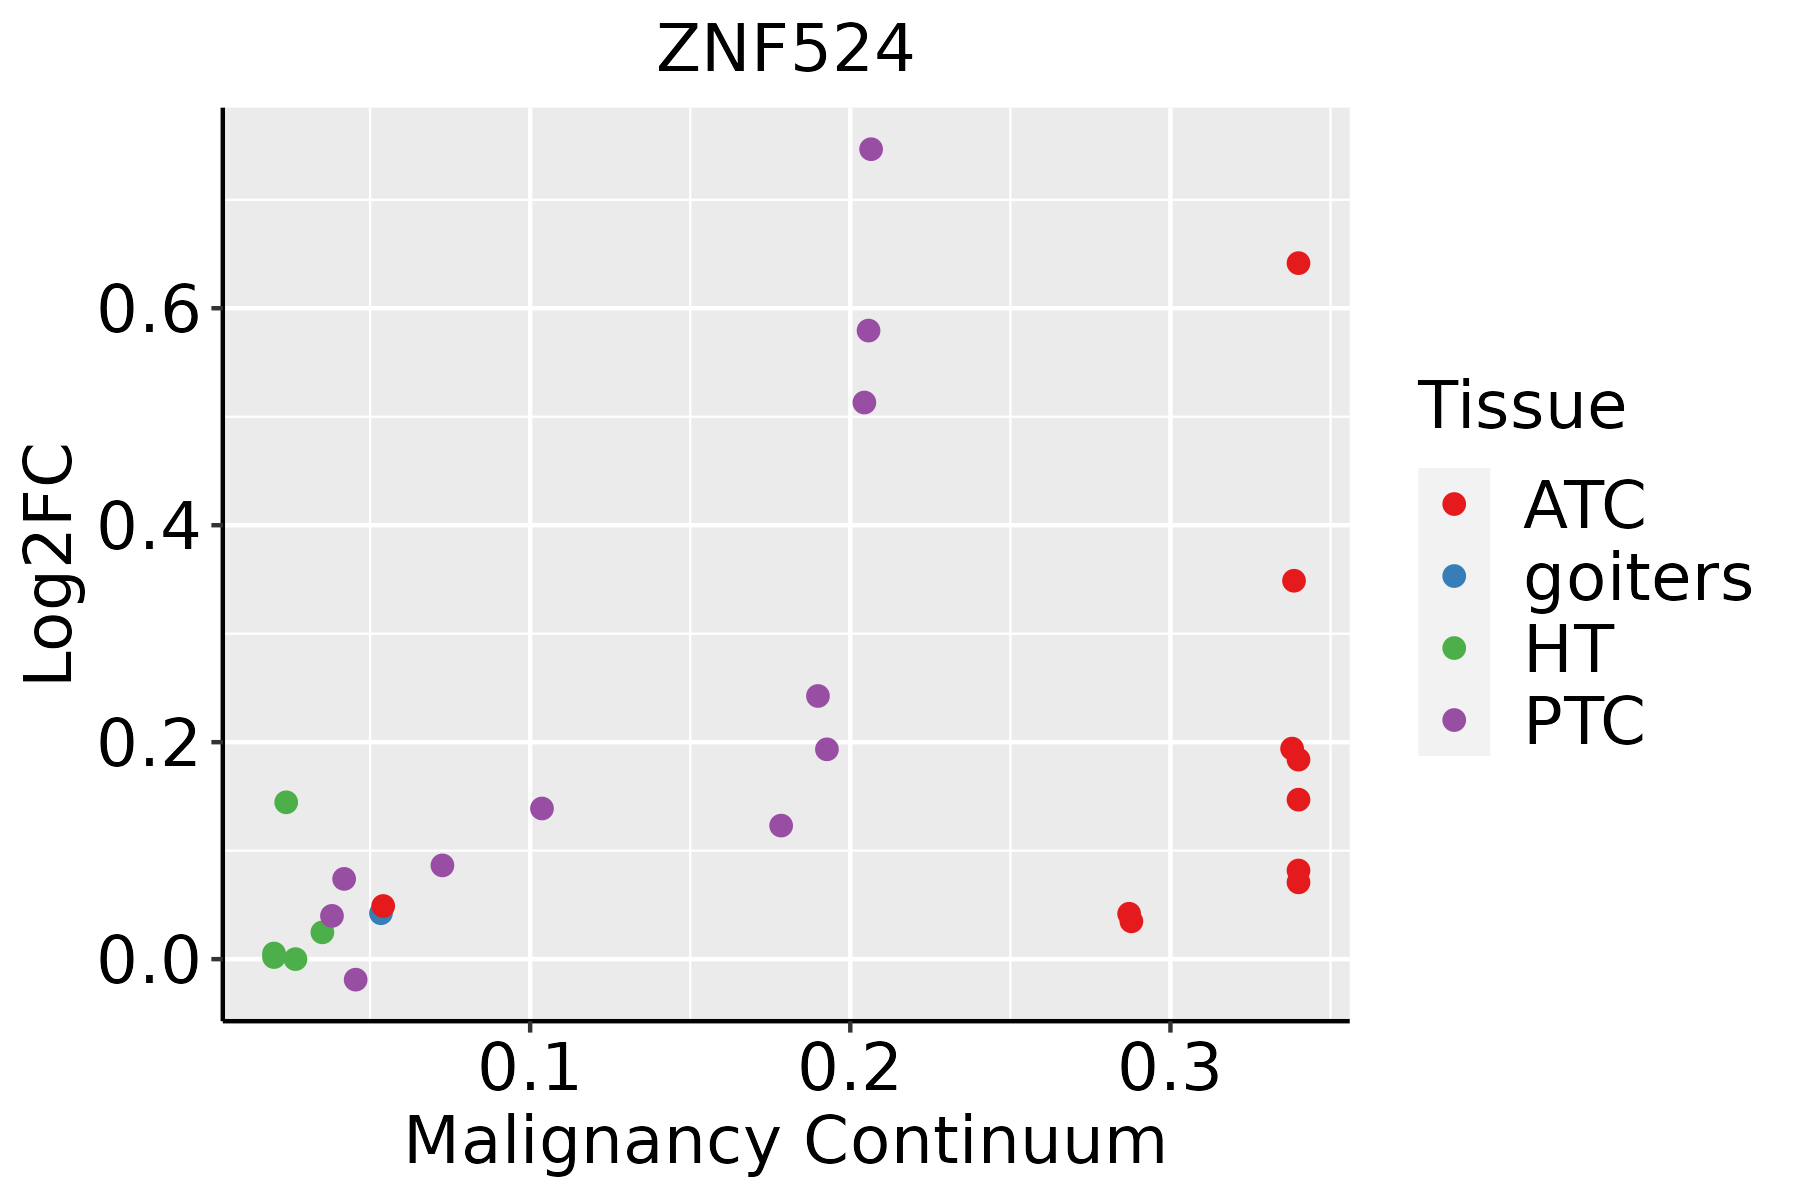 | ATC: Anaplastic thyroid cancer |
| HT: Hashimoto's thyroiditis | ||
| PTC: Papillary thyroid cancer |
| ∗log2FC in expression of this searched gene in stem-like cells from each diseased tissue sample relative to stem-like cells in normal samples in each tissue plotted against the malignancy continuum. Samples are colored based on if they are from different disease stage. |
Top |
Malignant transformation related pathway analysis |
| Find out the enriched GO biological processes and KEGG pathways involved in transition from healthy to precancer to cancer |
| Tissue | Disease Stage | Enriched GO biological Processes |
| Colorectum | AD |  |
| Colorectum | SER |  |
| Colorectum | MSS |  |
| Colorectum | MSI-H |  |
| Colorectum | FAP |  |
| ∗Top 15 enriched GO BP terms are showed in the bar plot of each disease state in each tissue. Each row represents a significant GO biological process which is colored according to the -log10(p.adjust). |
| Page: 1 2 3 4 5 6 7 8 9 |
| GO ID | Tissue | Disease Stage | Description | Gene Ratio | Bg Ratio | pvalue | p.adjust | Count |
| Page: 1 |
| Pathway ID | Tissue | Disease Stage | Description | Gene Ratio | Bg Ratio | pvalue | p.adjust | qvalue | Count |
| Page: 1 |
Top |
Cell-cell communication analysis |
| Identification of potential cell-cell interactions between two cell types and their ligand-receptor pairs for different disease states |
| Ligand | Receptor | LRpair | Pathway | Tissue | Disease Stage |
| Page: 1 |
Top |
Single-cell gene regulatory network inference analysis |
| Find out the significant the regulons (TFs) and the target genes of each regulon across cell types for different disease states |
| TF | Cell Type | Tissue | Disease Stage | Target Gene | RSS | Regulon Activity |
| ZNF524 | INMON | Breast | ADJ | DRAIC,CLPB,SERPINE2, etc. | 7.51e-02 |  |
| ZNF524 | CD8TEFF | Breast | Healthy | DRAIC,CLPB,SERPINE2, etc. | 4.21e-02 |  |
| ZNF524 | NK | Breast | Precancer | DRAIC,CLPB,SERPINE2, etc. | 4.89e-02 |  |
| ZNF524 | INMON | Pancreas | PDAC | SPARCL1,SPRY1,IGFBP4, etc. | 1.11e-01 |  |
| ZNF524 | CD8TEXINT | Pancreas | PDAC | SPARCL1,SPRY1,IGFBP4, etc. | 9.06e-02 | |
| ZNF524 | BMEM | Pancreas | PDAC | SPARCL1,SPRY1,IGFBP4, etc. | 6.84e-02 | |
| ZNF524 | M1MAC | Pancreas | PDAC | SPARCL1,SPRY1,IGFBP4, etc. | 7.75e-02 | |
| ZNF524 | TREG | Prostate | Tumor | COL6A2,GFER,NOXA1, etc. | 1.38e-01 |  |
| ZNF524 | CD8TEXINT | Skin | ADJ | SELENOK,BNIP3,NEXN, etc. | 1.19e-01 |  |
| ZNF524 | CD8TEXINT | Skin | cSCC | SELENOK,BNIP3,NEXN, etc. | 1.63e-01 |  |
| ∗The dot plots of a searched regulon are shown for all cell subpopulations in each disease state of each tissue based on the regulon specific score inferred using pySCENIC and by calculating the average expression. |
| Page: 1 2 |
Top |
Somatic mutation of malignant transformation related genes |
| Annotation of somatic variants for genes involved in malignant transformation |
| Hugo Symbol | Variant Class | Variant Classification | dbSNP RS | HGVSc | HGVSp | HGVSp Short | SWISSPROT | BIOTYPE | SIFT | PolyPhen | Tumor Sample Barcode | Tissue | Histology | Sex | Age | Stage | Therapy Types | Drugs | Outcome |
| ZNF524 | SNV | Missense_Mutation | novel | c.262G>C | p.Asp88His | p.D88H | Q96C55 | protein_coding | tolerated(0.1) | probably_damaging(0.999) | TCGA-JW-A5VL-01 | Cervix | cervical & endocervical cancer | Female | <65 | I/II | Unknown | Unknown | SD |
| ZNF524 | SNV | Missense_Mutation | novel | c.394N>A | p.His132Asn | p.H132N | Q96C55 | protein_coding | deleterious(0) | probably_damaging(0.997) | TCGA-DM-A1HB-01 | Colorectum | colon adenocarcinoma | Male | >=65 | III/IV | Unknown | Unknown | SD |
| ZNF524 | SNV | Missense_Mutation | rs141376459 | c.23N>T | p.Pro8Leu | p.P8L | Q96C55 | protein_coding | deleterious_low_confidence(0.04) | possibly_damaging(0.456) | TCGA-F4-6807-01 | Colorectum | colon adenocarcinoma | Female | <65 | III/IV | Chemotherapy | xeloda | CR |
| ZNF524 | deletion | Frame_Shift_Del | c.214delG | p.Val72Ter | p.V72* | Q96C55 | protein_coding | TCGA-5M-AAT6-01 | Colorectum | colon adenocarcinoma | Female | <65 | III/IV | Unknown | Unknown | PD | |||
| ZNF524 | deletion | Frame_Shift_Del | c.210delN | p.Val72Ter | p.V72* | Q96C55 | protein_coding | TCGA-A6-6653-01 | Colorectum | colon adenocarcinoma | Male | >=65 | I/II | Unknown | Unknown | SD | |||
| ZNF524 | insertion | Frame_Shift_Ins | rs750719825 | c.167_168insC | p.Lys59GlnfsTer31 | p.K59Qfs*31 | Q96C55 | protein_coding | TCGA-AA-3492-01 | Colorectum | colon adenocarcinoma | Female | >=65 | I/II | Unknown | Unknown | SD | ||
| ZNF524 | SNV | Missense_Mutation | novel | c.48G>T | p.Glu16Asp | p.E16D | Q96C55 | protein_coding | deleterious_low_confidence(0.03) | possibly_damaging(0.672) | TCGA-A5-A0G2-01 | Endometrium | uterine corpus endometrioid carcinoma | Female | <65 | III/IV | Unknown | Unknown | SD |
| ZNF524 | SNV | Missense_Mutation | novel | c.392N>A | p.Arg131His | p.R131H | Q96C55 | protein_coding | deleterious(0) | probably_damaging(0.999) | TCGA-AJ-A3OL-01 | Endometrium | uterine corpus endometrioid carcinoma | Female | <65 | III/IV | Chemotherapy | carboplatin | PD |
| ZNF524 | SNV | Missense_Mutation | novel | c.302N>T | p.Ala101Val | p.A101V | Q96C55 | protein_coding | tolerated(0.41) | benign(0.006) | TCGA-AX-A3FS-01 | Endometrium | uterine corpus endometrioid carcinoma | Female | >=65 | I/II | Unknown | Unknown | SD |
| ZNF524 | SNV | Missense_Mutation | c.131N>A | p.Arg44Gln | p.R44Q | Q96C55 | protein_coding | tolerated_low_confidence(0.47) | benign(0) | TCGA-D1-A103-01 | Endometrium | uterine corpus endometrioid carcinoma | Female | >=65 | I/II | Unknown | Unknown | SD |
| Page: 1 2 3 4 |
Top |
Related drugs of malignant transformation related genes |
| Identification of chemicals and drugs interact with genes involved in malignant transfromation |
| (DGIdb 4.0) |
| Entrez ID | Symbol | Category | Interaction Types | Drug Claim Name | Drug Name | PMIDs |
| Page: 1 |

Copyright 2023-Present -The University of Texas Health Science Center at Houston |