
|
|||||
|
 | |
| |
| |
| |
| |
| |
|
Gene: ZNF503 |
Gene summary for ZNF503 |
| Gene information | Species | Human | Gene symbol | ZNF503 | Gene ID | 84858 |
| Gene name | zinc finger protein 503 | |
| Gene Alias | NOLZ-1 | |
| Cytomap | 10q22.2 | |
| Gene Type | protein-coding | GO ID | GO:0006139 | UniProtAcc | Q96F45 |
Top |
Malignant transformation analysis |
| Identification of the aberrant gene expression in precancerous and cancerous lesions by comparing the gene expression of stem-like cells in diseased tissues with normal stem cells |
| Entrez ID | Symbol | Replicates | Species | Organ | Tissue | Adj P-value | Log2FC | Malignancy |
| 84858 | ZNF503 | P62T-E | Human | Esophagus | ESCC | 1.90e-12 | 5.90e-01 | 0.1302 |
| 84858 | ZNF503 | P65T-E | Human | Esophagus | ESCC | 1.92e-32 | 9.17e-01 | 0.0978 |
| 84858 | ZNF503 | P74T-E | Human | Esophagus | ESCC | 4.67e-12 | 8.07e-01 | 0.1479 |
| 84858 | ZNF503 | P75T-E | Human | Esophagus | ESCC | 7.54e-10 | 5.55e-01 | 0.1125 |
| 84858 | ZNF503 | P76T-E | Human | Esophagus | ESCC | 7.94e-10 | 1.95e-01 | 0.1207 |
| 84858 | ZNF503 | P79T-E | Human | Esophagus | ESCC | 3.85e-17 | 5.90e-01 | 0.1154 |
| 84858 | ZNF503 | P80T-E | Human | Esophagus | ESCC | 9.19e-08 | 5.16e-01 | 0.155 |
| 84858 | ZNF503 | P83T-E | Human | Esophagus | ESCC | 1.59e-05 | 3.27e-01 | 0.1738 |
| 84858 | ZNF503 | P84T-E | Human | Esophagus | ESCC | 1.54e-04 | 3.76e-01 | 0.0933 |
| 84858 | ZNF503 | P91T-E | Human | Esophagus | ESCC | 9.77e-03 | 7.38e-01 | 0.1828 |
| 84858 | ZNF503 | P107T-E | Human | Esophagus | ESCC | 4.11e-10 | 4.64e-01 | 0.171 |
| 84858 | ZNF503 | P126T-E | Human | Esophagus | ESCC | 1.20e-02 | 5.44e-02 | 0.1125 |
| 84858 | ZNF503 | P127T-E | Human | Esophagus | ESCC | 1.26e-11 | -1.18e-01 | 0.0826 |
| 84858 | ZNF503 | P130T-E | Human | Esophagus | ESCC | 1.67e-19 | 4.98e-01 | 0.1676 |
| 84858 | ZNF503 | HCC1_Meng | Human | Liver | HCC | 1.01e-03 | -6.47e-02 | 0.0246 |
| 84858 | ZNF503 | HCC2_Meng | Human | Liver | HCC | 1.33e-02 | 1.60e-02 | 0.0107 |
| 84858 | ZNF503 | cirrhotic2 | Human | Liver | Cirrhotic | 5.20e-06 | 1.07e-01 | 0.0201 |
| 84858 | ZNF503 | HCC1 | Human | Liver | HCC | 1.26e-13 | 4.44e+00 | 0.5336 |
| 84858 | ZNF503 | S014 | Human | Liver | HCC | 1.03e-52 | 3.22e+00 | 0.2254 |
| 84858 | ZNF503 | S015 | Human | Liver | HCC | 1.36e-39 | 2.71e+00 | 0.2375 |
| Page: 1 2 3 4 5 6 |
| Tissue | Expression Dynamics | Abbreviation |
| Breast | 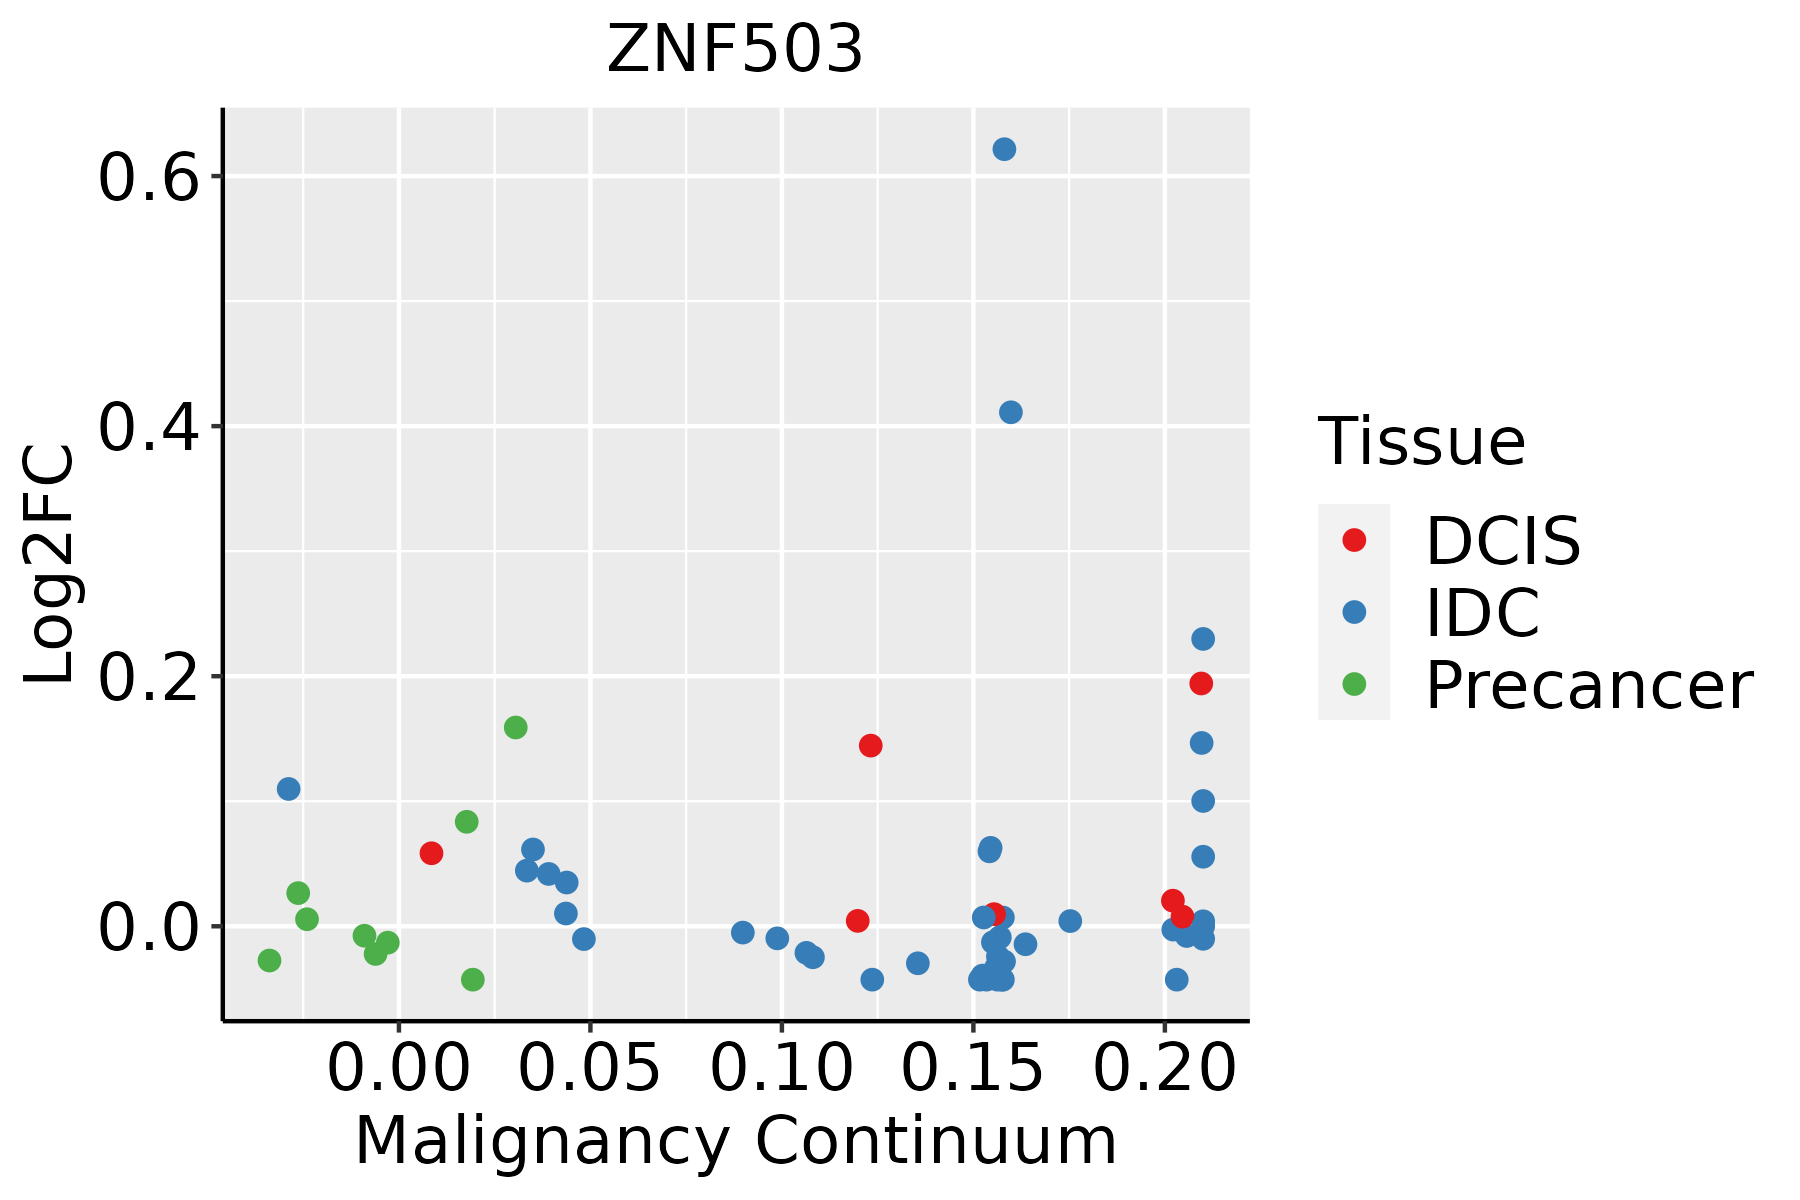 | IDC: Invasive ductal carcinoma |
| DCIS: Ductal carcinoma in situ | ||
| Precancer(BRCA1-mut): Precancerous lesion from BRCA1 mutation carriers | ||
| Colorectum (GSE201348) |  | FAP: Familial adenomatous polyposis |
| CRC: Colorectal cancer | ||
| Colorectum (HTA11) |  | AD: Adenomas |
| SER: Sessile serrated lesions | ||
| MSI-H: Microsatellite-high colorectal cancer | ||
| MSS: Microsatellite stable colorectal cancer | ||
| Endometrium | 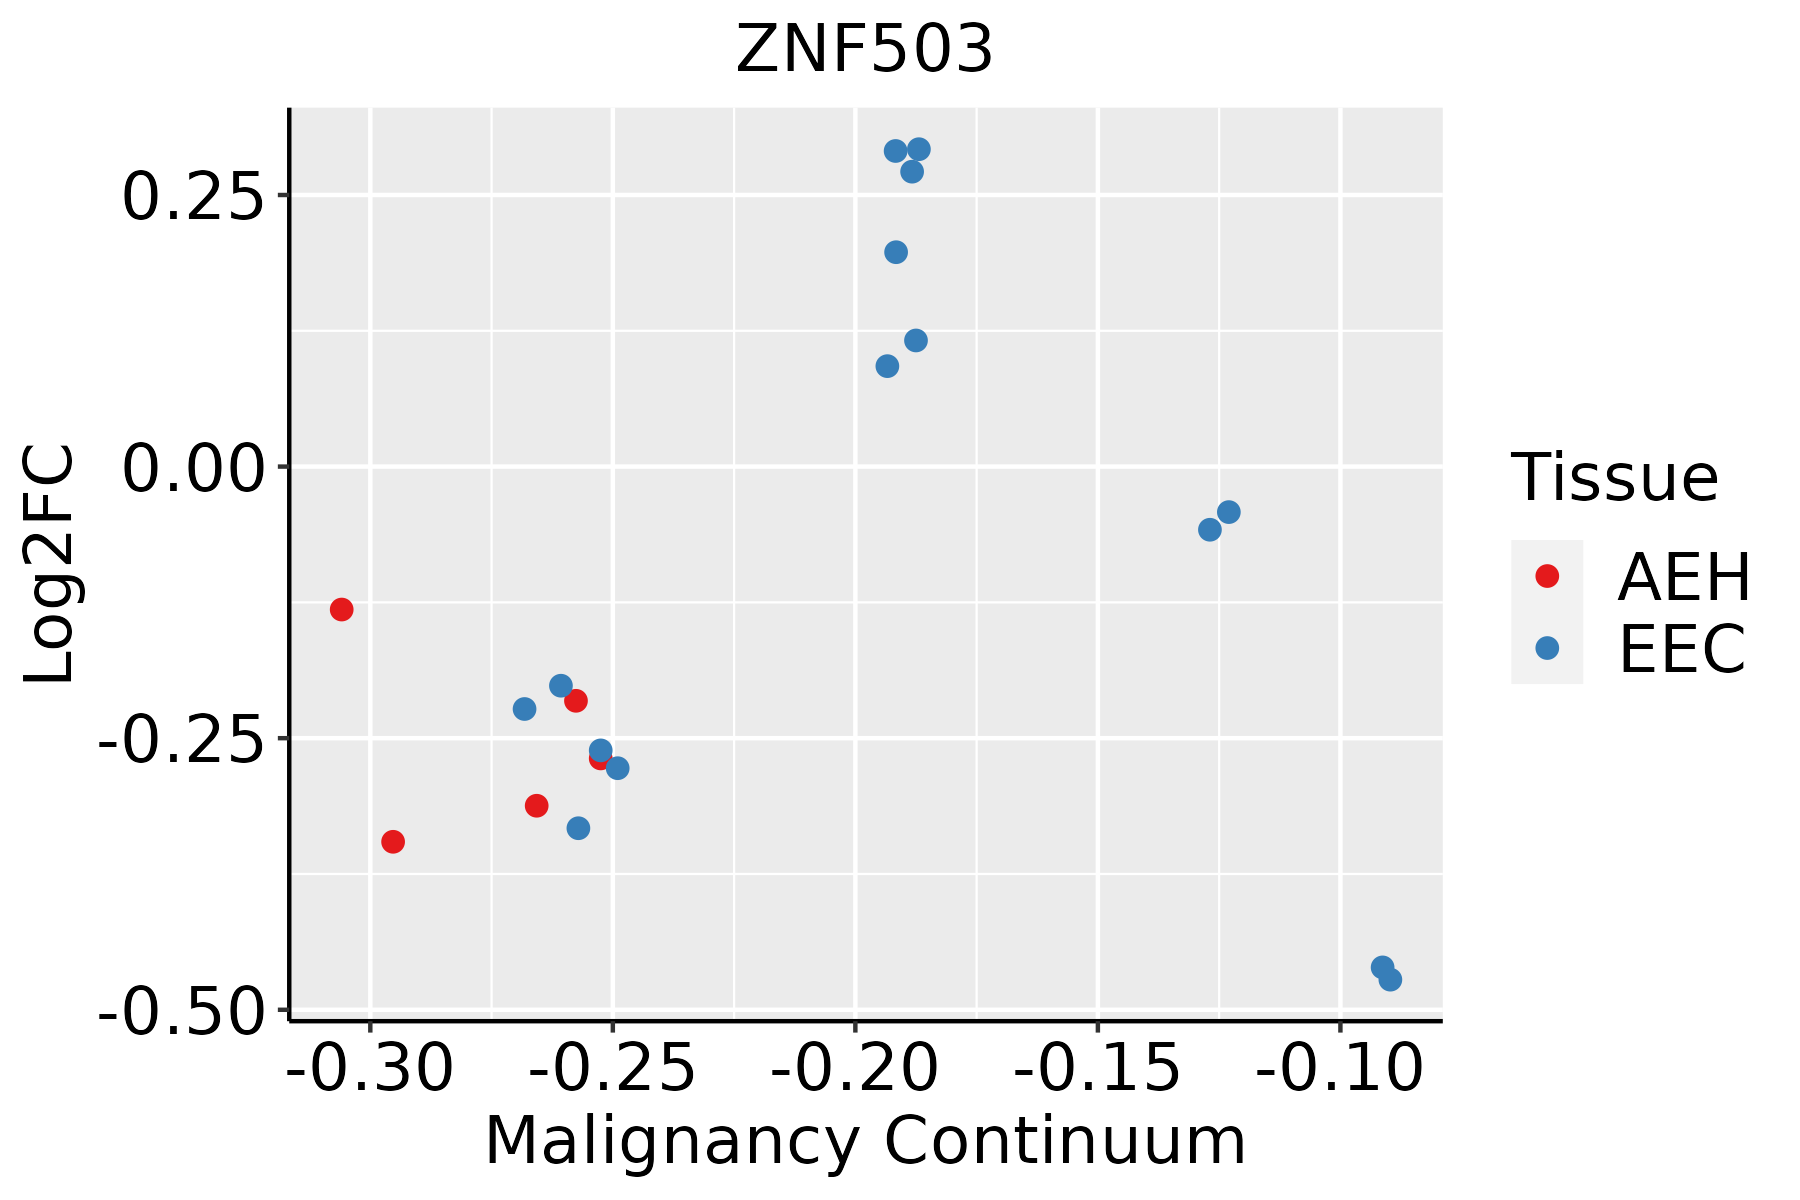 | AEH: Atypical endometrial hyperplasia |
| EEC: Endometrioid Cancer | ||
| Esophagus | 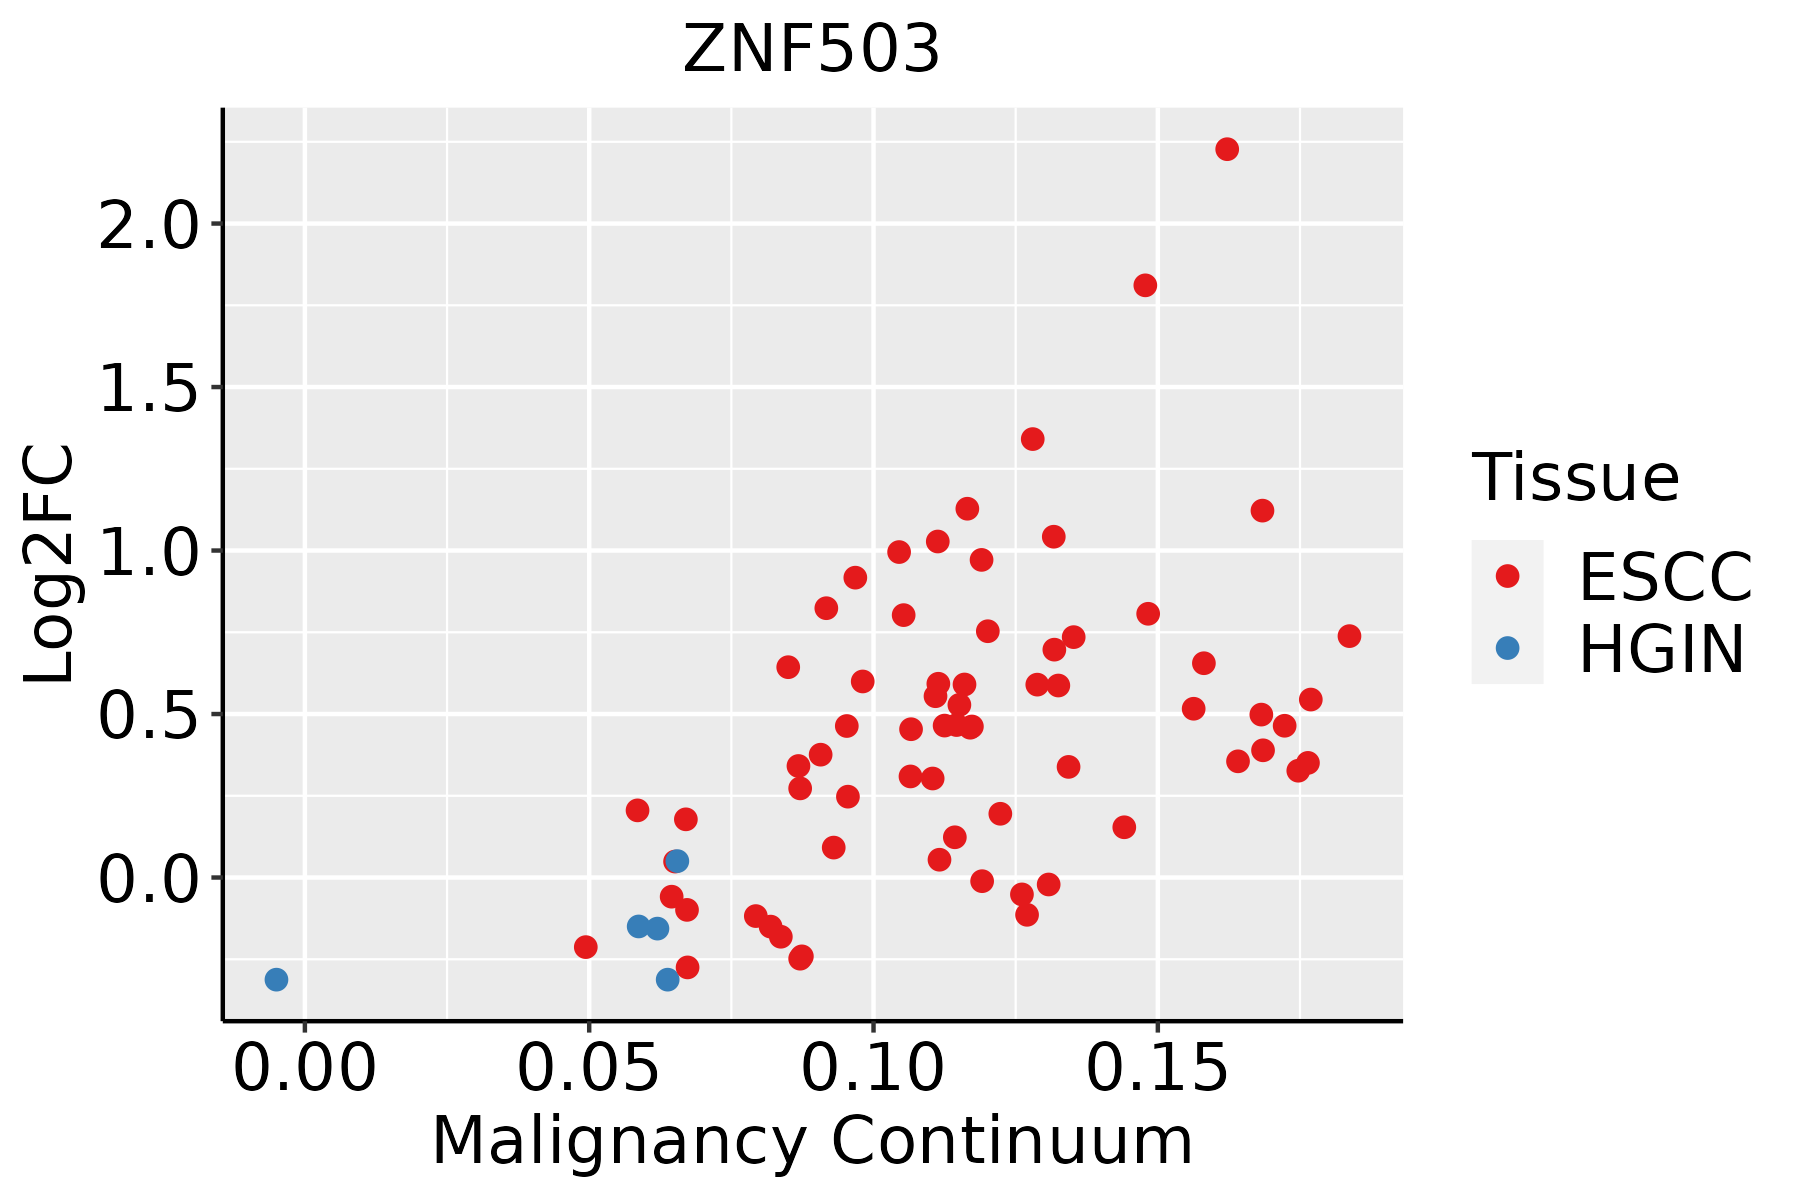 | ESCC: Esophageal squamous cell carcinoma |
| HGIN: High-grade intraepithelial neoplasias | ||
| LGIN: Low-grade intraepithelial neoplasias | ||
| Liver | 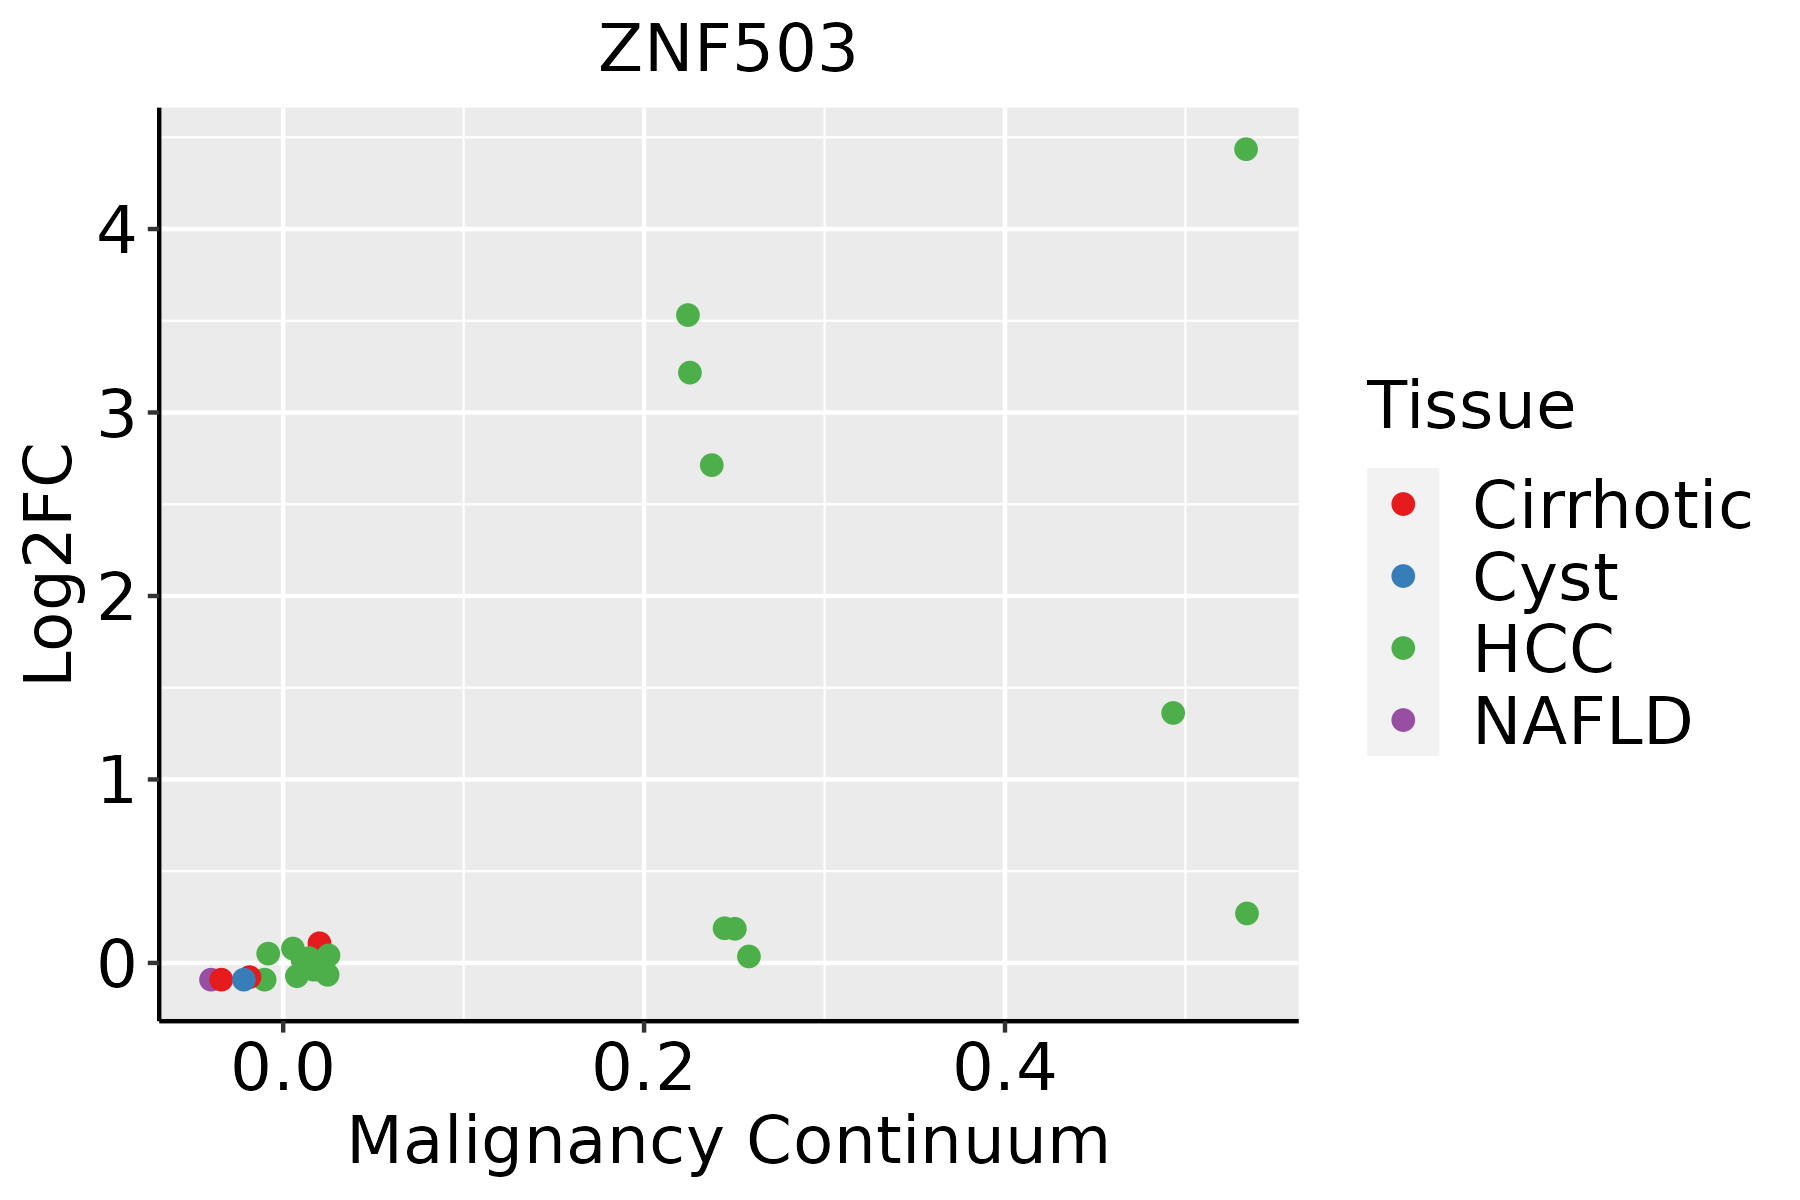 | HCC: Hepatocellular carcinoma |
| NAFLD: Non-alcoholic fatty liver disease | ||
| Oral Cavity | 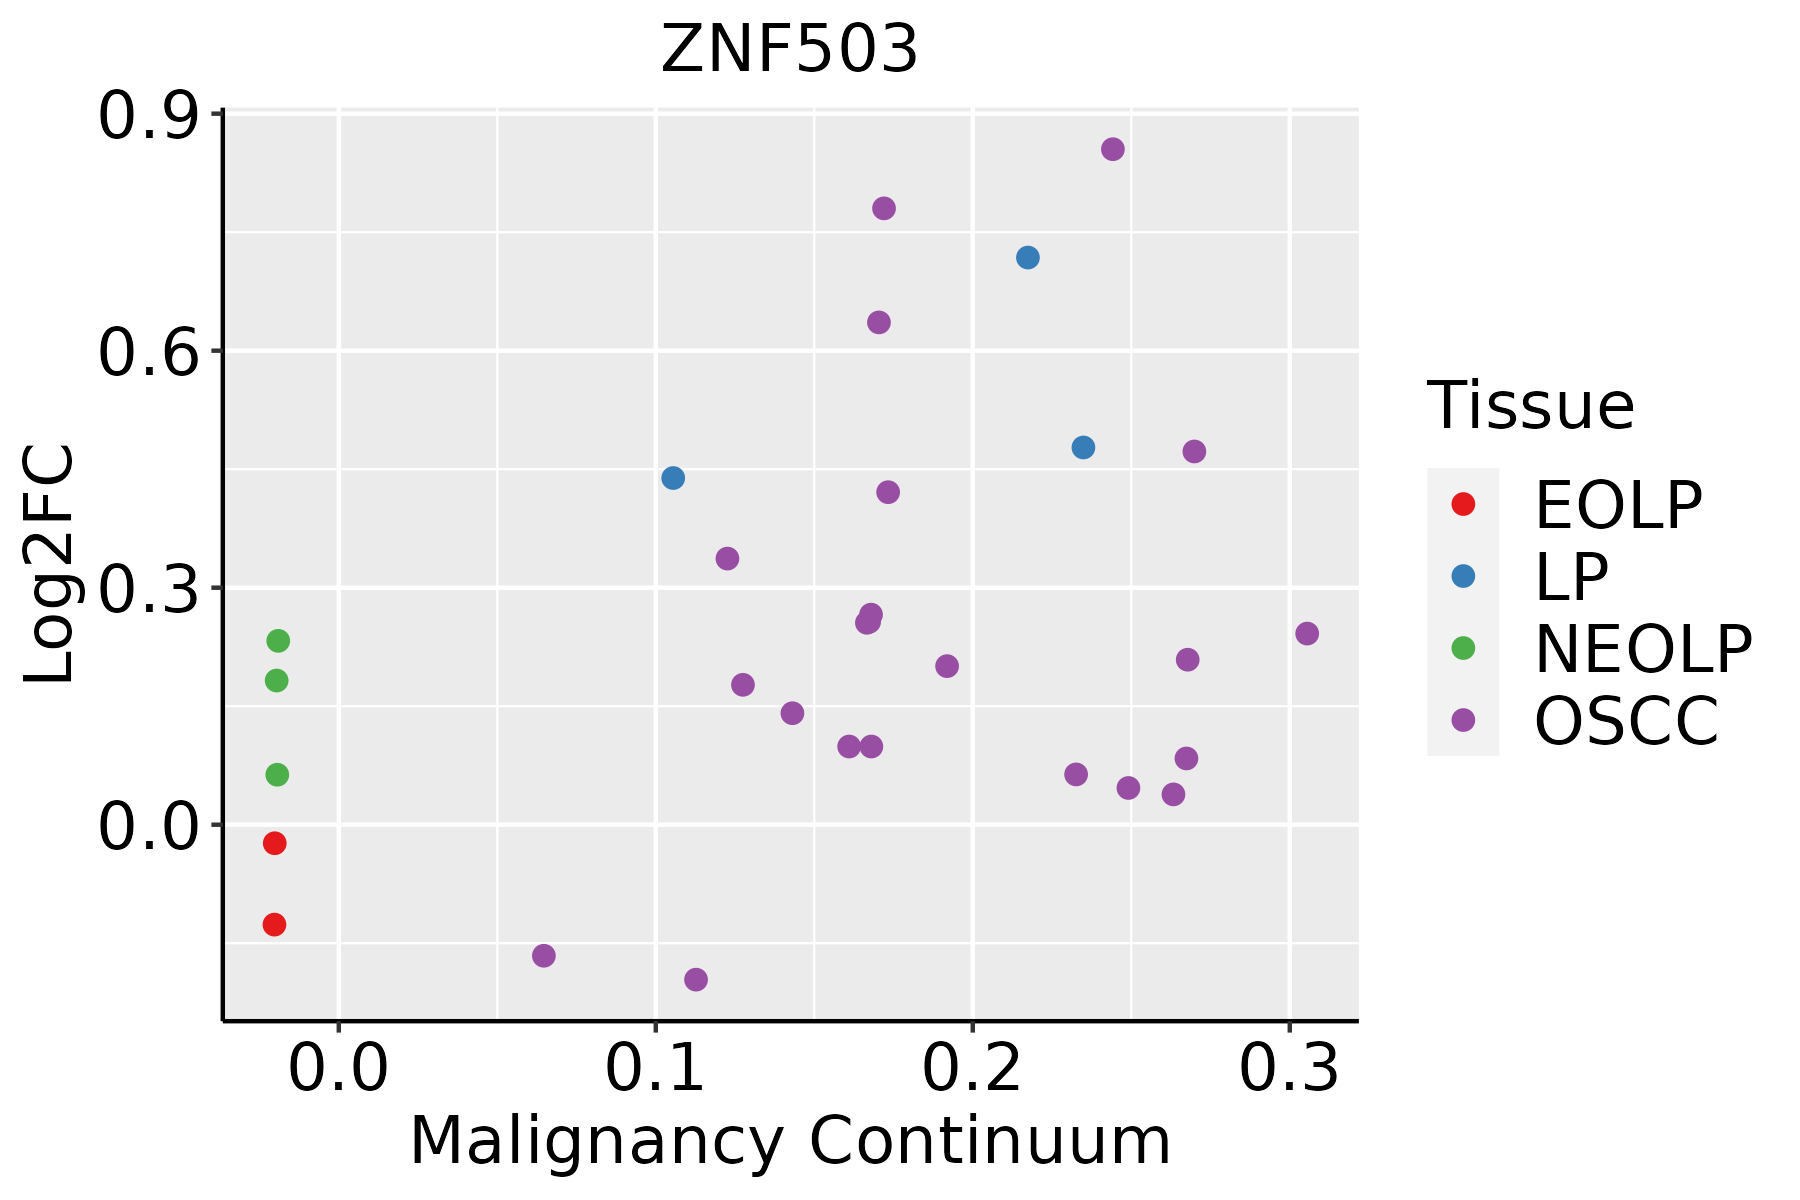 | EOLP: Erosive Oral lichen planus |
| LP: leukoplakia | ||
| NEOLP: Non-erosive oral lichen planus | ||
| OSCC: Oral squamous cell carcinoma | ||
| Skin | 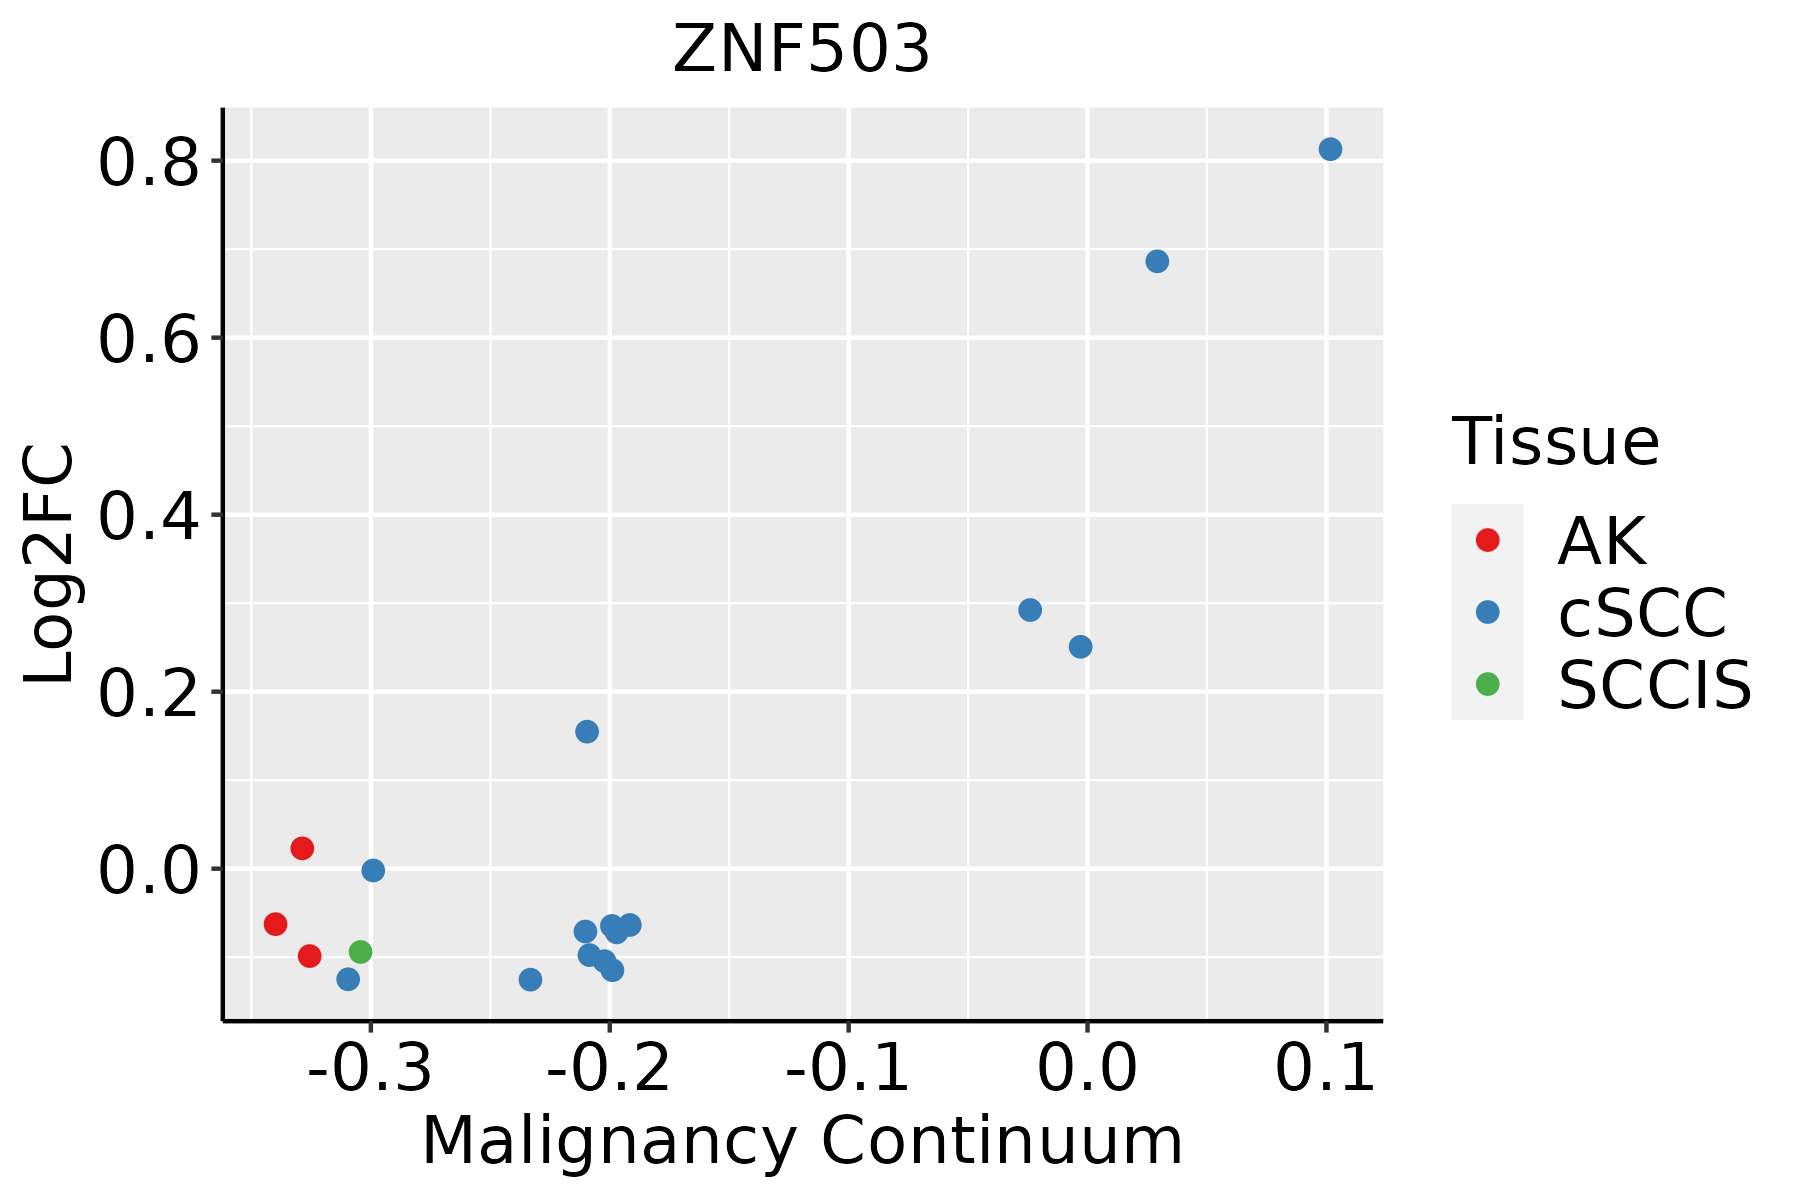 | AK: Actinic keratosis |
| cSCC: Cutaneous squamous cell carcinoma | ||
| SCCIS:squamous cell carcinoma in situ |
| ∗log2FC in expression of this searched gene in stem-like cells from each diseased tissue sample relative to stem-like cells in normal samples in each tissue plotted against the malignancy continuum. Samples are colored based on if they are from different disease stage. |
Top |
Malignant transformation related pathway analysis |
| Find out the enriched GO biological processes and KEGG pathways involved in transition from healthy to precancer to cancer |
| Tissue | Disease Stage | Enriched GO biological Processes |
| Colorectum | AD |  |
| Colorectum | SER |  |
| Colorectum | MSS |  |
| Colorectum | MSI-H |  |
| Colorectum | FAP |  |
| ∗Top 15 enriched GO BP terms are showed in the bar plot of each disease state in each tissue. Each row represents a significant GO biological process which is colored according to the -log10(p.adjust). |
| Page: 1 2 3 4 5 6 7 8 9 |
| GO ID | Tissue | Disease Stage | Description | Gene Ratio | Bg Ratio | pvalue | p.adjust | Count |
| GO:00613511 | Endometrium | EEC | neural precursor cell proliferation | 29/2168 | 145/18723 | 2.24e-03 | 1.67e-02 | 29 |
| Page: 1 |
| Pathway ID | Tissue | Disease Stage | Description | Gene Ratio | Bg Ratio | pvalue | p.adjust | qvalue | Count |
| Page: 1 |
Top |
Cell-cell communication analysis |
| Identification of potential cell-cell interactions between two cell types and their ligand-receptor pairs for different disease states |
| Ligand | Receptor | LRpair | Pathway | Tissue | Disease Stage |
| Page: 1 |
Top |
Single-cell gene regulatory network inference analysis |
| Find out the significant the regulons (TFs) and the target genes of each regulon across cell types for different disease states |
| TF | Cell Type | Tissue | Disease Stage | Target Gene | RSS | Regulon Activity |
| ZNF503 | MES | Cervix | HSIL_HPV | EFNA4,CDC42EP2,ELF3, etc. | 4.57e-01 |  |
| ZNF503 | ECM | Oral cavity | ADJ | SOD3,SSPN,IGFBP5, etc. | 7.21e-01 |  |
| ∗The dot plots of a searched regulon are shown for all cell subpopulations in each disease state of each tissue based on the regulon specific score inferred using pySCENIC and by calculating the average expression. |
| Page: 1 |
Top |
Somatic mutation of malignant transformation related genes |
| Annotation of somatic variants for genes involved in malignant transformation |
| Hugo Symbol | Variant Class | Variant Classification | dbSNP RS | HGVSc | HGVSp | HGVSp Short | SWISSPROT | BIOTYPE | SIFT | PolyPhen | Tumor Sample Barcode | Tissue | Histology | Sex | Age | Stage | Therapy Types | Drugs | Outcome |
| ZNF503 | SNV | Missense_Mutation | c.436N>A | p.Gly146Ser | p.G146S | Q96F45 | protein_coding | tolerated(1) | benign(0.003) | TCGA-A2-A0YD-01 | Breast | breast invasive carcinoma | Female | <65 | I/II | Chemotherapy | cytoxan | SD | |
| ZNF503 | SNV | Missense_Mutation | novel | c.1292N>C | p.Tyr431Ser | p.Y431S | Q96F45 | protein_coding | deleterious(0) | probably_damaging(0.915) | TCGA-DS-A1OB-01 | Cervix | cervical & endocervical cancer | Female | <65 | I/II | Chemotherapy | carboplatin | PD |
| ZNF503 | insertion | Frame_Shift_Ins | novel | c.1293_1294insGCAAG | p.Cys432AlafsTer33 | p.C432Afs*33 | Q96F45 | protein_coding | TCGA-DS-A1OB-01 | Cervix | cervical & endocervical cancer | Female | <65 | I/II | Chemotherapy | carboplatin | PD | ||
| ZNF503 | deletion | Frame_Shift_Del | c.1498delN | p.Leu500SerfsTer37 | p.L500Sfs*37 | Q96F45 | protein_coding | TCGA-AD-6889-01 | Colorectum | colon adenocarcinoma | Male | >=65 | I/II | Chemotherapy | xeloda | PD | |||
| ZNF503 | SNV | Missense_Mutation | novel | c.103N>A | p.Ala35Thr | p.A35T | Q96F45 | protein_coding | tolerated_low_confidence(0.41) | benign(0.068) | TCGA-A5-A1OF-01 | Endometrium | uterine corpus endometrioid carcinoma | Female | <65 | I/II | Unknown | Unknown | SD |
| ZNF503 | deletion | Frame_Shift_Del | novel | c.1228_1241delNNNNNNNNNNNNNN | p.Ser410ArgfsTer25 | p.S410Rfs*25 | Q96F45 | protein_coding | TCGA-DD-AACY-01 | Liver | liver hepatocellular carcinoma | Male | <65 | I/II | Unknown | Unknown | PD | ||
| ZNF503 | SNV | Missense_Mutation | c.313N>A | p.Glu105Lys | p.E105K | Q96F45 | protein_coding | deleterious(0.02) | benign(0.287) | TCGA-64-1677-01 | Lung | lung adenocarcinoma | Female | >=65 | III/IV | Chemotherapy | gemcitabine | PD | |
| ZNF503 | SNV | Missense_Mutation | c.832G>T | p.Gly278Trp | p.G278W | Q96F45 | protein_coding | deleterious(0) | possibly_damaging(0.815) | TCGA-91-6830-01 | Lung | lung adenocarcinoma | Female | >=65 | I/II | Unknown | Unknown | PD | |
| ZNF503 | SNV | Missense_Mutation | novel | c.935N>T | p.Gly312Val | p.G312V | Q96F45 | protein_coding | tolerated(0.05) | benign(0.42) | TCGA-33-4566-01 | Lung | lung squamous cell carcinoma | Male | <65 | I/II | Unknown | Unknown | SD |
| ZNF503 | SNV | Missense_Mutation | novel | c.815C>T | p.Ala272Val | p.A272V | Q96F45 | protein_coding | tolerated(0.27) | benign(0.003) | TCGA-90-A4ED-01 | Lung | lung squamous cell carcinoma | Male | >=65 | I/II | Unknown | Unknown | SD |
| Page: 1 2 |
Top |
Related drugs of malignant transformation related genes |
| Identification of chemicals and drugs interact with genes involved in malignant transfromation |
| (DGIdb 4.0) |
| Entrez ID | Symbol | Category | Interaction Types | Drug Claim Name | Drug Name | PMIDs |
| Page: 1 |

Copyright 2023-Present -The University of Texas Health Science Center at Houston |