
|
|||||
|
 | |
| |
| |
| |
| |
| |
|
Gene: WBSCR22 |
Gene summary for WBSCR22 |
| Gene information | Species | Human | Gene symbol | WBSCR22 | Gene ID | 114049 |
| Gene name | BUD23 rRNA methyltransferase and ribosome maturation factor | |
| Gene Alias | HASJ4442 | |
| Cytomap | 7q11.23 | |
| Gene Type | protein-coding | GO ID | GO:0000154 | UniProtAcc | O43709 |
Top |
Malignant transformation analysis |
| Identification of the aberrant gene expression in precancerous and cancerous lesions by comparing the gene expression of stem-like cells in diseased tissues with normal stem cells |
| Entrez ID | Symbol | Replicates | Species | Organ | Tissue | Adj P-value | Log2FC | Malignancy |
| 114049 | WBSCR22 | C30 | Human | Oral cavity | OSCC | 6.16e-41 | 1.91e+00 | 0.3055 |
| 114049 | WBSCR22 | C38 | Human | Oral cavity | OSCC | 2.84e-18 | 1.83e+00 | 0.172 |
| 114049 | WBSCR22 | C43 | Human | Oral cavity | OSCC | 1.58e-63 | 1.11e+00 | 0.1704 |
| 114049 | WBSCR22 | C46 | Human | Oral cavity | OSCC | 1.28e-55 | 1.22e+00 | 0.1673 |
| 114049 | WBSCR22 | C51 | Human | Oral cavity | OSCC | 4.37e-27 | 1.57e+00 | 0.2674 |
| 114049 | WBSCR22 | C57 | Human | Oral cavity | OSCC | 3.99e-25 | 9.05e-01 | 0.1679 |
| 114049 | WBSCR22 | C06 | Human | Oral cavity | OSCC | 3.07e-11 | 1.44e+00 | 0.2699 |
| 114049 | WBSCR22 | C07 | Human | Oral cavity | OSCC | 5.72e-09 | 1.55e+00 | 0.2491 |
| 114049 | WBSCR22 | C08 | Human | Oral cavity | OSCC | 1.33e-95 | 1.78e+00 | 0.1919 |
| 114049 | WBSCR22 | C09 | Human | Oral cavity | OSCC | 1.39e-18 | 6.63e-01 | 0.1431 |
| 114049 | WBSCR22 | LN22 | Human | Oral cavity | OSCC | 2.85e-14 | 1.52e+00 | 0.1733 |
| 114049 | WBSCR22 | LN38 | Human | Oral cavity | OSCC | 8.64e-06 | 1.22e+00 | 0.168 |
| 114049 | WBSCR22 | LN46 | Human | Oral cavity | OSCC | 1.99e-33 | 1.22e+00 | 0.1666 |
| 114049 | WBSCR22 | LP15 | Human | Oral cavity | LP | 4.26e-14 | 1.77e+00 | 0.2174 |
| 114049 | WBSCR22 | LP17 | Human | Oral cavity | LP | 2.44e-09 | 1.29e+00 | 0.2349 |
| 114049 | WBSCR22 | SYSMH1 | Human | Oral cavity | OSCC | 1.21e-20 | 4.33e-01 | 0.1127 |
| 114049 | WBSCR22 | SYSMH2 | Human | Oral cavity | OSCC | 6.58e-30 | 7.95e-01 | 0.2326 |
| 114049 | WBSCR22 | SYSMH3 | Human | Oral cavity | OSCC | 2.01e-32 | 7.48e-01 | 0.2442 |
| 114049 | WBSCR22 | SYSMH4 | Human | Oral cavity | OSCC | 1.14e-09 | 2.53e-01 | 0.1226 |
| 114049 | WBSCR22 | SYSMH5 | Human | Oral cavity | OSCC | 3.30e-05 | 2.01e-01 | 0.0647 |
| Page: 1 2 3 4 5 6 7 |
| Tissue | Expression Dynamics | Abbreviation |
| Colorectum (GSE201348) |  | FAP: Familial adenomatous polyposis |
| CRC: Colorectal cancer | ||
| Colorectum (HTA11) |  | AD: Adenomas |
| SER: Sessile serrated lesions | ||
| MSI-H: Microsatellite-high colorectal cancer | ||
| MSS: Microsatellite stable colorectal cancer | ||
| Esophagus |  | ESCC: Esophageal squamous cell carcinoma |
| HGIN: High-grade intraepithelial neoplasias | ||
| LGIN: Low-grade intraepithelial neoplasias | ||
| Liver | 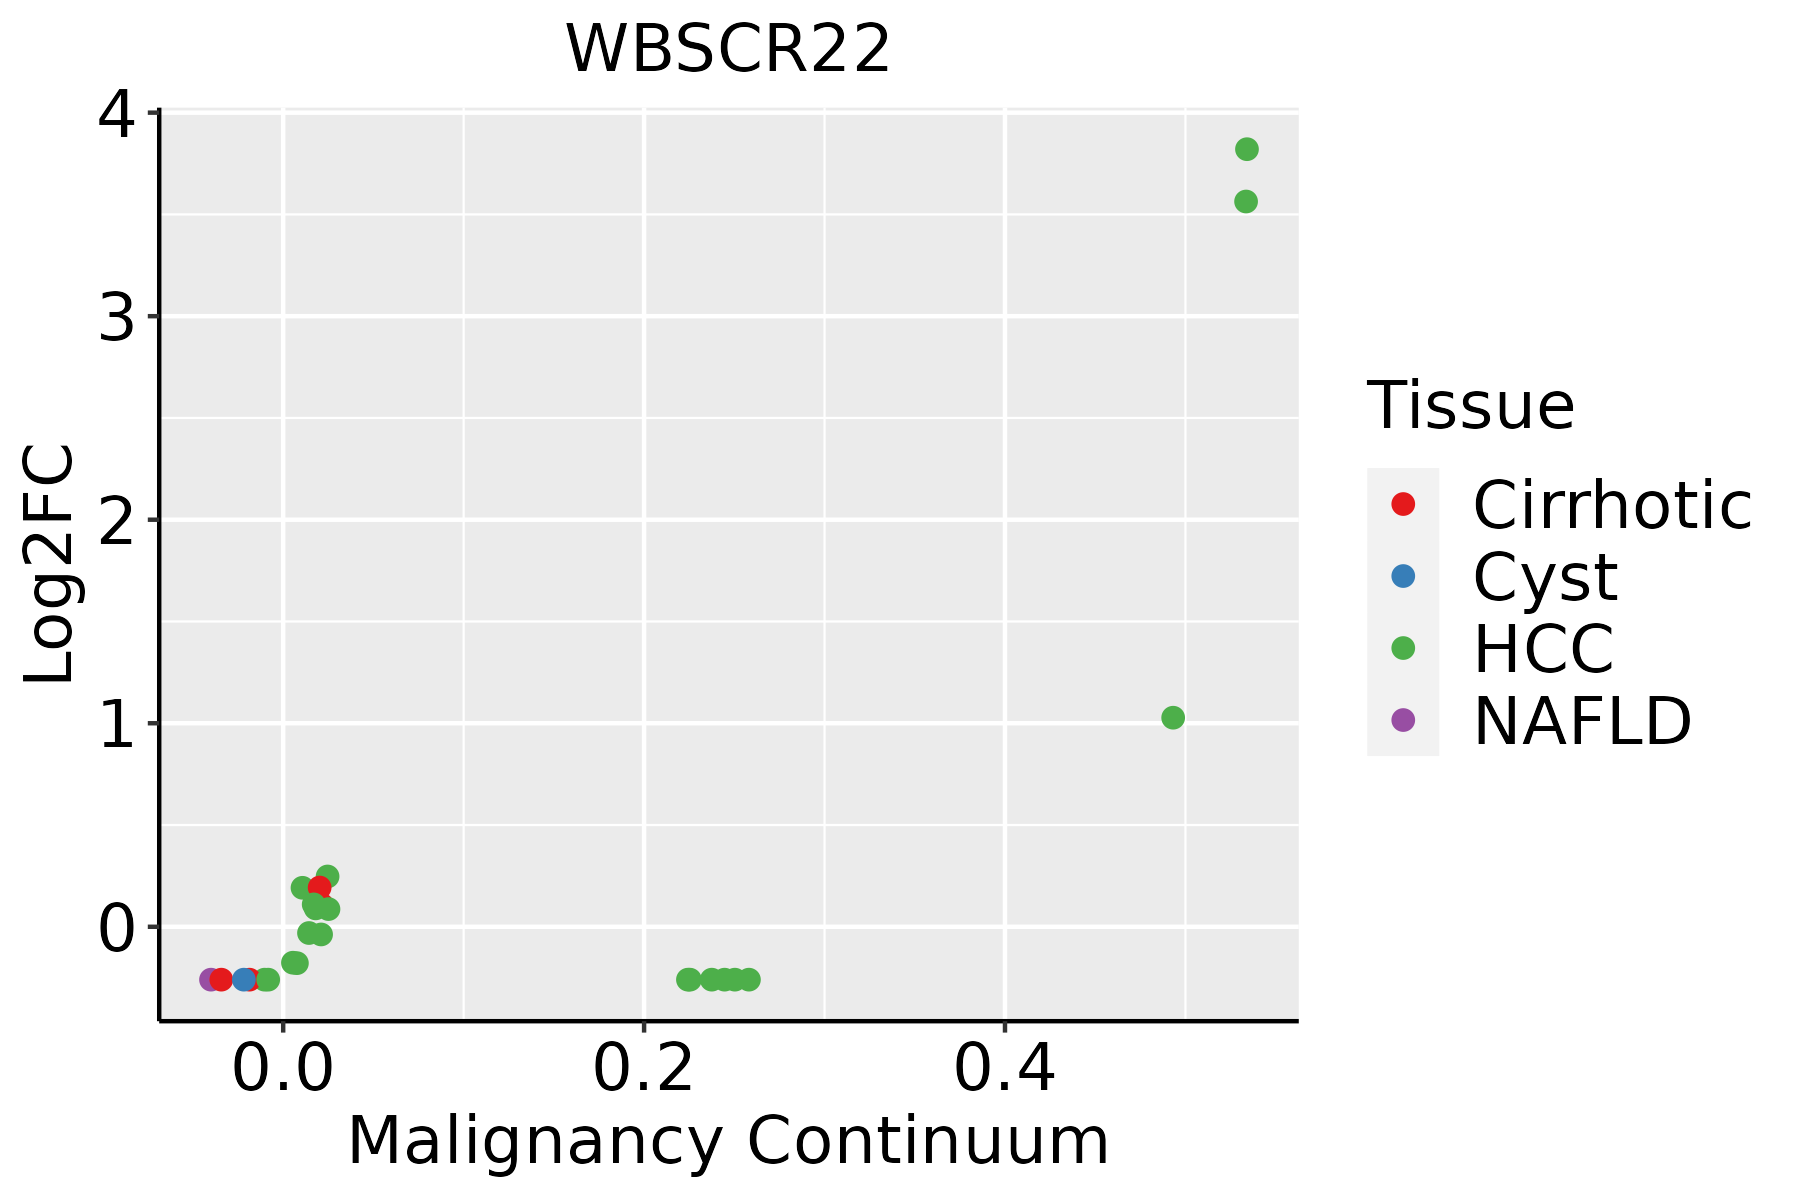 | HCC: Hepatocellular carcinoma |
| NAFLD: Non-alcoholic fatty liver disease | ||
| Oral Cavity |  | EOLP: Erosive Oral lichen planus |
| LP: leukoplakia | ||
| NEOLP: Non-erosive oral lichen planus | ||
| OSCC: Oral squamous cell carcinoma | ||
| Prostate | 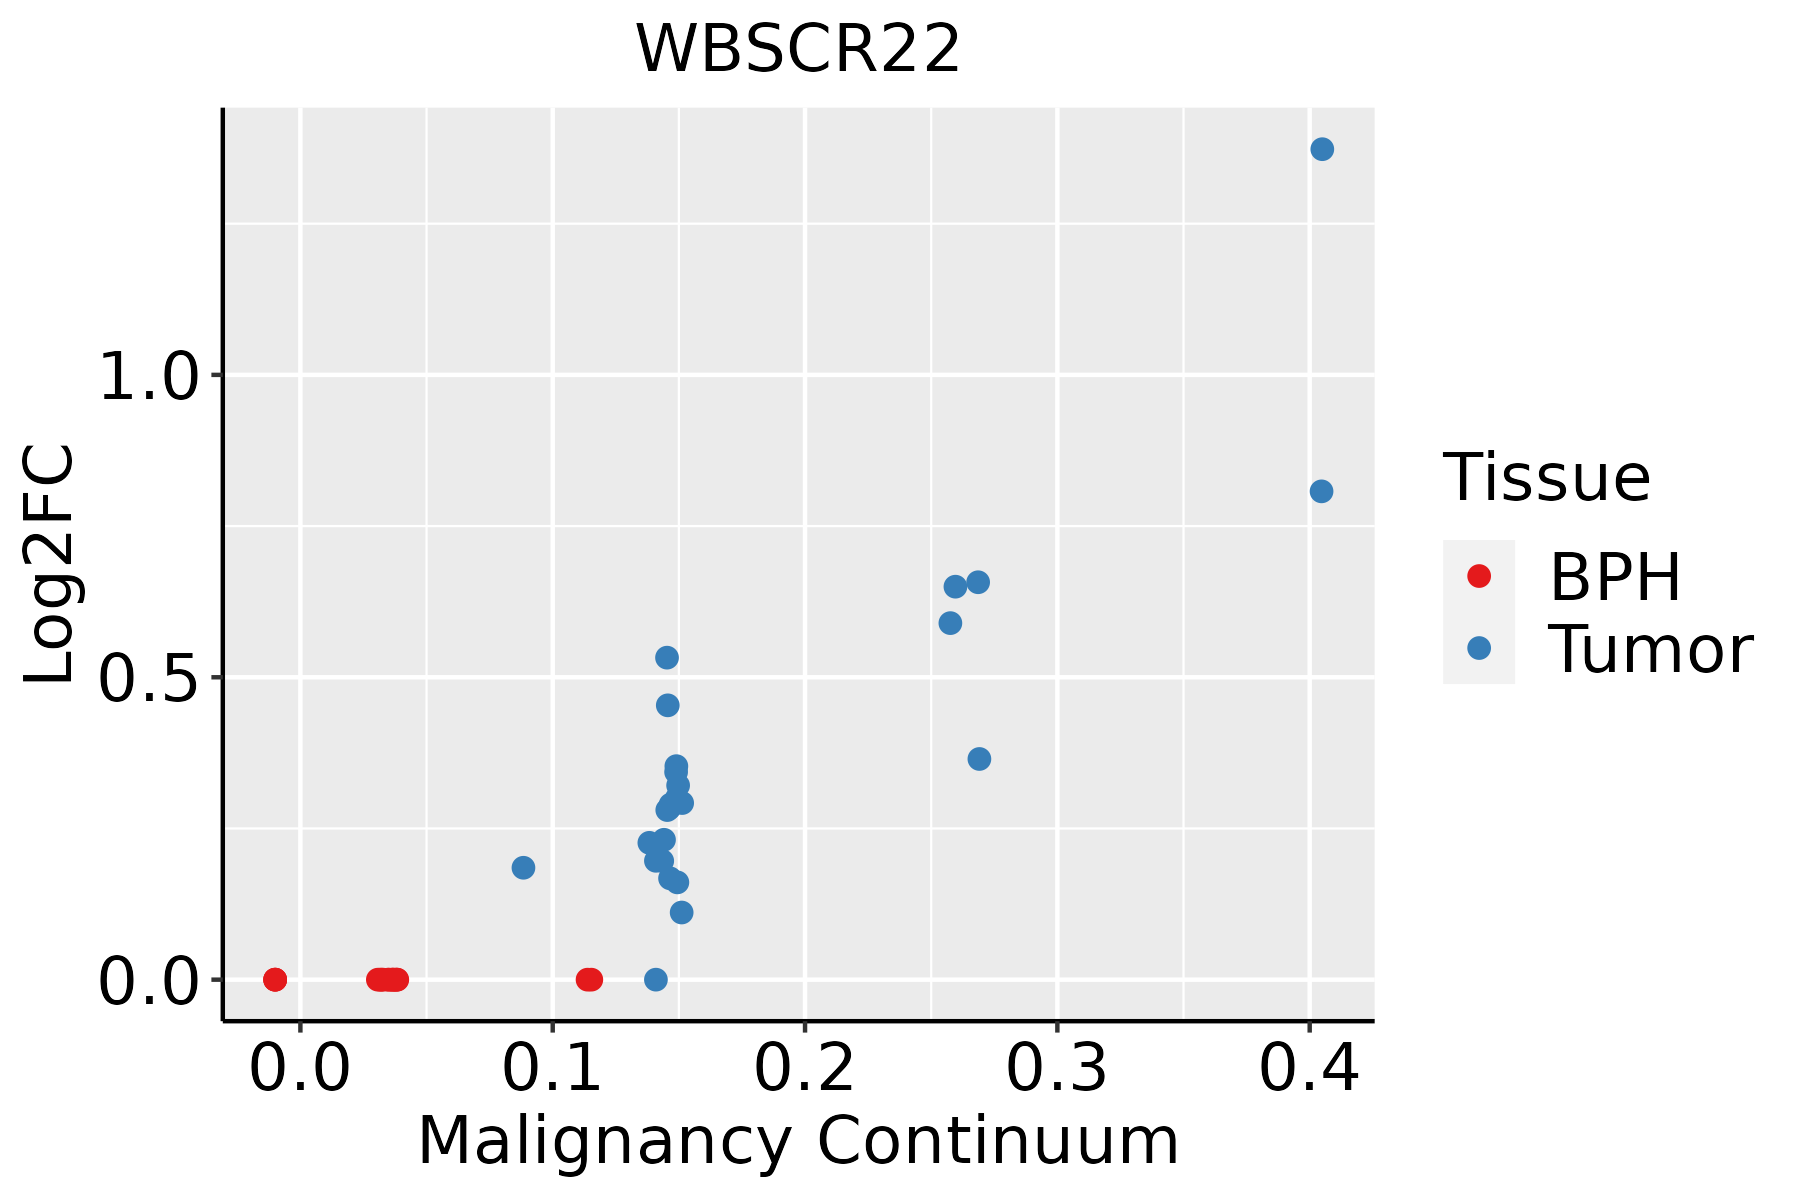 | BPH: Benign Prostatic Hyperplasia |
| Skin | 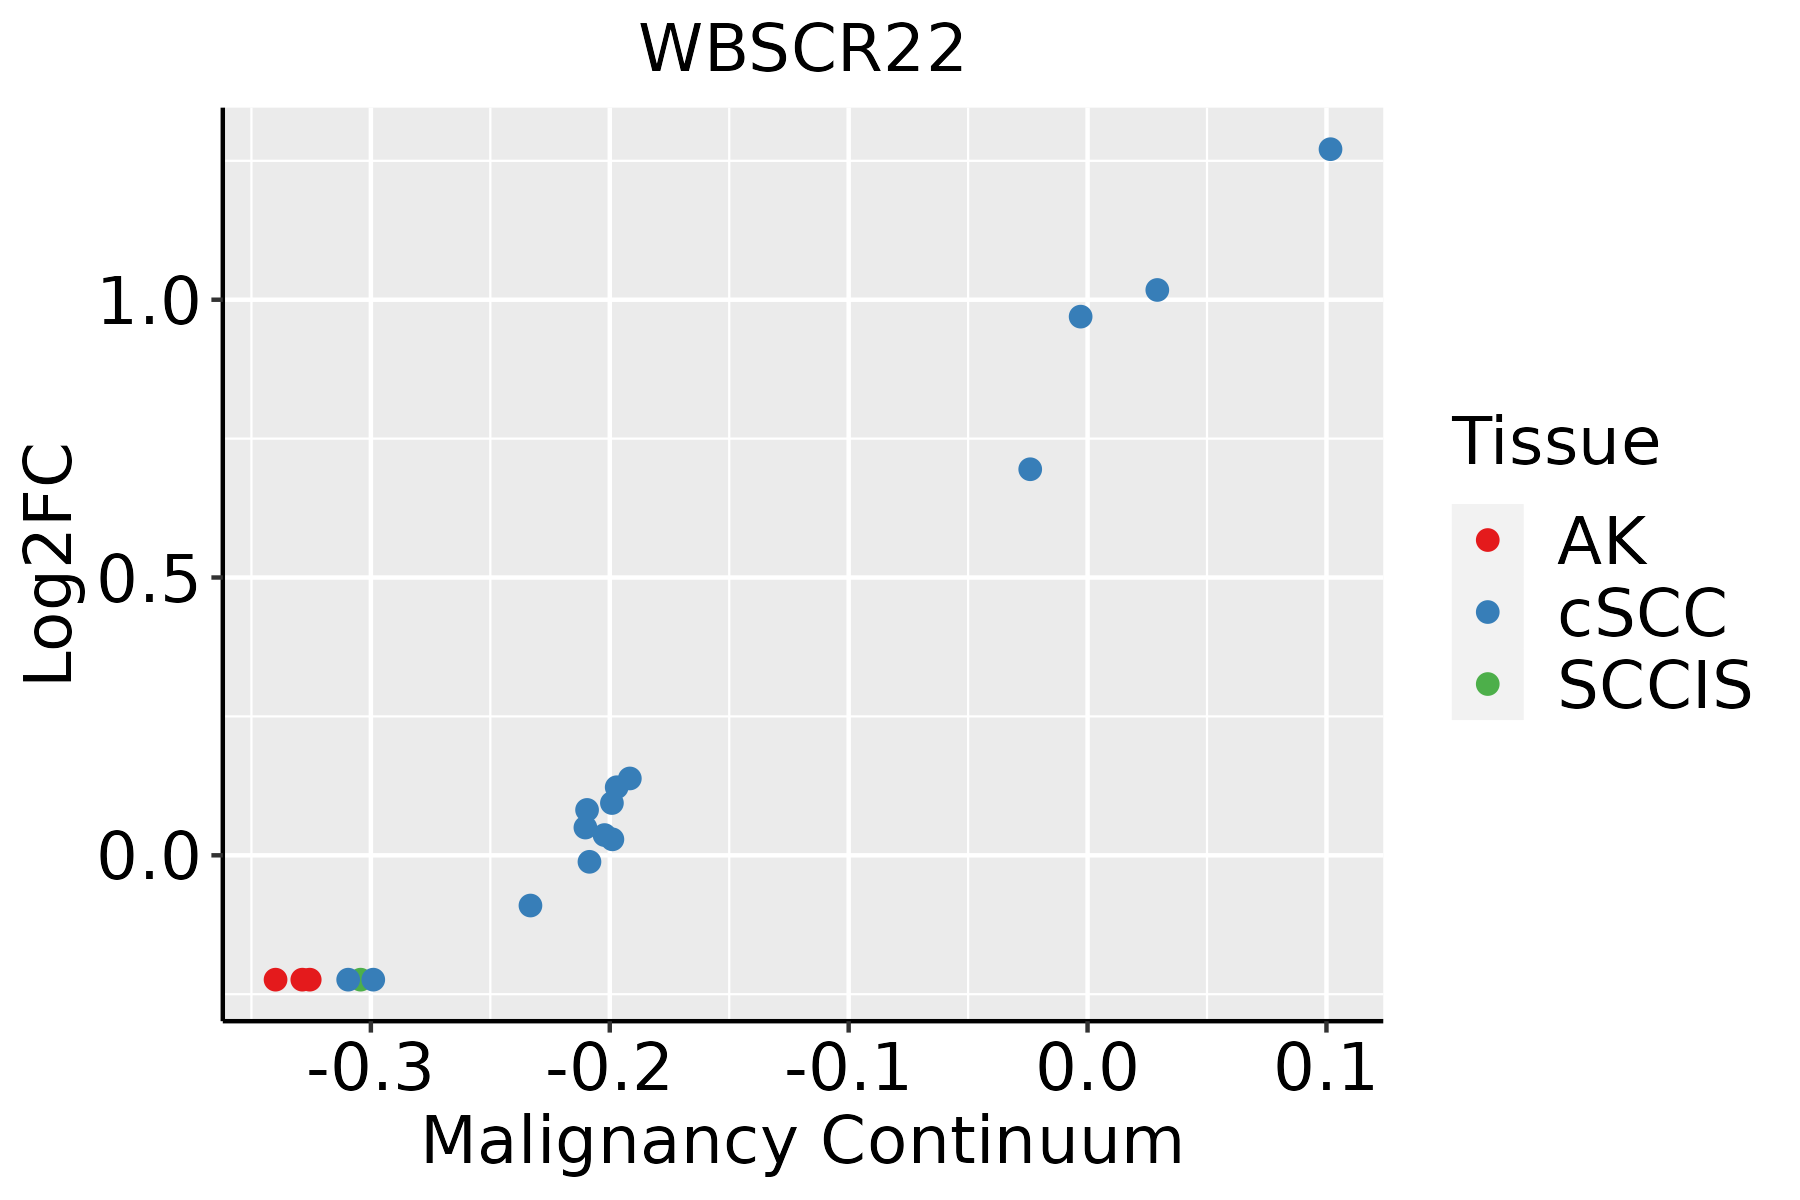 | AK: Actinic keratosis |
| cSCC: Cutaneous squamous cell carcinoma | ||
| SCCIS:squamous cell carcinoma in situ |
| ∗log2FC in expression of this searched gene in stem-like cells from each diseased tissue sample relative to stem-like cells in normal samples in each tissue plotted against the malignancy continuum. Samples are colored based on if they are from different disease stage. |
Top |
Malignant transformation related pathway analysis |
| Find out the enriched GO biological processes and KEGG pathways involved in transition from healthy to precancer to cancer |
| Tissue | Disease Stage | Enriched GO biological Processes |
| Colorectum | AD |  |
| Colorectum | SER |  |
| Colorectum | MSS |  |
| Colorectum | MSI-H |  |
| Colorectum | FAP |  |
| ∗Top 15 enriched GO BP terms are showed in the bar plot of each disease state in each tissue. Each row represents a significant GO biological process which is colored according to the -log10(p.adjust). |
| Page: 1 2 3 4 5 6 7 8 9 |
| GO ID | Tissue | Disease Stage | Description | Gene Ratio | Bg Ratio | pvalue | p.adjust | Count |
| Page: 1 |
| Pathway ID | Tissue | Disease Stage | Description | Gene Ratio | Bg Ratio | pvalue | p.adjust | qvalue | Count |
| Page: 1 |
Top |
Cell-cell communication analysis |
| Identification of potential cell-cell interactions between two cell types and their ligand-receptor pairs for different disease states |
| Ligand | Receptor | LRpair | Pathway | Tissue | Disease Stage |
| Page: 1 |
Top |
Single-cell gene regulatory network inference analysis |
| Find out the significant the regulons (TFs) and the target genes of each regulon across cell types for different disease states |
| TF | Cell Type | Tissue | Disease Stage | Target Gene | RSS | Regulon Activity |
| ∗The dot plots of a searched regulon are shown for all cell subpopulations in each disease state of each tissue based on the regulon specific score inferred using pySCENIC and by calculating the average expression. |
| Page: 1 |
Top |
Somatic mutation of malignant transformation related genes |
| Annotation of somatic variants for genes involved in malignant transformation |
| Hugo Symbol | Variant Class | Variant Classification | dbSNP RS | HGVSc | HGVSp | HGVSp Short | SWISSPROT | BIOTYPE | SIFT | PolyPhen | Tumor Sample Barcode | Tissue | Histology | Sex | Age | Stage | Therapy Types | Drugs | Outcome |
| WBSCR22 | SNV | Missense_Mutation | c.349N>A | p.Asp117Asn | p.D117N | O43709 | protein_coding | deleterious(0) | probably_damaging(0.999) | TCGA-A8-A0A7-01 | Breast | breast invasive carcinoma | Female | <65 | I/II | Unknown | Unknown | SD | |
| WBSCR22 | SNV | Missense_Mutation | c.261N>C | p.Met87Ile | p.M87I | O43709 | protein_coding | deleterious(0) | possibly_damaging(0.861) | TCGA-AC-A23H-01 | Breast | breast invasive carcinoma | Female | >=65 | I/II | Unknown | Unknown | PD | |
| WBSCR22 | SNV | Missense_Mutation | novel | c.271N>T | p.Ala91Ser | p.A91S | O43709 | protein_coding | deleterious(0.01) | probably_damaging(0.999) | TCGA-B6-A0RS-01 | Breast | breast invasive carcinoma | Female | <65 | I/II | Unknown | Unknown | PD |
| WBSCR22 | SNV | Missense_Mutation | novel | c.265G>A | p.Asp89Asn | p.D89N | O43709 | protein_coding | tolerated(0.42) | benign(0.163) | TCGA-BH-A0HF-01 | Breast | breast invasive carcinoma | Female | >=65 | I/II | Hormone Therapy | arimidex | SD |
| WBSCR22 | SNV | Missense_Mutation | c.626C>T | p.Ser209Leu | p.S209L | O43709 | protein_coding | tolerated(0.07) | benign(0.16) | TCGA-BH-A0HL-01 | Breast | breast invasive carcinoma | Female | <65 | I/II | Chemotherapy | cyclophosphamide | SD | |
| WBSCR22 | insertion | Nonsense_Mutation | novel | c.874_875insTGGTCTAGCCCACCCCTAGTTTTCCTGG | p.Arg292LeufsTer3 | p.R292Lfs*3 | O43709 | protein_coding | TCGA-AO-A0JB-01 | Breast | breast invasive carcinoma | Female | <65 | III/IV | Chemotherapy | cyclophosphamide | SD | ||
| WBSCR22 | SNV | Missense_Mutation | novel | c.382C>T | p.Leu128Phe | p.L128F | O43709 | protein_coding | deleterious(0) | probably_damaging(0.998) | TCGA-2W-A8YY-01 | Cervix | cervical & endocervical cancer | Female | <65 | I/II | Chemotherapy | cisplatin | CR |
| WBSCR22 | SNV | Missense_Mutation | novel | c.41N>A | p.Pro14Gln | p.P14Q | O43709 | protein_coding | deleterious(0) | probably_damaging(0.97) | TCGA-C5-A8YR-01 | Cervix | cervical & endocervical cancer | Female | <65 | I/II | Unknown | Unknown | PD |
| WBSCR22 | SNV | Missense_Mutation | c.533N>T | p.Ala178Val | p.A178V | O43709 | protein_coding | deleterious(0) | probably_damaging(0.992) | TCGA-DM-A28A-01 | Colorectum | colon adenocarcinoma | Male | >=65 | III/IV | Unknown | Unknown | SD | |
| WBSCR22 | SNV | Missense_Mutation | novel | c.92G>A | p.Arg31Gln | p.R31Q | O43709 | protein_coding | deleterious(0) | probably_damaging(0.992) | TCGA-A5-A0G2-01 | Endometrium | uterine corpus endometrioid carcinoma | Female | <65 | III/IV | Unknown | Unknown | SD |
| Page: 1 2 3 4 |
Top |
Related drugs of malignant transformation related genes |
| Identification of chemicals and drugs interact with genes involved in malignant transfromation |
| (DGIdb 4.0) |
| Entrez ID | Symbol | Category | Interaction Types | Drug Claim Name | Drug Name | PMIDs |
| Page: 1 |

Copyright 2023-Present -The University of Texas Health Science Center at Houston |