
|
|||||
|
 | |
| |
| |
| |
| |
| |
|
Gene: USP16 |
Gene summary for USP16 |
| Gene information | Species | Human | Gene symbol | USP16 | Gene ID | 10600 |
| Gene name | ubiquitin specific peptidase 16 | |
| Gene Alias | UBP-M | |
| Cytomap | 21q21.3 | |
| Gene Type | protein-coding | GO ID | GO:0000278 | UniProtAcc | Q9Y5T5 |
Top |
Malignant transformation analysis |
| Identification of the aberrant gene expression in precancerous and cancerous lesions by comparing the gene expression of stem-like cells in diseased tissues with normal stem cells |
| Entrez ID | Symbol | Replicates | Species | Organ | Tissue | Adj P-value | Log2FC | Malignancy |
| 10600 | USP16 | C38 | Human | Oral cavity | OSCC | 8.19e-16 | 1.64e+00 | 0.172 |
| 10600 | USP16 | C43 | Human | Oral cavity | OSCC | 1.47e-30 | 6.70e-01 | 0.1704 |
| 10600 | USP16 | C46 | Human | Oral cavity | OSCC | 3.88e-25 | 7.48e-01 | 0.1673 |
| 10600 | USP16 | C51 | Human | Oral cavity | OSCC | 3.55e-14 | 9.17e-01 | 0.2674 |
| 10600 | USP16 | C57 | Human | Oral cavity | OSCC | 1.05e-15 | 6.98e-01 | 0.1679 |
| 10600 | USP16 | C06 | Human | Oral cavity | OSCC | 1.37e-03 | 1.10e+00 | 0.2699 |
| 10600 | USP16 | C08 | Human | Oral cavity | OSCC | 1.11e-18 | 5.60e-01 | 0.1919 |
| 10600 | USP16 | C09 | Human | Oral cavity | OSCC | 4.03e-21 | 7.82e-01 | 0.1431 |
| 10600 | USP16 | LN22 | Human | Oral cavity | OSCC | 2.89e-07 | 1.31e+00 | 0.1733 |
| 10600 | USP16 | LN38 | Human | Oral cavity | OSCC | 2.92e-04 | 1.28e+00 | 0.168 |
| 10600 | USP16 | LN46 | Human | Oral cavity | OSCC | 6.99e-14 | 7.82e-01 | 0.1666 |
| 10600 | USP16 | EOLP-1 | Human | Oral cavity | EOLP | 5.01e-04 | 8.37e-02 | -0.0202 |
| 10600 | USP16 | SYSMH1 | Human | Oral cavity | OSCC | 1.88e-10 | 3.06e-01 | 0.1127 |
| 10600 | USP16 | SYSMH2 | Human | Oral cavity | OSCC | 1.32e-22 | 5.99e-01 | 0.2326 |
| 10600 | USP16 | SYSMH3 | Human | Oral cavity | OSCC | 5.97e-34 | 9.80e-01 | 0.2442 |
| 10600 | USP16 | SYSMH5 | Human | Oral cavity | OSCC | 2.02e-09 | 3.05e-01 | 0.0647 |
| 10600 | USP16 | SYSMH6 | Human | Oral cavity | OSCC | 5.97e-11 | 4.08e-01 | 0.1275 |
| 10600 | USP16 | P4_S8_cSCC | Human | Skin | cSCC | 3.94e-09 | 1.66e-01 | -0.3095 |
| 10600 | USP16 | P5_S10_cSCC | Human | Skin | cSCC | 7.06e-09 | 6.50e-02 | -0.299 |
| 10600 | USP16 | P1_cSCC | Human | Skin | cSCC | 9.03e-26 | 9.89e-01 | 0.0292 |
| Page: 1 2 3 4 5 6 7 |
| Tissue | Expression Dynamics | Abbreviation |
| Esophagus |  | ESCC: Esophageal squamous cell carcinoma |
| HGIN: High-grade intraepithelial neoplasias | ||
| LGIN: Low-grade intraepithelial neoplasias | ||
| Liver |  | HCC: Hepatocellular carcinoma |
| NAFLD: Non-alcoholic fatty liver disease | ||
| Oral Cavity | 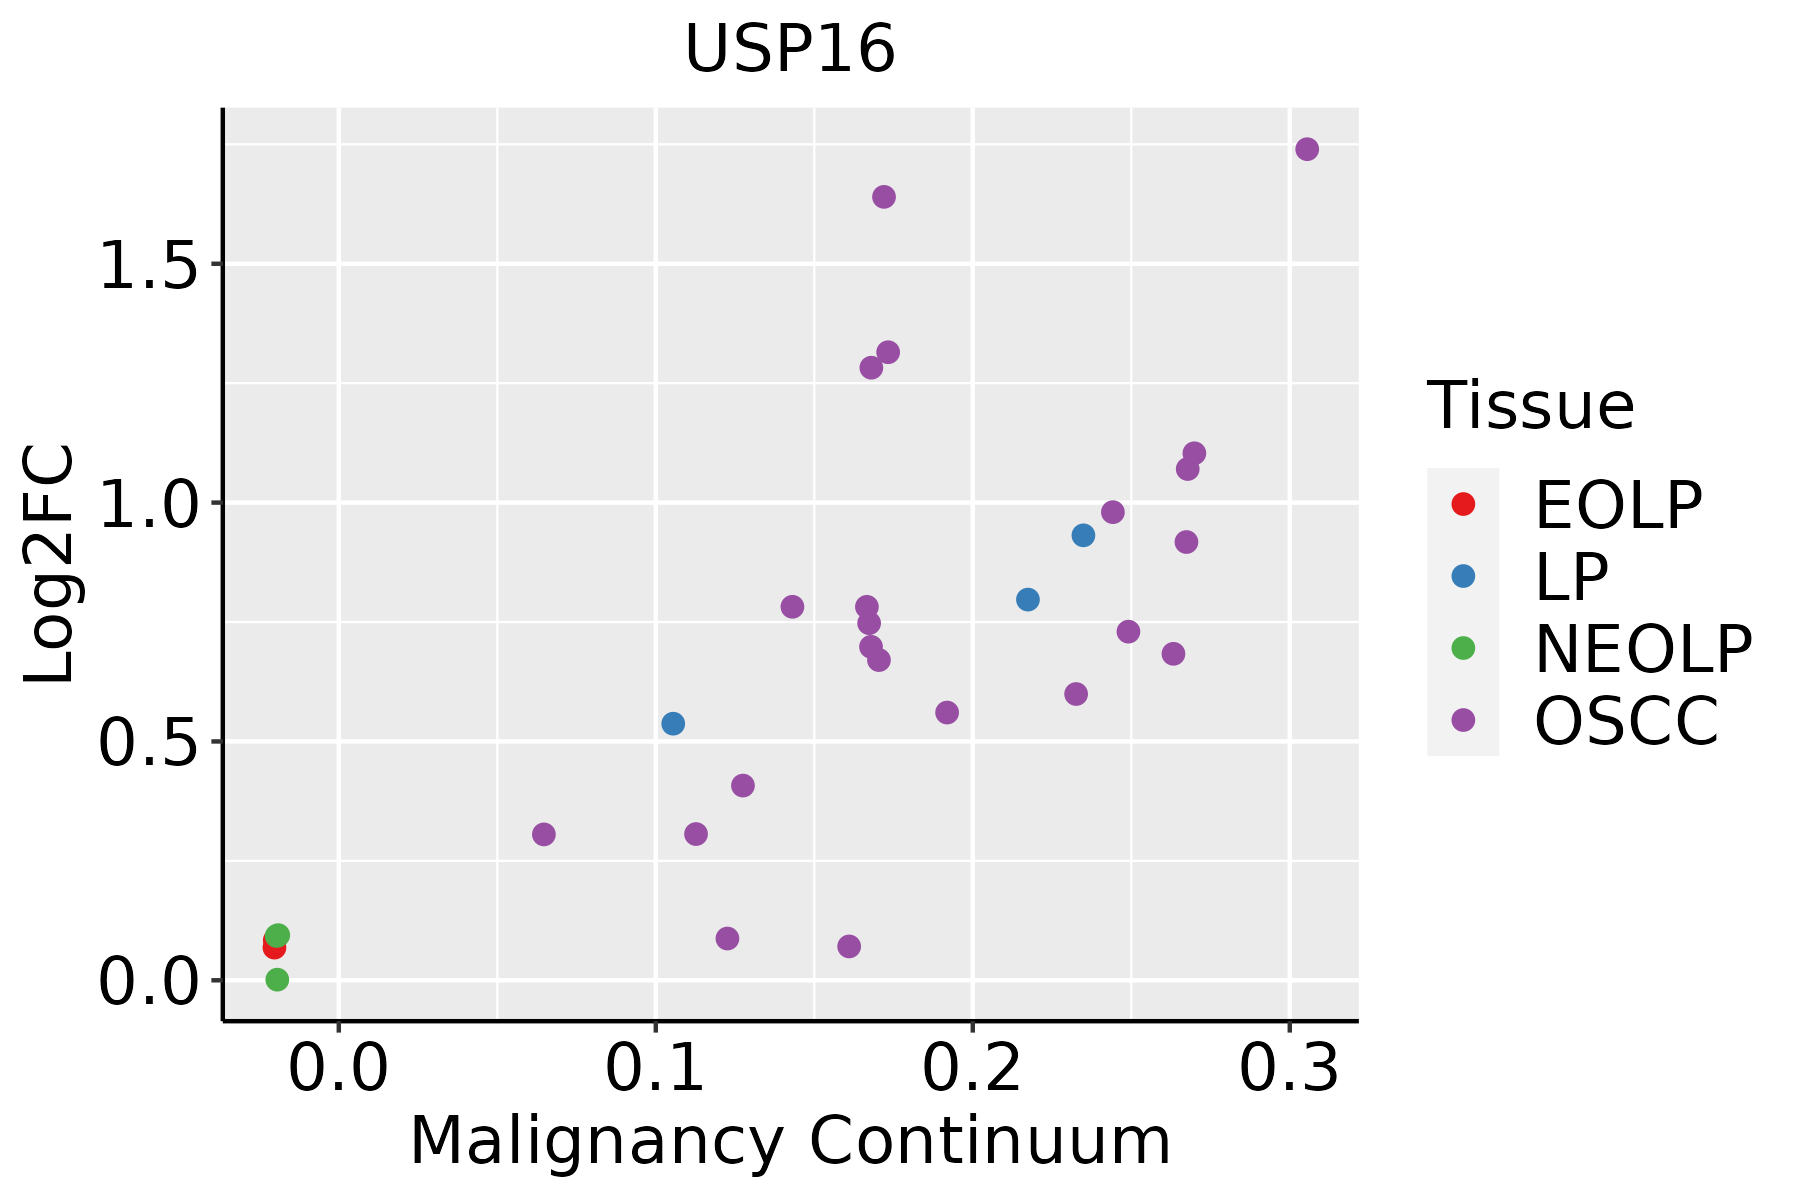 | EOLP: Erosive Oral lichen planus |
| LP: leukoplakia | ||
| NEOLP: Non-erosive oral lichen planus | ||
| OSCC: Oral squamous cell carcinoma | ||
| Prostate |  | BPH: Benign Prostatic Hyperplasia |
| Skin |  | AK: Actinic keratosis |
| cSCC: Cutaneous squamous cell carcinoma | ||
| SCCIS:squamous cell carcinoma in situ | ||
| Thyroid | 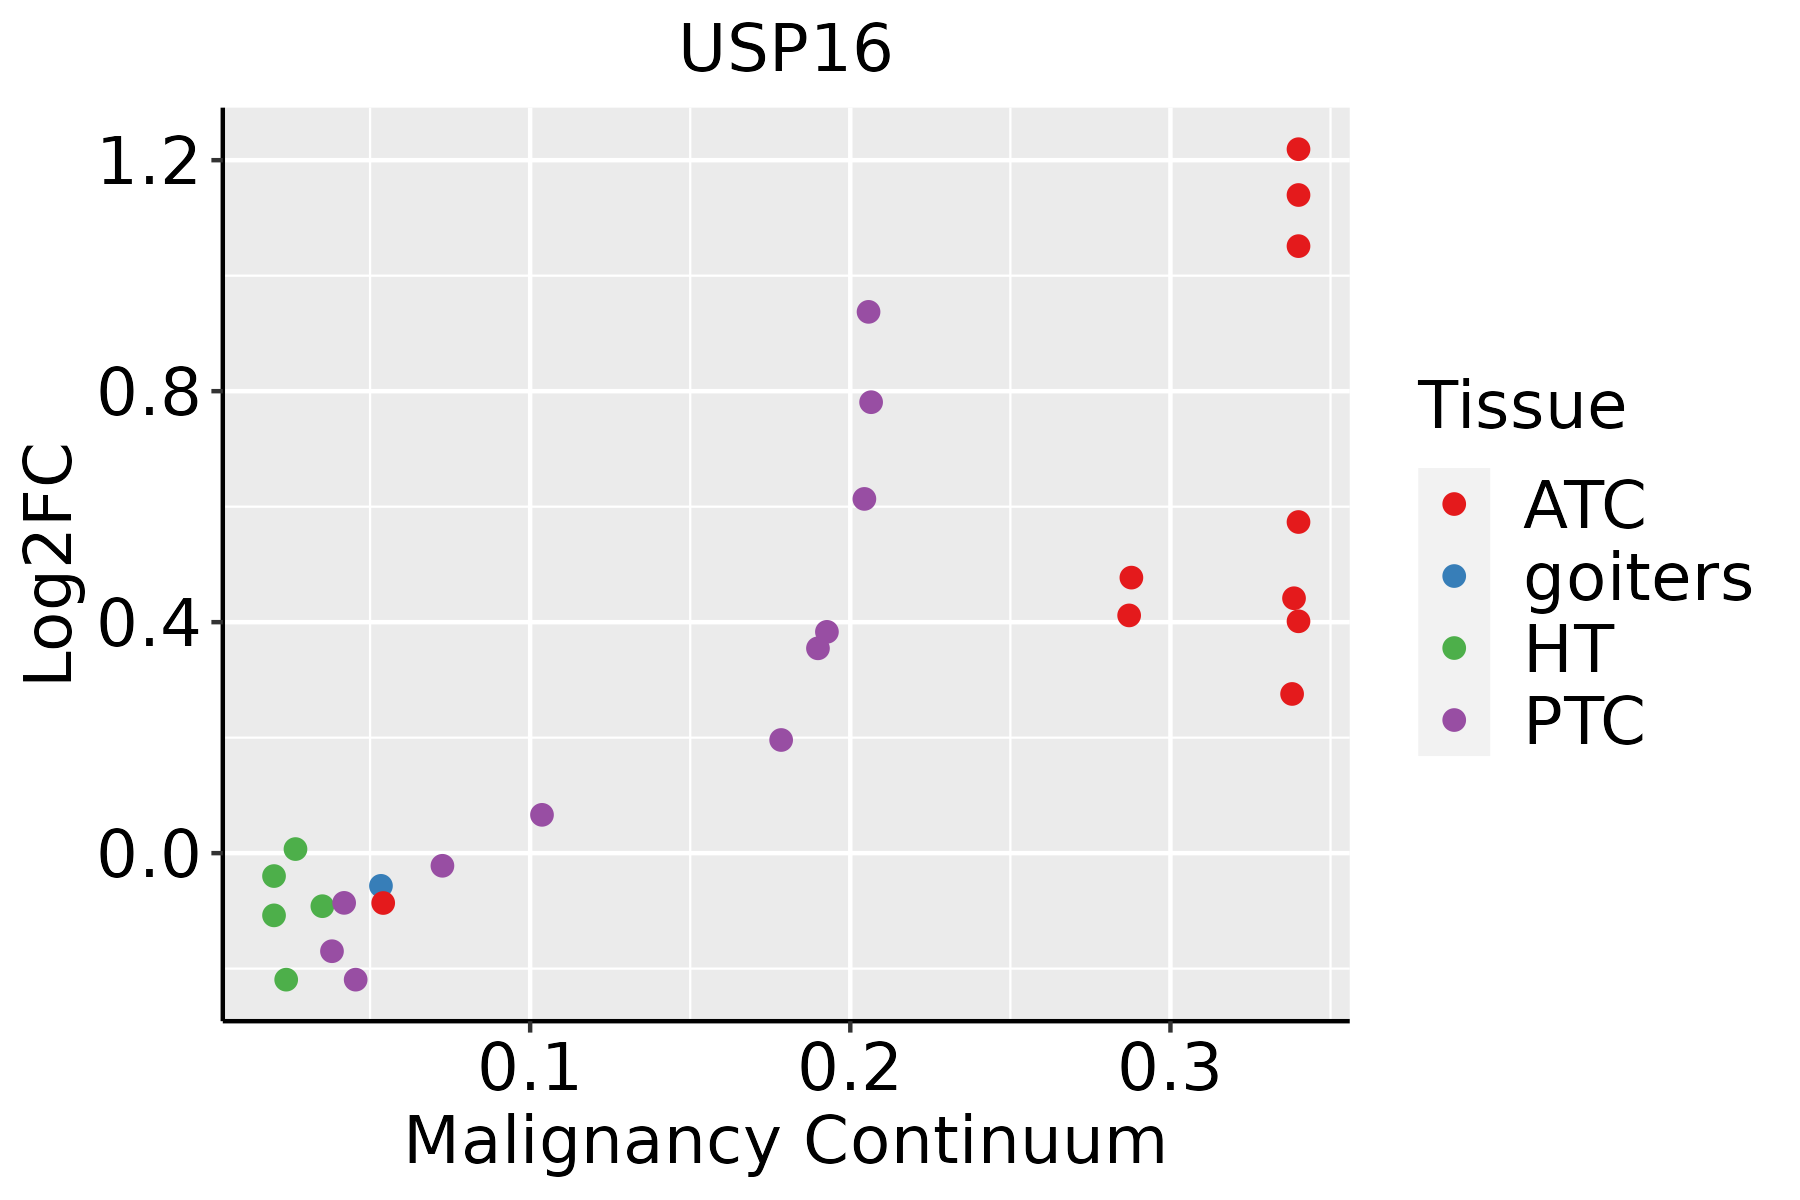 | ATC: Anaplastic thyroid cancer |
| HT: Hashimoto's thyroiditis | ||
| PTC: Papillary thyroid cancer |
| ∗log2FC in expression of this searched gene in stem-like cells from each diseased tissue sample relative to stem-like cells in normal samples in each tissue plotted against the malignancy continuum. Samples are colored based on if they are from different disease stage. |
Top |
Malignant transformation related pathway analysis |
| Find out the enriched GO biological processes and KEGG pathways involved in transition from healthy to precancer to cancer |
| Tissue | Disease Stage | Enriched GO biological Processes |
| Colorectum | AD |  |
| Colorectum | SER |  |
| Colorectum | MSS |  |
| Colorectum | MSI-H |  |
| Colorectum | FAP |  |
| ∗Top 15 enriched GO BP terms are showed in the bar plot of each disease state in each tissue. Each row represents a significant GO biological process which is colored according to the -log10(p.adjust). |
| Page: 1 2 3 4 5 6 7 8 9 |
| GO ID | Tissue | Disease Stage | Description | Gene Ratio | Bg Ratio | pvalue | p.adjust | Count |
| GO:00066117 | Endometrium | AEH | protein export from nucleus | 17/2100 | 57/18723 | 1.13e-04 | 1.60e-03 | 17 |
| GO:000691310 | Endometrium | AEH | nucleocytoplasmic transport | 54/2100 | 301/18723 | 3.24e-04 | 3.62e-03 | 54 |
| GO:005116910 | Endometrium | AEH | nuclear transport | 54/2100 | 301/18723 | 3.24e-04 | 3.62e-03 | 54 |
| GO:005116810 | Endometrium | AEH | nuclear export | 32/2100 | 154/18723 | 4.02e-04 | 4.29e-03 | 32 |
| GO:004340910 | Endometrium | AEH | negative regulation of MAPK cascade | 33/2100 | 180/18723 | 3.04e-03 | 2.15e-02 | 33 |
| GO:000661114 | Endometrium | EEC | protein export from nucleus | 20/2168 | 57/18723 | 2.96e-06 | 8.25e-05 | 20 |
| GO:000691314 | Endometrium | EEC | nucleocytoplasmic transport | 59/2168 | 301/18723 | 3.31e-05 | 5.65e-04 | 59 |
| GO:005116914 | Endometrium | EEC | nuclear transport | 59/2168 | 301/18723 | 3.31e-05 | 5.65e-04 | 59 |
| GO:005116814 | Endometrium | EEC | nuclear export | 35/2168 | 154/18723 | 6.36e-05 | 9.48e-04 | 35 |
| GO:004340914 | Endometrium | EEC | negative regulation of MAPK cascade | 34/2168 | 180/18723 | 2.69e-03 | 1.95e-02 | 34 |
| GO:001657015 | Esophagus | ESCC | histone modification | 323/8552 | 463/18723 | 2.61e-26 | 7.88e-24 | 323 |
| GO:014001414 | Esophagus | ESCC | mitotic nuclear division | 218/8552 | 287/18723 | 6.17e-26 | 1.78e-23 | 218 |
| GO:0006417111 | Esophagus | ESCC | regulation of translation | 304/8552 | 468/18723 | 1.53e-17 | 1.33e-15 | 304 |
| GO:0045727111 | Esophagus | ESCC | positive regulation of translation | 107/8552 | 136/18723 | 2.79e-15 | 1.68e-13 | 107 |
| GO:0034250111 | Esophagus | ESCC | positive regulation of cellular amide metabolic process | 123/8552 | 162/18723 | 3.32e-15 | 1.93e-13 | 123 |
| GO:00482853 | Esophagus | ESCC | organelle fission | 301/8552 | 488/18723 | 4.64e-13 | 2.12e-11 | 301 |
| GO:00002802 | Esophagus | ESCC | nuclear division | 270/8552 | 439/18723 | 1.17e-11 | 4.24e-10 | 270 |
| GO:000641419 | Esophagus | ESCC | translational elongation | 41/8552 | 55/18723 | 1.26e-05 | 1.16e-04 | 41 |
| GO:007064612 | Esophagus | ESCC | protein modification by small protein removal | 95/8552 | 157/18723 | 1.25e-04 | 8.56e-04 | 95 |
| GO:00165783 | Esophagus | ESCC | histone deubiquitination | 18/8552 | 23/18723 | 1.50e-03 | 7.06e-03 | 18 |
| Page: 1 2 3 4 5 6 7 8 |
| Pathway ID | Tissue | Disease Stage | Description | Gene Ratio | Bg Ratio | pvalue | p.adjust | qvalue | Count |
| Page: 1 |
Top |
Cell-cell communication analysis |
| Identification of potential cell-cell interactions between two cell types and their ligand-receptor pairs for different disease states |
| Ligand | Receptor | LRpair | Pathway | Tissue | Disease Stage |
| Page: 1 |
Top |
Single-cell gene regulatory network inference analysis |
| Find out the significant the regulons (TFs) and the target genes of each regulon across cell types for different disease states |
| TF | Cell Type | Tissue | Disease Stage | Target Gene | RSS | Regulon Activity |
| ∗The dot plots of a searched regulon are shown for all cell subpopulations in each disease state of each tissue based on the regulon specific score inferred using pySCENIC and by calculating the average expression. |
| Page: 1 |
Top |
Somatic mutation of malignant transformation related genes |
| Annotation of somatic variants for genes involved in malignant transformation |
| Hugo Symbol | Variant Class | Variant Classification | dbSNP RS | HGVSc | HGVSp | HGVSp Short | SWISSPROT | BIOTYPE | SIFT | PolyPhen | Tumor Sample Barcode | Tissue | Histology | Sex | Age | Stage | Therapy Types | Drugs | Outcome |
| USP16 | SNV | Missense_Mutation | novel | c.1066G>C | p.Asp356His | p.D356H | Q9Y5T5 | protein_coding | deleterious(0) | probably_damaging(1) | TCGA-A8-A07U-01 | Breast | breast invasive carcinoma | Female | >=65 | III/IV | Chemotherapy | 5-fluorouracil | SD |
| USP16 | SNV | Missense_Mutation | novel | c.194C>T | p.Thr65Ile | p.T65I | Q9Y5T5 | protein_coding | tolerated(0.09) | benign(0.073) | TCGA-BH-A0HF-01 | Breast | breast invasive carcinoma | Female | >=65 | I/II | Hormone Therapy | arimidex | SD |
| USP16 | SNV | Missense_Mutation | c.911T>C | p.Leu304Pro | p.L304P | Q9Y5T5 | protein_coding | deleterious(0) | probably_damaging(1) | TCGA-D8-A1XK-01 | Breast | breast invasive carcinoma | Female | <65 | I/II | Chemotherapy | doxorubicine+cyclophosphamide | SD | |
| USP16 | deletion | Frame_Shift_Del | c.814delN | p.Lys273ArgfsTer4 | p.K273Rfs*4 | Q9Y5T5 | protein_coding | TCGA-BH-A0HA-01 | Breast | breast invasive carcinoma | Female | <65 | I/II | Unknown | Unknown | SD | |||
| USP16 | insertion | Frame_Shift_Ins | rs781590124 | c.1041_1042insA | p.Ser350IlefsTer7 | p.S350Ifs*7 | Q9Y5T5 | protein_coding | TCGA-C8-A135-01 | Breast | breast invasive carcinoma | Female | <65 | I/II | Chemotherapy | 5-fluorouracil | CR | ||
| USP16 | SNV | Missense_Mutation | rs776153683 | c.2123N>A | p.Arg708His | p.R708H | Q9Y5T5 | protein_coding | tolerated(0.13) | benign(0.035) | TCGA-2W-A8YY-01 | Cervix | cervical & endocervical cancer | Female | <65 | I/II | Chemotherapy | cisplatin | CR |
| USP16 | deletion | Frame_Shift_Del | novel | c.2155delA | p.Ile719SerfsTer2 | p.I719Sfs*2 | Q9Y5T5 | protein_coding | TCGA-C5-A7X5-01 | Cervix | cervical & endocervical cancer | Female | >=65 | I/II | Chemotherapy | carboplatin | PD | ||
| USP16 | SNV | Missense_Mutation | c.1481A>G | p.Lys494Arg | p.K494R | Q9Y5T5 | protein_coding | tolerated(0.16) | benign(0.037) | TCGA-A6-5661-01 | Colorectum | colon adenocarcinoma | Female | >=65 | I/II | Unknown | Unknown | SD | |
| USP16 | SNV | Missense_Mutation | rs768071962 | c.2122C>T | p.Arg708Cys | p.R708C | Q9Y5T5 | protein_coding | tolerated(0.1) | benign(0.009) | TCGA-AA-3877-01 | Colorectum | colon adenocarcinoma | Female | >=65 | I/II | Unknown | Unknown | SD |
| USP16 | SNV | Missense_Mutation | novel | c.1517N>C | p.Lys506Thr | p.K506T | Q9Y5T5 | protein_coding | tolerated(0.18) | benign(0.001) | TCGA-AA-3984-01 | Colorectum | colon adenocarcinoma | Female | <65 | I/II | Unknown | Unknown | SD |
| Page: 1 2 3 4 5 6 7 8 9 |
Top |
Related drugs of malignant transformation related genes |
| Identification of chemicals and drugs interact with genes involved in malignant transfromation |
| (DGIdb 4.0) |
| Entrez ID | Symbol | Category | Interaction Types | Drug Claim Name | Drug Name | PMIDs |
| Page: 1 |

Copyright 2023-Present -The University of Texas Health Science Center at Houston |