
|
|||||
|
 | |
| |
| |
| |
| |
| |
|
Gene: UROS |
Gene summary for UROS |
| Gene information | Species | Human | Gene symbol | UROS | Gene ID | 7390 |
| Gene name | uroporphyrinogen III synthase | |
| Gene Alias | UROIIIS | |
| Cytomap | 10q26.2 | |
| Gene Type | protein-coding | GO ID | GO:0006082 | UniProtAcc | A0A0S2Z4T8 |
Top |
Malignant transformation analysis |
| Identification of the aberrant gene expression in precancerous and cancerous lesions by comparing the gene expression of stem-like cells in diseased tissues with normal stem cells |
| Entrez ID | Symbol | Replicates | Species | Organ | Tissue | Adj P-value | Log2FC | Malignancy |
| 7390 | UROS | C43 | Human | Oral cavity | OSCC | 5.92e-05 | 1.51e-01 | 0.1704 |
| 7390 | UROS | C46 | Human | Oral cavity | OSCC | 3.50e-28 | 6.72e-01 | 0.1673 |
| 7390 | UROS | C51 | Human | Oral cavity | OSCC | 9.21e-09 | 6.29e-01 | 0.2674 |
| 7390 | UROS | C57 | Human | Oral cavity | OSCC | 6.12e-04 | 4.31e-01 | 0.1679 |
| 7390 | UROS | C06 | Human | Oral cavity | OSCC | 7.85e-11 | 1.65e+00 | 0.2699 |
| 7390 | UROS | C07 | Human | Oral cavity | OSCC | 4.44e-04 | 9.38e-01 | 0.2491 |
| 7390 | UROS | C08 | Human | Oral cavity | OSCC | 6.88e-24 | 6.42e-01 | 0.1919 |
| 7390 | UROS | C09 | Human | Oral cavity | OSCC | 1.12e-05 | 3.31e-01 | 0.1431 |
| 7390 | UROS | LN22 | Human | Oral cavity | OSCC | 2.46e-06 | 7.45e-01 | 0.1733 |
| 7390 | UROS | LN46 | Human | Oral cavity | OSCC | 4.04e-09 | 4.85e-01 | 0.1666 |
| 7390 | UROS | LP15 | Human | Oral cavity | LP | 4.68e-04 | 1.10e+00 | 0.2174 |
| 7390 | UROS | SYSMH2 | Human | Oral cavity | OSCC | 1.67e-12 | 4.65e-01 | 0.2326 |
| 7390 | UROS | SYSMH3 | Human | Oral cavity | OSCC | 1.17e-25 | 8.33e-01 | 0.2442 |
| 7390 | UROS | SYSMH5 | Human | Oral cavity | OSCC | 1.69e-02 | 2.48e-01 | 0.0647 |
| 7390 | UROS | SYSMH6 | Human | Oral cavity | OSCC | 1.73e-02 | 2.72e-01 | 0.1275 |
| 7390 | UROS | P1_cSCC | Human | Skin | cSCC | 1.21e-11 | 5.32e-01 | 0.0292 |
| 7390 | UROS | P2_cSCC | Human | Skin | cSCC | 2.13e-07 | 3.68e-01 | -0.024 |
| 7390 | UROS | P4_cSCC | Human | Skin | cSCC | 2.51e-18 | 5.22e-01 | -0.00290000000000005 |
| 7390 | UROS | P10_cSCC | Human | Skin | cSCC | 2.22e-20 | 6.56e-01 | 0.1017 |
| 7390 | UROS | male-WTA | Human | Thyroid | PTC | 1.54e-22 | 1.49e-01 | 0.1037 |
| Page: 1 2 3 4 5 6 |
| Tissue | Expression Dynamics | Abbreviation |
| Esophagus | 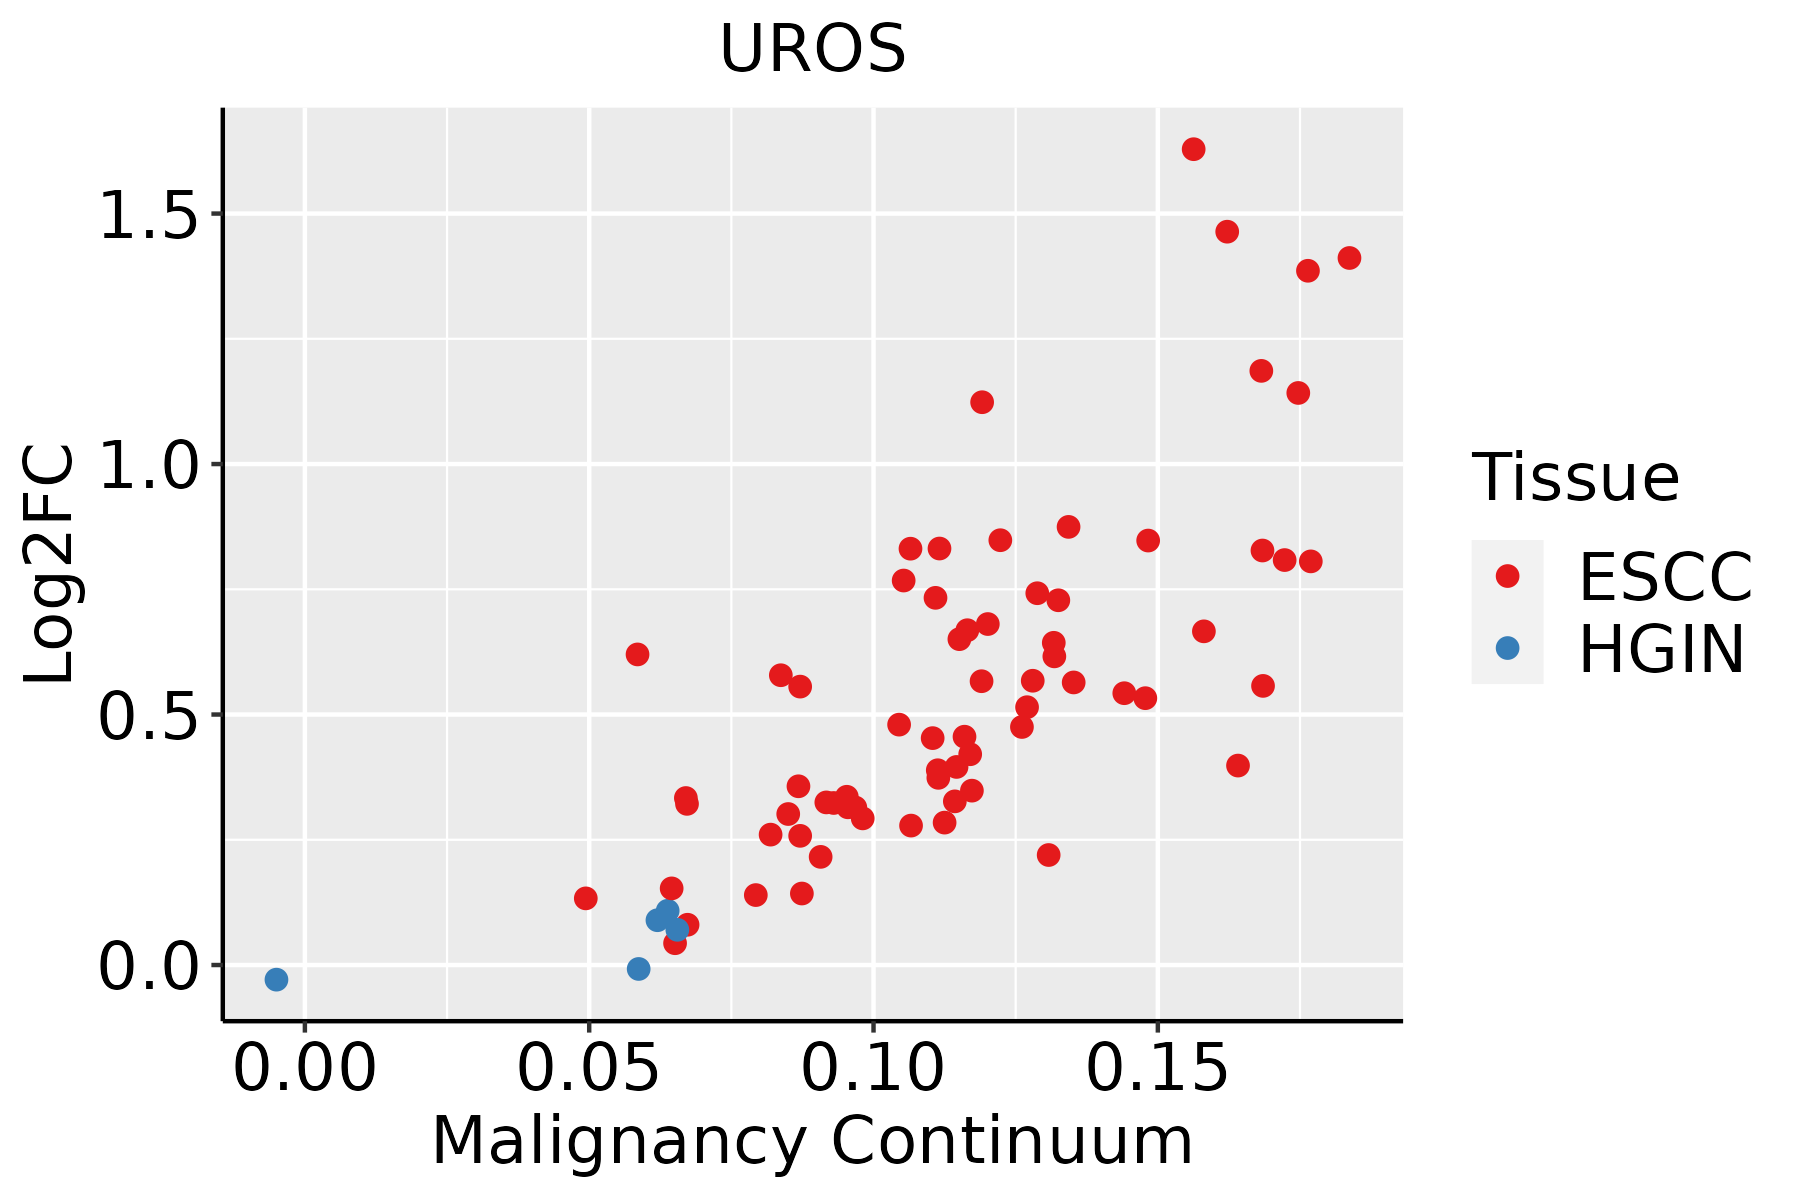 | ESCC: Esophageal squamous cell carcinoma |
| HGIN: High-grade intraepithelial neoplasias | ||
| LGIN: Low-grade intraepithelial neoplasias | ||
| Liver | 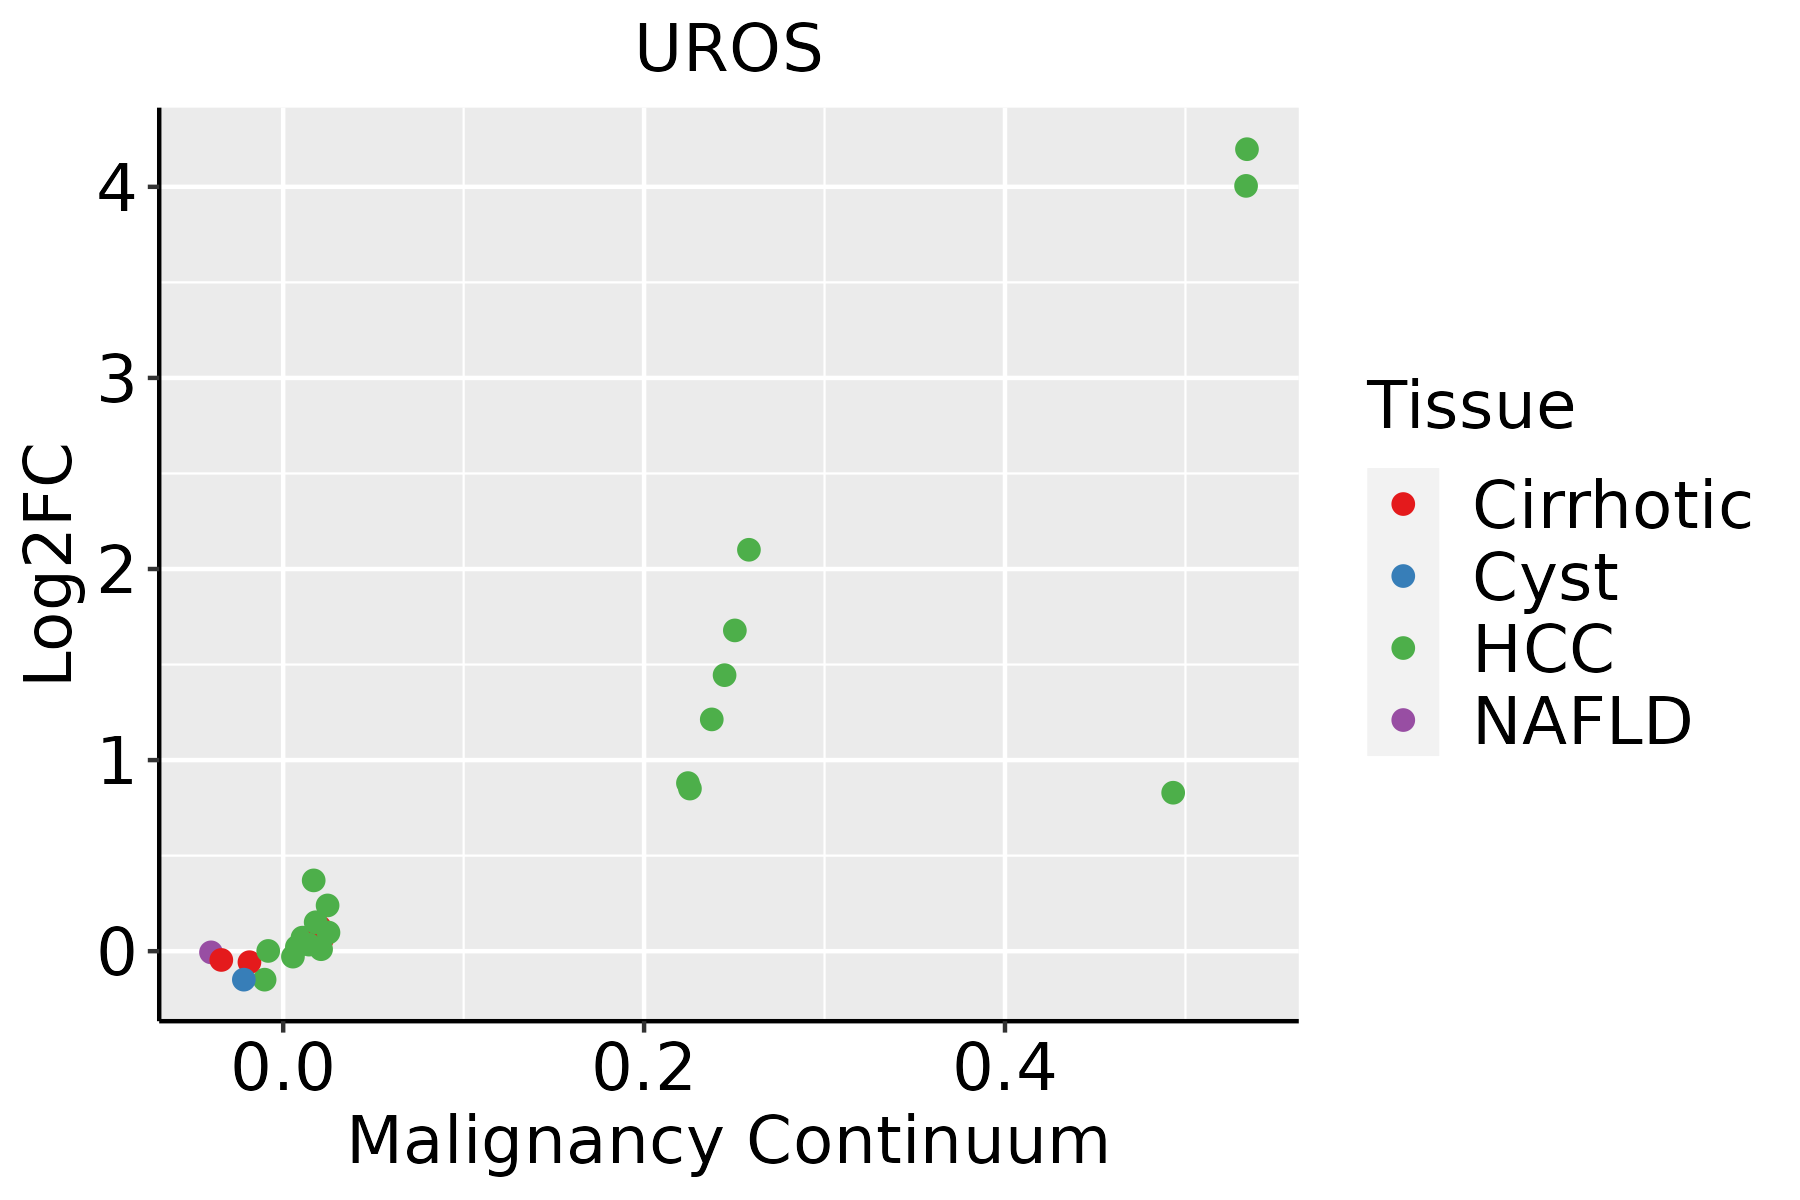 | HCC: Hepatocellular carcinoma |
| NAFLD: Non-alcoholic fatty liver disease | ||
| Oral Cavity | 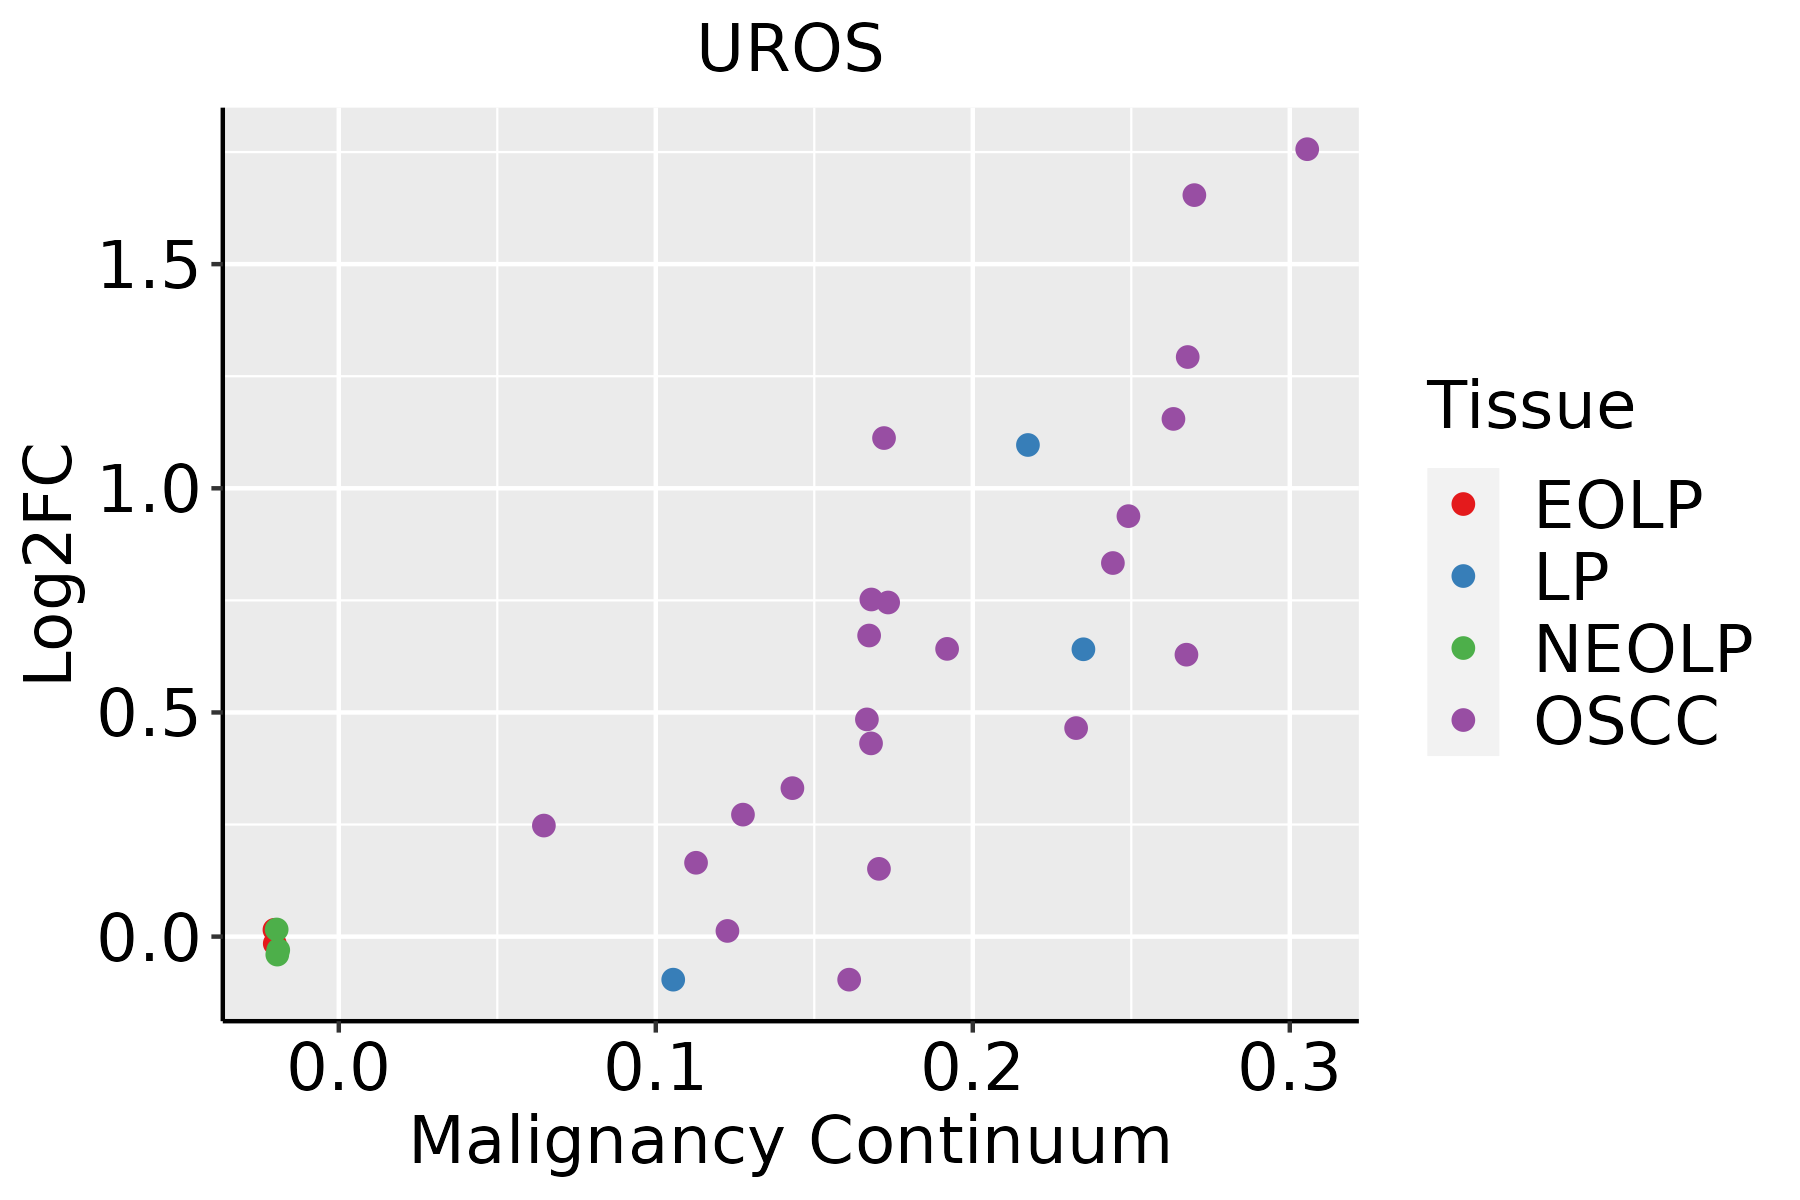 | EOLP: Erosive Oral lichen planus |
| LP: leukoplakia | ||
| NEOLP: Non-erosive oral lichen planus | ||
| OSCC: Oral squamous cell carcinoma | ||
| Skin | 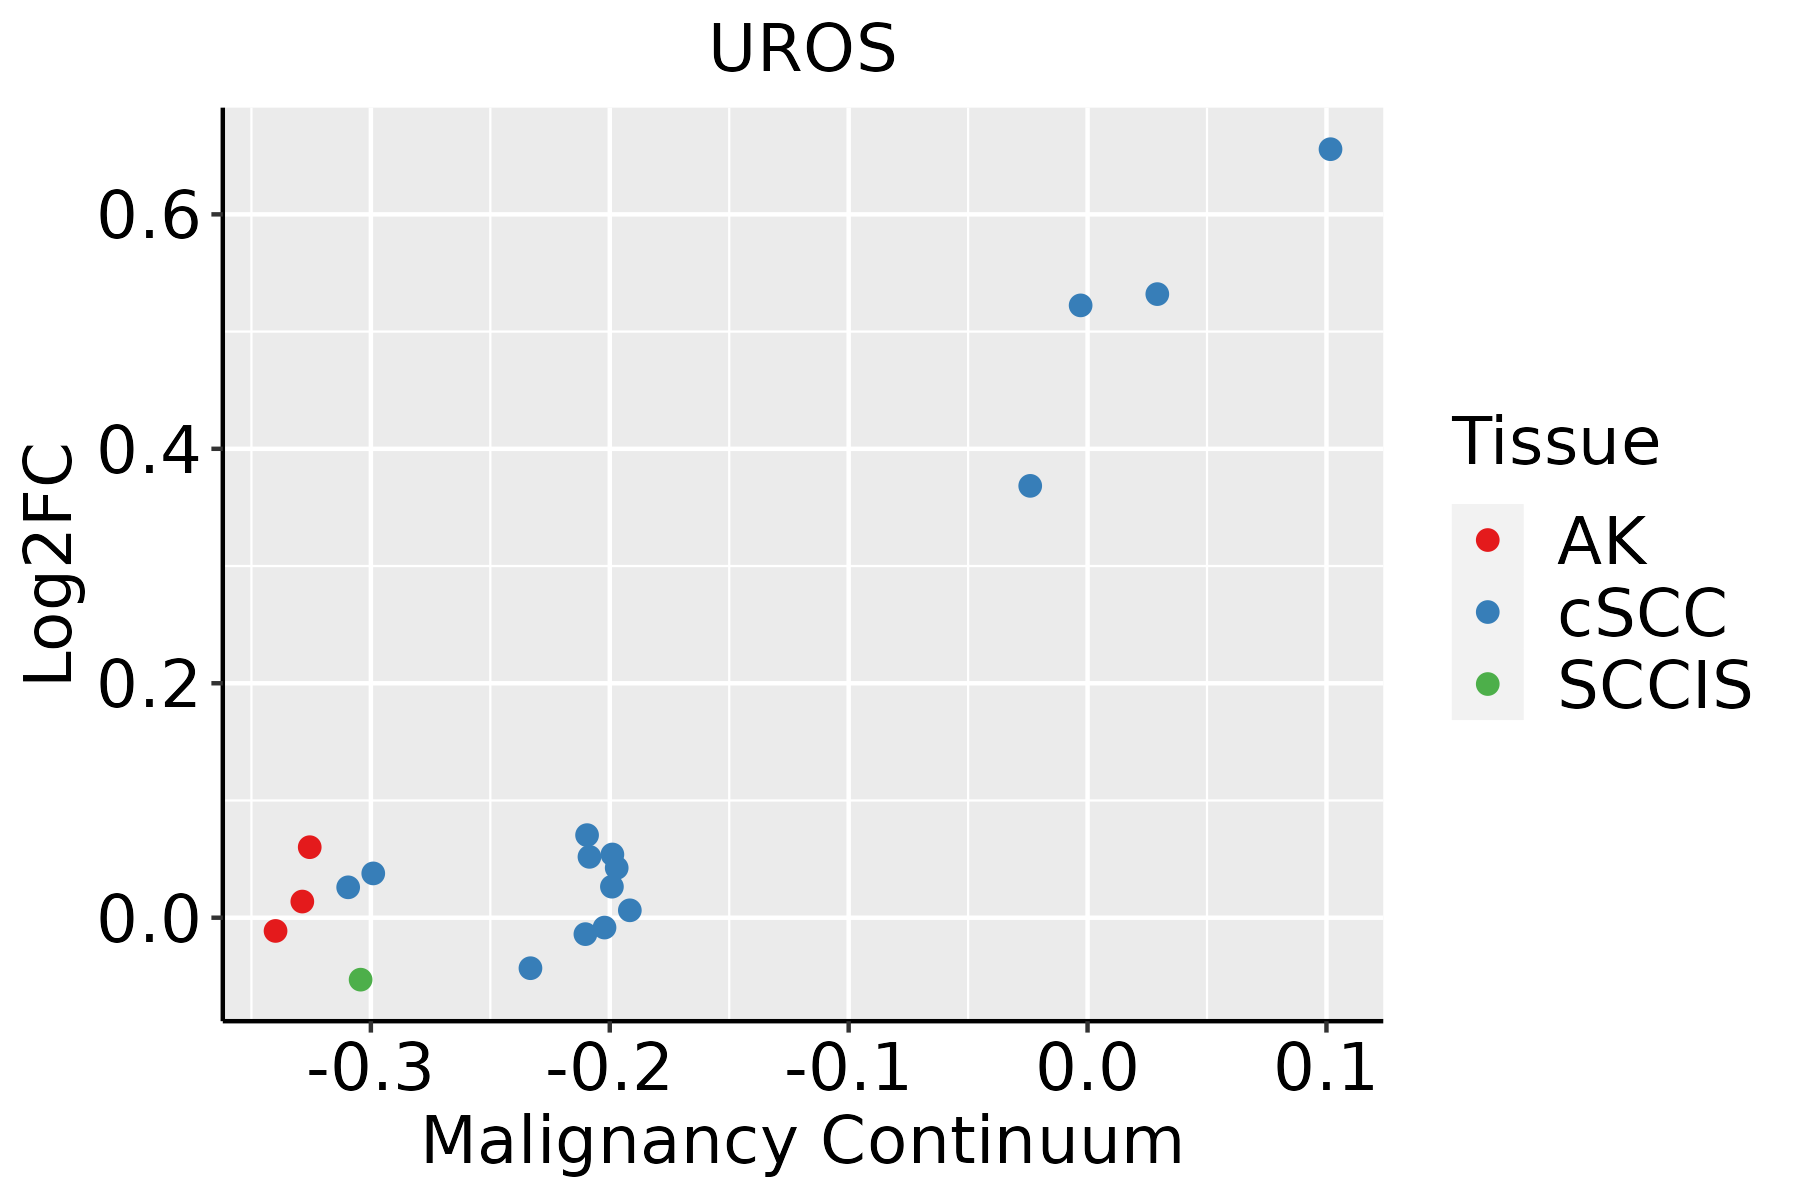 | AK: Actinic keratosis |
| cSCC: Cutaneous squamous cell carcinoma | ||
| SCCIS:squamous cell carcinoma in situ | ||
| Thyroid | 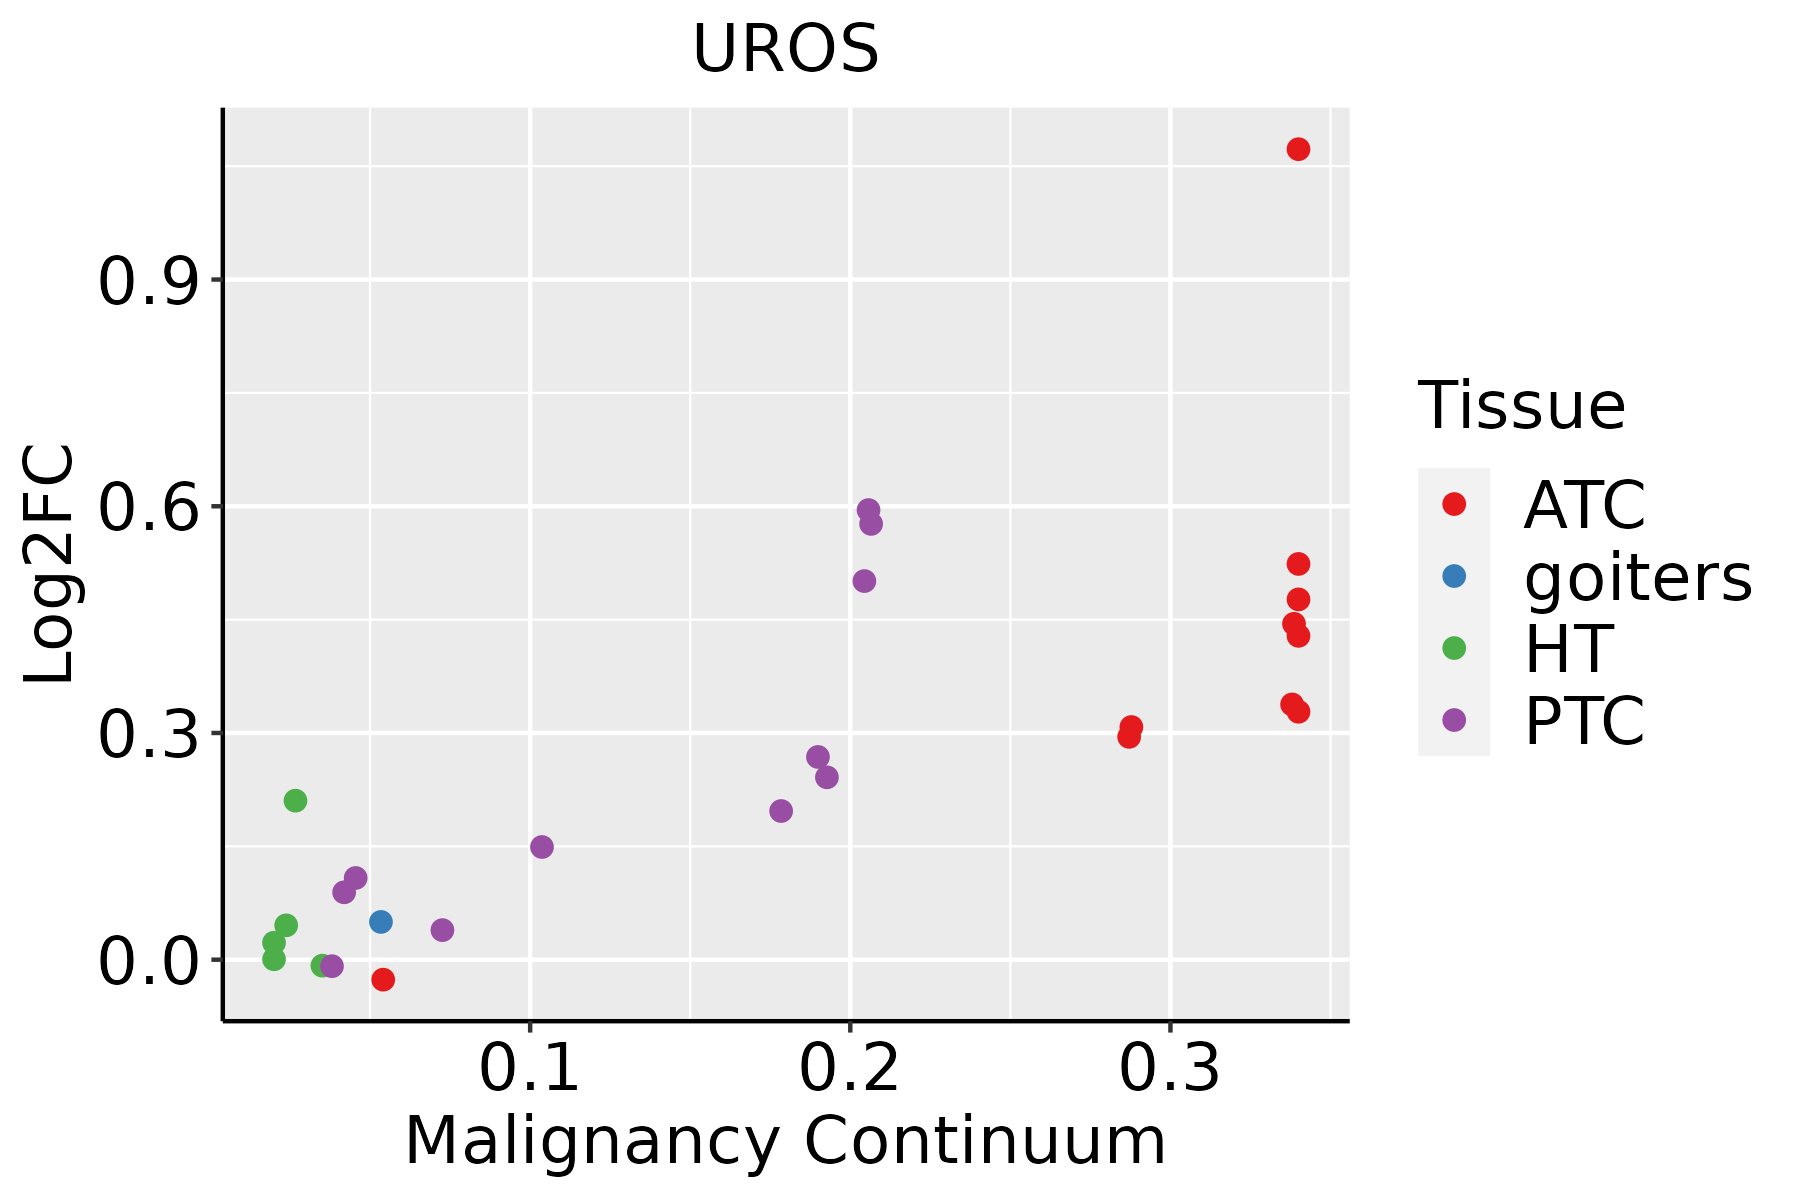 | ATC: Anaplastic thyroid cancer |
| HT: Hashimoto's thyroiditis | ||
| PTC: Papillary thyroid cancer |
| ∗log2FC in expression of this searched gene in stem-like cells from each diseased tissue sample relative to stem-like cells in normal samples in each tissue plotted against the malignancy continuum. Samples are colored based on if they are from different disease stage. |
Top |
Malignant transformation related pathway analysis |
| Find out the enriched GO biological processes and KEGG pathways involved in transition from healthy to precancer to cancer |
| Tissue | Disease Stage | Enriched GO biological Processes |
| Colorectum | AD |  |
| Colorectum | SER |  |
| Colorectum | MSS |  |
| Colorectum | MSI-H |  |
| Colorectum | FAP |  |
| ∗Top 15 enriched GO BP terms are showed in the bar plot of each disease state in each tissue. Each row represents a significant GO biological process which is colored according to the -log10(p.adjust). |
| Page: 1 2 3 4 5 6 7 8 9 |
| GO ID | Tissue | Disease Stage | Description | Gene Ratio | Bg Ratio | pvalue | p.adjust | Count |
| GO:004668514 | Esophagus | ESCC | response to arsenic-containing substance | 30/8552 | 33/18723 | 5.73e-08 | 1.02e-06 | 30 |
| GO:007124316 | Esophagus | ESCC | cellular response to arsenic-containing substance | 19/8552 | 20/18723 | 3.83e-06 | 4.14e-05 | 19 |
| GO:001003827 | Esophagus | ESCC | response to metal ion | 208/8552 | 373/18723 | 5.02e-05 | 3.90e-04 | 208 |
| GO:00466774 | Esophagus | ESCC | response to antibiotic | 34/8552 | 47/18723 | 1.91e-04 | 1.21e-03 | 34 |
| GO:00463948 | Esophagus | ESCC | carboxylic acid biosynthetic process | 175/8552 | 314/18723 | 1.98e-04 | 1.26e-03 | 175 |
| GO:00160538 | Esophagus | ESCC | organic acid biosynthetic process | 175/8552 | 316/18723 | 3.04e-04 | 1.82e-03 | 175 |
| GO:00067791 | Esophagus | ESCC | porphyrin-containing compound biosynthetic process | 23/8552 | 31/18723 | 1.20e-03 | 5.88e-03 | 23 |
| GO:00330141 | Esophagus | ESCC | tetrapyrrole biosynthetic process | 23/8552 | 31/18723 | 1.20e-03 | 5.88e-03 | 23 |
| GO:00461482 | Esophagus | ESCC | pigment biosynthetic process | 40/8552 | 62/18723 | 2.14e-03 | 9.54e-03 | 40 |
| GO:00067832 | Esophagus | ESCC | heme biosynthetic process | 20/8552 | 27/18723 | 2.61e-03 | 1.11e-02 | 20 |
| GO:00330132 | Esophagus | ESCC | tetrapyrrole metabolic process | 37/8552 | 59/18723 | 6.23e-03 | 2.29e-02 | 37 |
| GO:00424401 | Esophagus | ESCC | pigment metabolic process | 50/8552 | 84/18723 | 7.34e-03 | 2.64e-02 | 50 |
| GO:00421681 | Esophagus | ESCC | heme metabolic process | 27/8552 | 42/18723 | 1.16e-02 | 3.90e-02 | 27 |
| GO:001605312 | Liver | Cirrhotic | organic acid biosynthetic process | 139/4634 | 316/18723 | 4.28e-14 | 3.83e-12 | 139 |
| GO:004639412 | Liver | Cirrhotic | carboxylic acid biosynthetic process | 137/4634 | 314/18723 | 1.40e-13 | 1.14e-11 | 137 |
| GO:001003812 | Liver | Cirrhotic | response to metal ion | 150/4634 | 373/18723 | 2.27e-11 | 1.37e-09 | 150 |
| GO:00712434 | Liver | Cirrhotic | cellular response to arsenic-containing substance | 15/4634 | 20/18723 | 3.29e-06 | 5.72e-05 | 15 |
| GO:00466854 | Liver | Cirrhotic | response to arsenic-containing substance | 20/4634 | 33/18723 | 1.29e-05 | 1.82e-04 | 20 |
| GO:0033013 | Liver | Cirrhotic | tetrapyrrole metabolic process | 24/4634 | 59/18723 | 5.06e-03 | 2.62e-02 | 24 |
| GO:0006778 | Liver | Cirrhotic | porphyrin-containing compound metabolic process | 20/4634 | 49/18723 | 9.60e-03 | 4.35e-02 | 20 |
| Page: 1 2 3 |
| Pathway ID | Tissue | Disease Stage | Description | Gene Ratio | Bg Ratio | pvalue | p.adjust | qvalue | Count |
| hsa012405 | Esophagus | ESCC | Biosynthesis of cofactors | 97/4205 | 153/8465 | 3.88e-04 | 1.35e-03 | 6.94e-04 | 97 |
| hsa0124012 | Esophagus | ESCC | Biosynthesis of cofactors | 97/4205 | 153/8465 | 3.88e-04 | 1.35e-03 | 6.94e-04 | 97 |
| hsa01240 | Liver | Cirrhotic | Biosynthesis of cofactors | 66/2530 | 153/8465 | 3.11e-04 | 1.99e-03 | 1.23e-03 | 66 |
| hsa012401 | Liver | Cirrhotic | Biosynthesis of cofactors | 66/2530 | 153/8465 | 3.11e-04 | 1.99e-03 | 1.23e-03 | 66 |
| hsa012402 | Liver | HCC | Biosynthesis of cofactors | 103/4020 | 153/8465 | 4.67e-07 | 5.05e-06 | 2.81e-06 | 103 |
| hsa012403 | Liver | HCC | Biosynthesis of cofactors | 103/4020 | 153/8465 | 4.67e-07 | 5.05e-06 | 2.81e-06 | 103 |
| hsa012404 | Oral cavity | OSCC | Biosynthesis of cofactors | 88/3704 | 153/8465 | 3.84e-04 | 1.20e-03 | 6.12e-04 | 88 |
| hsa0124011 | Oral cavity | OSCC | Biosynthesis of cofactors | 88/3704 | 153/8465 | 3.84e-04 | 1.20e-03 | 6.12e-04 | 88 |
| hsa0124021 | Oral cavity | LP | Biosynthesis of cofactors | 57/2418 | 153/8465 | 1.17e-02 | 3.91e-02 | 2.52e-02 | 57 |
| hsa0124031 | Oral cavity | LP | Biosynthesis of cofactors | 57/2418 | 153/8465 | 1.17e-02 | 3.91e-02 | 2.52e-02 | 57 |
| Page: 1 |
Top |
Cell-cell communication analysis |
| Identification of potential cell-cell interactions between two cell types and their ligand-receptor pairs for different disease states |
| Ligand | Receptor | LRpair | Pathway | Tissue | Disease Stage |
| Page: 1 |
Top |
Single-cell gene regulatory network inference analysis |
| Find out the significant the regulons (TFs) and the target genes of each regulon across cell types for different disease states |
| TF | Cell Type | Tissue | Disease Stage | Target Gene | RSS | Regulon Activity |
| ∗The dot plots of a searched regulon are shown for all cell subpopulations in each disease state of each tissue based on the regulon specific score inferred using pySCENIC and by calculating the average expression. |
| Page: 1 |
Top |
Somatic mutation of malignant transformation related genes |
| Annotation of somatic variants for genes involved in malignant transformation |
| Hugo Symbol | Variant Class | Variant Classification | dbSNP RS | HGVSc | HGVSp | HGVSp Short | SWISSPROT | BIOTYPE | SIFT | PolyPhen | Tumor Sample Barcode | Tissue | Histology | Sex | Age | Stage | Therapy Types | Drugs | Outcome |
| UROS | SNV | Missense_Mutation | rs121908015 | c.10N>T | p.Leu4Phe | p.L4F | P10746 | protein_coding | deleterious(0) | probably_damaging(0.991) | TCGA-B6-A0X1-01 | Breast | breast invasive carcinoma | Female | <65 | I/II | Unknown | Unknown | PD |
| UROS | SNV | Missense_Mutation | rs145856015 | c.461C>T | p.Ala154Val | p.A154V | P10746 | protein_coding | tolerated(1) | benign(0.005) | TCGA-2W-A8YY-01 | Cervix | cervical & endocervical cancer | Female | <65 | I/II | Chemotherapy | cisplatin | CR |
| UROS | SNV | Missense_Mutation | novel | c.127N>G | p.Leu43Val | p.L43V | P10746 | protein_coding | deleterious(0) | probably_damaging(0.979) | TCGA-HM-A4S6-01 | Cervix | cervical & endocervical cancer | Female | <65 | III/IV | Chemotherapy | cisplatin | CR |
| UROS | SNV | Missense_Mutation | novel | c.160G>C | p.Glu54Gln | p.E54Q | P10746 | protein_coding | deleterious(0) | probably_damaging(0.956) | TCGA-JW-A5VL-01 | Cervix | cervical & endocervical cancer | Female | <65 | I/II | Unknown | Unknown | SD |
| UROS | SNV | Missense_Mutation | novel | c.793N>C | p.Cys265Arg | p.C265R | P10746 | protein_coding | deleterious_low_confidence(0) | benign(0.202) | TCGA-CA-5254-01 | Colorectum | colon adenocarcinoma | Female | <65 | I/II | Chemotherapy | oxaliplatin | CR |
| UROS | SNV | Missense_Mutation | rs755224381 | c.514G>A | p.Ala172Thr | p.A172T | P10746 | protein_coding | tolerated(0.15) | benign(0.048) | TCGA-D5-6540-01 | Colorectum | colon adenocarcinoma | Male | >=65 | I/II | Unknown | Unknown | SD |
| UROS | SNV | Missense_Mutation | c.123N>T | p.Leu41Phe | p.L41F | P10746 | protein_coding | tolerated(0.07) | benign(0.315) | TCGA-DY-A1H8-01 | Colorectum | rectum adenocarcinoma | Female | >=65 | III/IV | Unknown | Unknown | SD | |
| UROS | SNV | Missense_Mutation | c.10C>A | p.Leu4Ile | p.L4I | P10746 | protein_coding | tolerated(0.09) | probably_damaging(0.916) | TCGA-F5-6814-01 | Colorectum | rectum adenocarcinoma | Male | <65 | I/II | Unknown | Unknown | SD | |
| UROS | deletion | Frame_Shift_Del | c.588delN | p.Phe196LeufsTer44 | p.F196Lfs*44 | P10746 | protein_coding | TCGA-AA-3492-01 | Colorectum | colon adenocarcinoma | Female | >=65 | I/II | Unknown | Unknown | SD | |||
| UROS | deletion | Frame_Shift_Del | c.588delN | p.Phe196LeufsTer44 | p.F196Lfs*44 | P10746 | protein_coding | TCGA-AA-3715-01 | Colorectum | colon adenocarcinoma | Male | >=65 | I/II | Unknown | Unknown | PD |
| Page: 1 2 3 4 |
Top |
Related drugs of malignant transformation related genes |
| Identification of chemicals and drugs interact with genes involved in malignant transfromation |
| (DGIdb 4.0) |
| Entrez ID | Symbol | Category | Interaction Types | Drug Claim Name | Drug Name | PMIDs |
| Page: 1 |

Copyright 2023-Present -The University of Texas Health Science Center at Houston |