
|
|||||
|
 | |
| |
| |
| |
| |
| |
|
Gene: URGCP |
Gene summary for URGCP |
| Gene information | Species | Human | Gene symbol | URGCP | Gene ID | 55665 |
| Gene name | upregulator of cell proliferation | |
| Gene Alias | URG4 | |
| Cytomap | 7p13 | |
| Gene Type | protein-coding | GO ID | GO:0007049 | UniProtAcc | Q8TCY9 |
Top |
Malignant transformation analysis |
| Identification of the aberrant gene expression in precancerous and cancerous lesions by comparing the gene expression of stem-like cells in diseased tissues with normal stem cells |
| Entrez ID | Symbol | Replicates | Species | Organ | Tissue | Adj P-value | Log2FC | Malignancy |
| 55665 | URGCP | P91T-E | Human | Esophagus | ESCC | 3.33e-05 | 4.91e-01 | 0.1828 |
| 55665 | URGCP | P107T-E | Human | Esophagus | ESCC | 8.19e-12 | 2.41e-01 | 0.171 |
| 55665 | URGCP | P127T-E | Human | Esophagus | ESCC | 2.28e-12 | 1.35e-01 | 0.0826 |
| 55665 | URGCP | P128T-E | Human | Esophagus | ESCC | 4.45e-06 | 2.73e-01 | 0.1241 |
| 55665 | URGCP | P130T-E | Human | Esophagus | ESCC | 7.54e-35 | 7.09e-01 | 0.1676 |
| 55665 | URGCP | HCC1_Meng | Human | Liver | HCC | 6.09e-22 | -4.01e-02 | 0.0246 |
| 55665 | URGCP | HCC2_Meng | Human | Liver | HCC | 8.87e-07 | 1.08e-02 | 0.0107 |
| 55665 | URGCP | S014 | Human | Liver | HCC | 2.98e-08 | 4.80e-01 | 0.2254 |
| 55665 | URGCP | S027 | Human | Liver | HCC | 1.68e-05 | 7.34e-01 | 0.2446 |
| 55665 | URGCP | S028 | Human | Liver | HCC | 3.25e-12 | 7.45e-01 | 0.2503 |
| 55665 | URGCP | S029 | Human | Liver | HCC | 1.29e-12 | 6.54e-01 | 0.2581 |
| 55665 | URGCP | RNA-P17T-P17T-2 | Human | Lung | IAC | 4.44e-02 | 5.13e-01 | 0.3371 |
| 55665 | URGCP | RNA-P17T-P17T-4 | Human | Lung | IAC | 1.93e-02 | 4.36e-01 | 0.343 |
| 55665 | URGCP | RNA-P17T-P17T-6 | Human | Lung | IAC | 3.05e-02 | 5.37e-01 | 0.3385 |
| 55665 | URGCP | RNA-P25T1-P25T1-4 | Human | Lung | AIS | 1.94e-03 | 2.91e-01 | -0.2119 |
| 55665 | URGCP | RNA-P6T2-P6T2-1 | Human | Lung | IAC | 1.64e-09 | 3.81e-01 | -0.0166 |
| 55665 | URGCP | RNA-P6T2-P6T2-2 | Human | Lung | IAC | 1.43e-21 | 6.50e-01 | -0.0132 |
| 55665 | URGCP | RNA-P6T2-P6T2-3 | Human | Lung | IAC | 1.08e-19 | 5.30e-01 | -0.013 |
| 55665 | URGCP | RNA-P6T2-P6T2-4 | Human | Lung | IAC | 6.74e-14 | 5.13e-01 | -0.0121 |
| Page: 1 2 3 4 5 |
| Tissue | Expression Dynamics | Abbreviation |
| Colorectum (GSE201348) |  | FAP: Familial adenomatous polyposis |
| CRC: Colorectal cancer | ||
| Colorectum (HTA11) |  | AD: Adenomas |
| SER: Sessile serrated lesions | ||
| MSI-H: Microsatellite-high colorectal cancer | ||
| MSS: Microsatellite stable colorectal cancer | ||
| Esophagus | 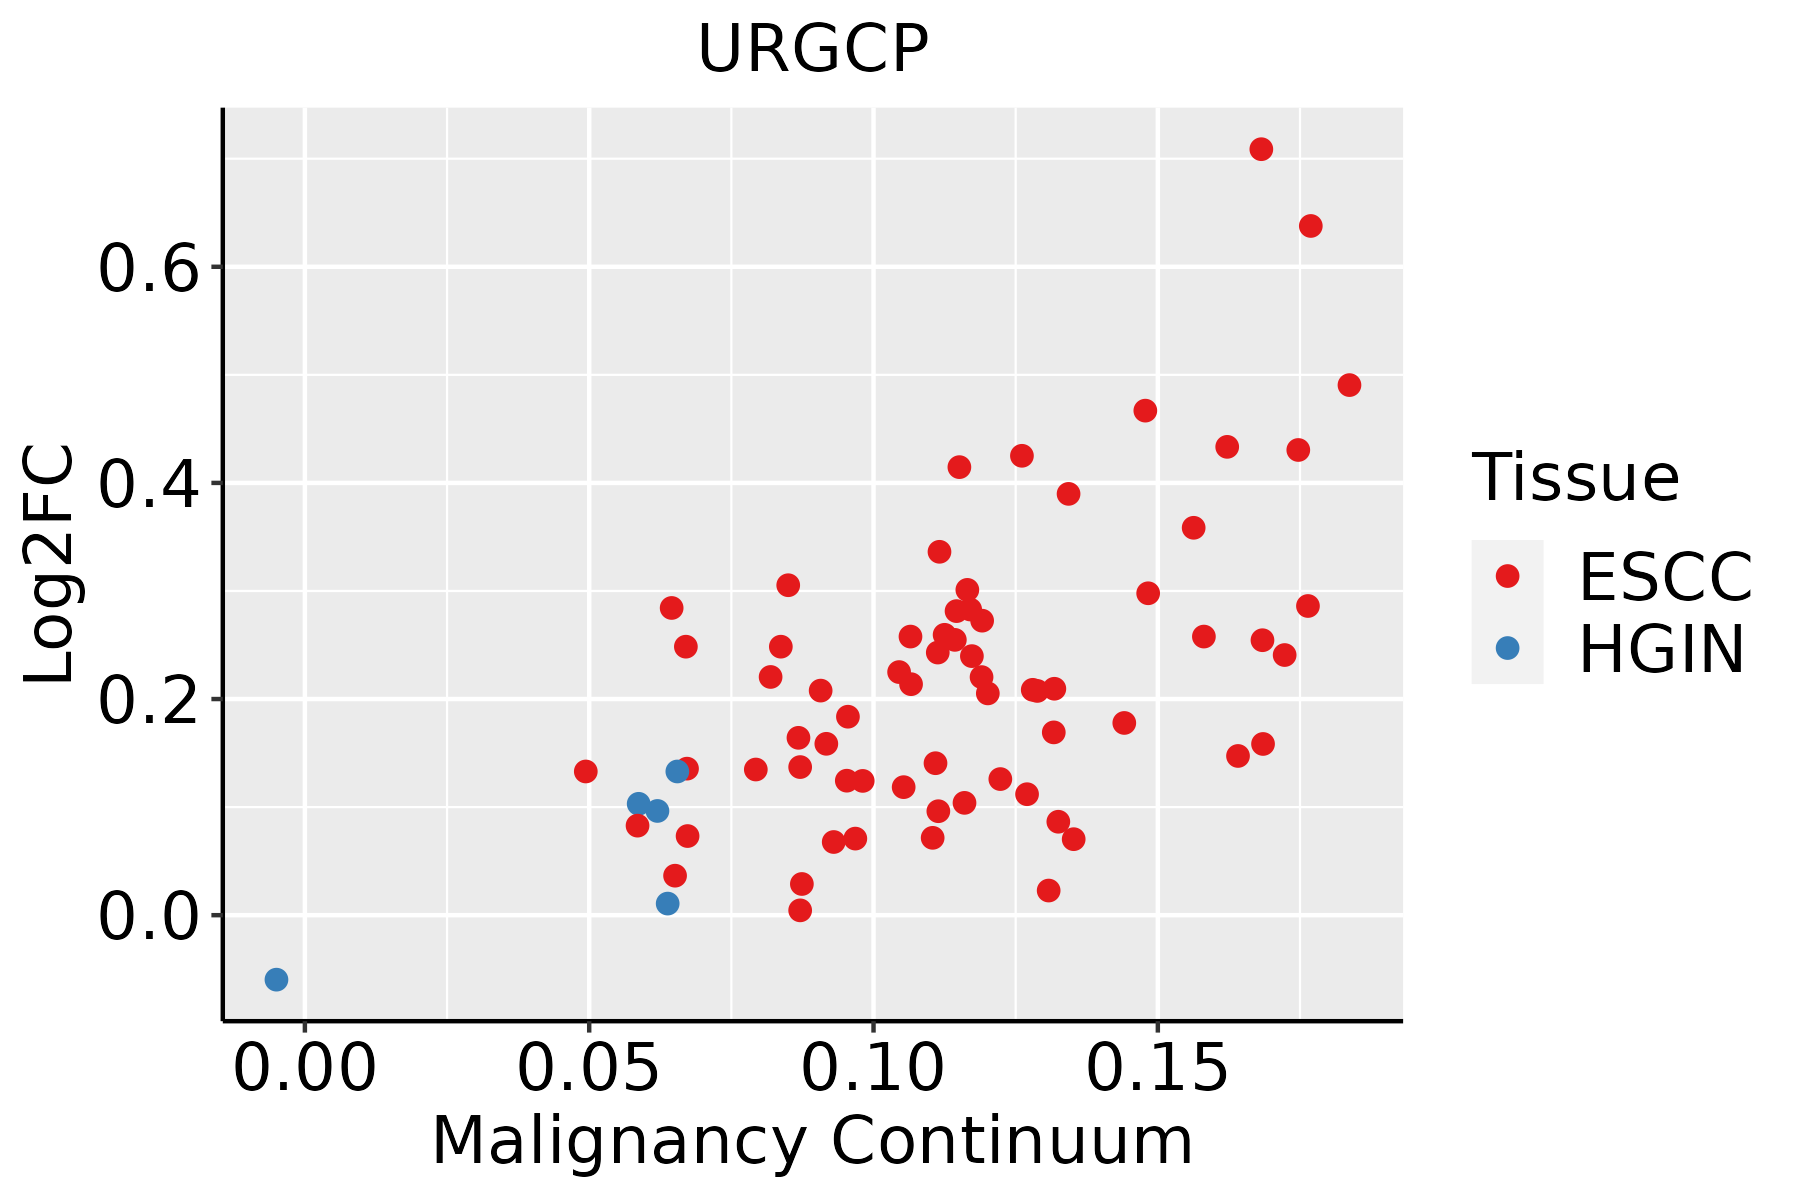 | ESCC: Esophageal squamous cell carcinoma |
| HGIN: High-grade intraepithelial neoplasias | ||
| LGIN: Low-grade intraepithelial neoplasias | ||
| Liver |  | HCC: Hepatocellular carcinoma |
| NAFLD: Non-alcoholic fatty liver disease | ||
| Lung | 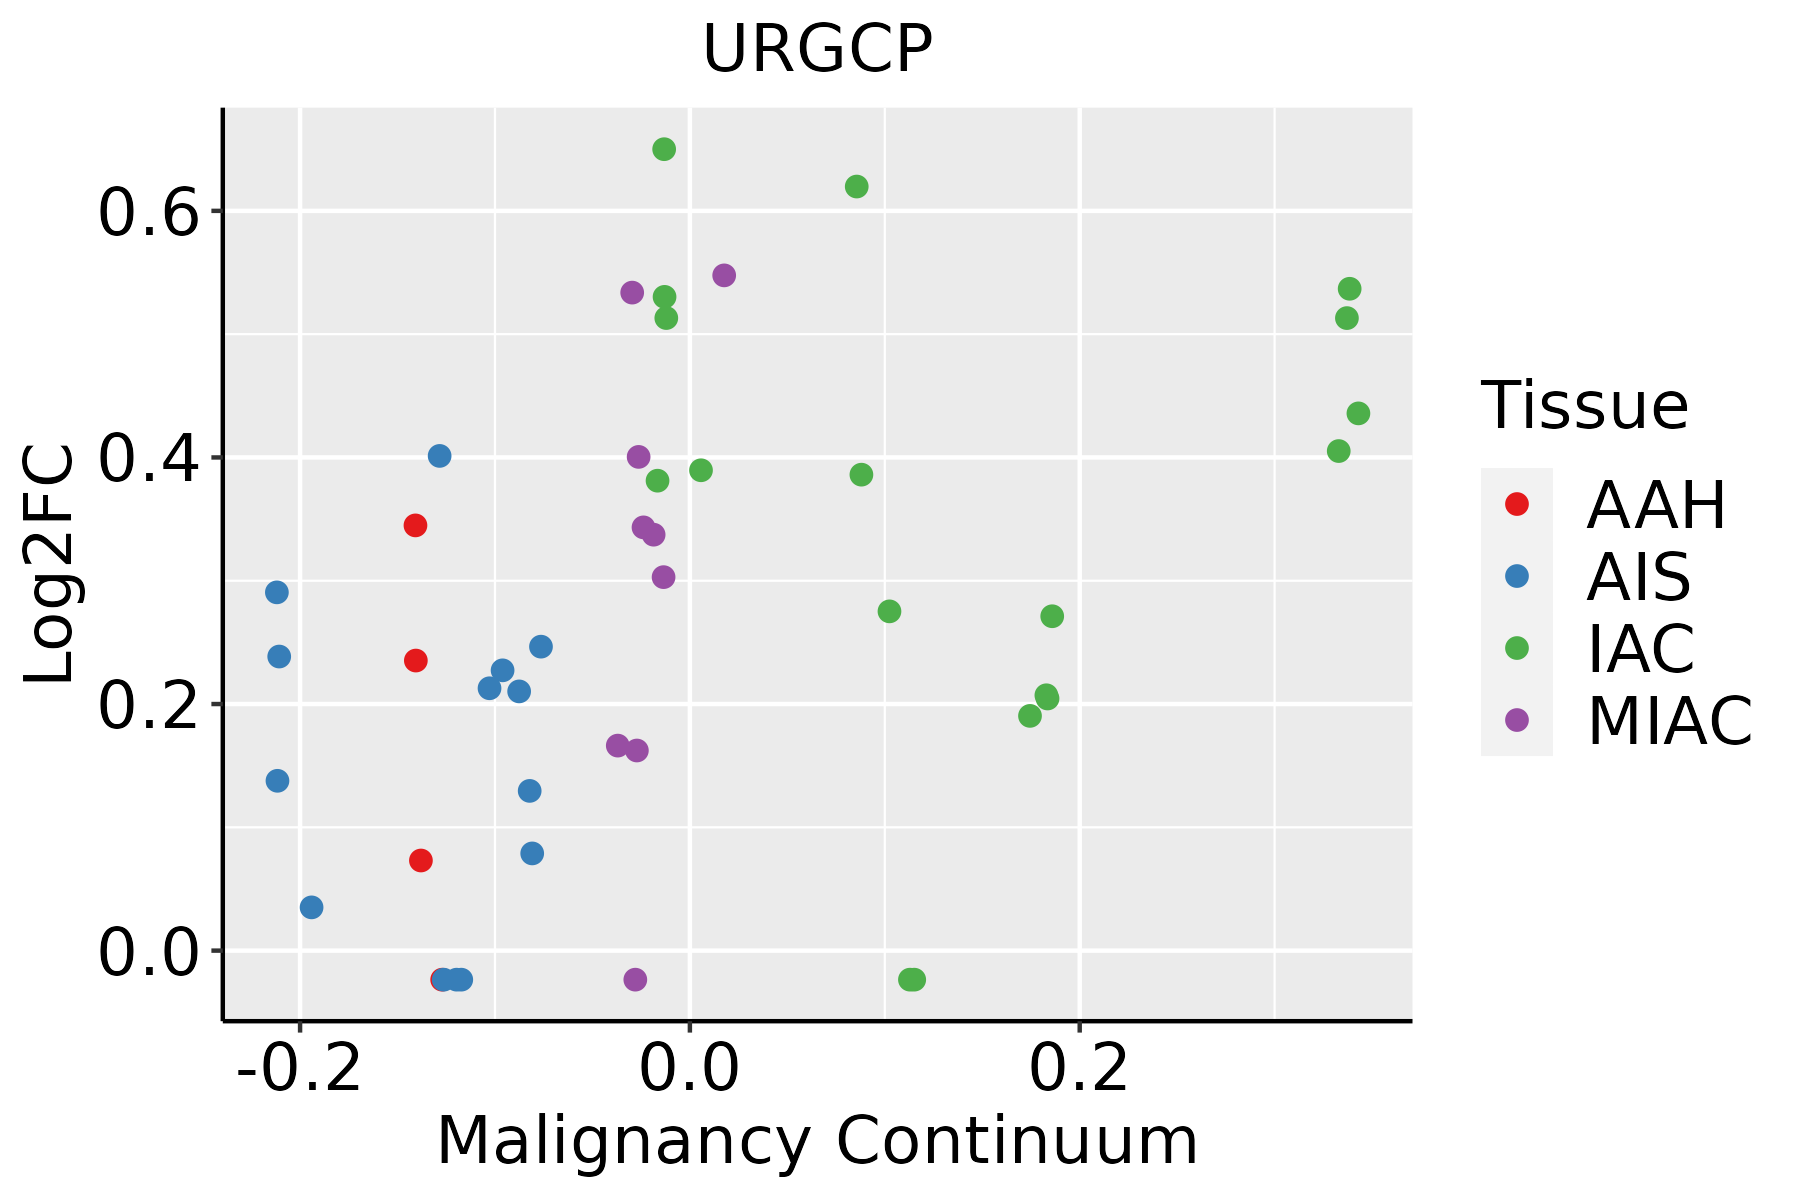 | AAH: Atypical adenomatous hyperplasia |
| AIS: Adenocarcinoma in situ | ||
| IAC: Invasive lung adenocarcinoma | ||
| MIA: Minimally invasive adenocarcinoma |
| ∗log2FC in expression of this searched gene in stem-like cells from each diseased tissue sample relative to stem-like cells in normal samples in each tissue plotted against the malignancy continuum. Samples are colored based on if they are from different disease stage. |
Top |
Malignant transformation related pathway analysis |
| Find out the enriched GO biological processes and KEGG pathways involved in transition from healthy to precancer to cancer |
| Tissue | Disease Stage | Enriched GO biological Processes |
| Colorectum | AD |  |
| Colorectum | SER |  |
| Colorectum | MSS |  |
| Colorectum | MSI-H |  |
| Colorectum | FAP |  |
| ∗Top 15 enriched GO BP terms are showed in the bar plot of each disease state in each tissue. Each row represents a significant GO biological process which is colored according to the -log10(p.adjust). |
| Page: 1 2 3 4 5 6 7 8 9 |
| GO ID | Tissue | Disease Stage | Description | Gene Ratio | Bg Ratio | pvalue | p.adjust | Count |
| Page: 1 |
| Pathway ID | Tissue | Disease Stage | Description | Gene Ratio | Bg Ratio | pvalue | p.adjust | qvalue | Count |
| Page: 1 |
Top |
Cell-cell communication analysis |
| Identification of potential cell-cell interactions between two cell types and their ligand-receptor pairs for different disease states |
| Ligand | Receptor | LRpair | Pathway | Tissue | Disease Stage |
| Page: 1 |
Top |
Single-cell gene regulatory network inference analysis |
| Find out the significant the regulons (TFs) and the target genes of each regulon across cell types for different disease states |
| TF | Cell Type | Tissue | Disease Stage | Target Gene | RSS | Regulon Activity |
| ∗The dot plots of a searched regulon are shown for all cell subpopulations in each disease state of each tissue based on the regulon specific score inferred using pySCENIC and by calculating the average expression. |
| Page: 1 |
Top |
Somatic mutation of malignant transformation related genes |
| Annotation of somatic variants for genes involved in malignant transformation |
| Hugo Symbol | Variant Class | Variant Classification | dbSNP RS | HGVSc | HGVSp | HGVSp Short | SWISSPROT | BIOTYPE | SIFT | PolyPhen | Tumor Sample Barcode | Tissue | Histology | Sex | Age | Stage | Therapy Types | Drugs | Outcome |
| URGCP | SNV | Missense_Mutation | c.2386N>G | p.Pro796Ala | p.P796A | Q8TCY9 | protein_coding | deleterious(0.04) | benign(0.318) | TCGA-A1-A0SI-01 | Breast | breast invasive carcinoma | Female | <65 | I/II | Unknown | Unknown | SD | |
| URGCP | SNV | Missense_Mutation | c.1006N>T | p.Asn336Tyr | p.N336Y | Q8TCY9 | protein_coding | deleterious(0) | probably_damaging(1) | TCGA-A1-A0SO-01 | Breast | breast invasive carcinoma | Female | >=65 | I/II | Chemotherapy | SD | ||
| URGCP | SNV | Missense_Mutation | novel | c.1449C>G | p.Ile483Met | p.I483M | Q8TCY9 | protein_coding | deleterious(0.01) | probably_damaging(0.935) | TCGA-A7-A56D-01 | Breast | breast invasive carcinoma | Female | >=65 | I/II | Hormone Therapy | arimidex | SD |
| URGCP | SNV | Missense_Mutation | novel | c.799C>T | p.Arg267Cys | p.R267C | Q8TCY9 | protein_coding | deleterious(0) | probably_damaging(0.995) | TCGA-A7-A56D-01 | Breast | breast invasive carcinoma | Female | >=65 | I/II | Hormone Therapy | arimidex | SD |
| URGCP | SNV | Missense_Mutation | novel | c.509C>A | p.Ser170Tyr | p.S170Y | Q8TCY9 | protein_coding | deleterious(0.04) | probably_damaging(0.924) | TCGA-A7-A56D-01 | Breast | breast invasive carcinoma | Female | >=65 | I/II | Hormone Therapy | arimidex | SD |
| URGCP | SNV | Missense_Mutation | c.1873N>A | p.Glu625Lys | p.E625K | Q8TCY9 | protein_coding | deleterious(0) | probably_damaging(0.993) | TCGA-AC-A23H-01 | Breast | breast invasive carcinoma | Female | >=65 | I/II | Unknown | Unknown | PD | |
| URGCP | SNV | Missense_Mutation | c.1350N>A | p.Asp450Glu | p.D450E | Q8TCY9 | protein_coding | tolerated(0.4) | benign(0.005) | TCGA-AO-A03T-01 | Breast | breast invasive carcinoma | Female | <65 | I/II | Chemotherapy | cyclophosphamide | SD | |
| URGCP | SNV | Missense_Mutation | c.2689G>A | p.Glu897Lys | p.E897K | Q8TCY9 | protein_coding | deleterious(0.04) | possibly_damaging(0.536) | TCGA-C8-A273-01 | Breast | breast invasive carcinoma | Female | <65 | I/II | Hormone Therapy | tamoxiphen | SD | |
| URGCP | SNV | Missense_Mutation | c.2689N>A | p.Glu897Lys | p.E897K | Q8TCY9 | protein_coding | deleterious(0.04) | possibly_damaging(0.536) | TCGA-D8-A1JA-01 | Breast | breast invasive carcinoma | Female | <65 | III/IV | Chemotherapy | adriamycin | PD | |
| URGCP | SNV | Missense_Mutation | c.2452N>C | p.Val818Leu | p.V818L | Q8TCY9 | protein_coding | deleterious(0.02) | possibly_damaging(0.705) | TCGA-C5-A1BQ-01 | Cervix | cervical & endocervical cancer | Female | >=65 | III/IV | Chemotherapy | cisplatin | CR |
| Page: 1 2 3 4 5 6 7 8 9 10 11 |
Top |
Related drugs of malignant transformation related genes |
| Identification of chemicals and drugs interact with genes involved in malignant transfromation |
| (DGIdb 4.0) |
| Entrez ID | Symbol | Category | Interaction Types | Drug Claim Name | Drug Name | PMIDs |
| Page: 1 |

Copyright 2023-Present -The University of Texas Health Science Center at Houston |