
|
|||||
|
 | |
| |
| |
| |
| |
| |
|
Gene: UIMC1 |
Gene summary for UIMC1 |
| Gene information | Species | Human | Gene symbol | UIMC1 | Gene ID | 51720 |
| Gene name | ubiquitin interaction motif containing 1 | |
| Gene Alias | RAP80 | |
| Cytomap | 5q35.2 | |
| Gene Type | protein-coding | GO ID | GO:0000075 | UniProtAcc | A0A024R7R0 |
Top |
Malignant transformation analysis |
| Identification of the aberrant gene expression in precancerous and cancerous lesions by comparing the gene expression of stem-like cells in diseased tissues with normal stem cells |
| Entrez ID | Symbol | Replicates | Species | Organ | Tissue | Adj P-value | Log2FC | Malignancy |
| 51720 | UIMC1 | P89T-E | Human | Esophagus | ESCC | 4.85e-22 | 9.78e-01 | 0.1752 |
| 51720 | UIMC1 | P91T-E | Human | Esophagus | ESCC | 1.21e-09 | 7.56e-01 | 0.1828 |
| 51720 | UIMC1 | P104T-E | Human | Esophagus | ESCC | 2.27e-04 | 2.01e-01 | 0.0931 |
| 51720 | UIMC1 | P107T-E | Human | Esophagus | ESCC | 5.51e-57 | 1.25e+00 | 0.171 |
| 51720 | UIMC1 | P126T-E | Human | Esophagus | ESCC | 2.82e-06 | 5.54e-01 | 0.1125 |
| 51720 | UIMC1 | P127T-E | Human | Esophagus | ESCC | 4.39e-04 | 1.78e-02 | 0.0826 |
| 51720 | UIMC1 | P128T-E | Human | Esophagus | ESCC | 5.26e-06 | 1.23e-01 | 0.1241 |
| 51720 | UIMC1 | P130T-E | Human | Esophagus | ESCC | 6.06e-18 | 3.01e-01 | 0.1676 |
| 51720 | UIMC1 | C04 | Human | Oral cavity | OSCC | 4.19e-03 | 3.46e-01 | 0.2633 |
| 51720 | UIMC1 | C21 | Human | Oral cavity | OSCC | 2.10e-10 | 4.48e-01 | 0.2678 |
| 51720 | UIMC1 | C30 | Human | Oral cavity | OSCC | 4.15e-09 | 5.45e-01 | 0.3055 |
| 51720 | UIMC1 | C43 | Human | Oral cavity | OSCC | 1.18e-10 | 2.62e-01 | 0.1704 |
| 51720 | UIMC1 | C46 | Human | Oral cavity | OSCC | 4.27e-06 | 1.95e-01 | 0.1673 |
| 51720 | UIMC1 | C08 | Human | Oral cavity | OSCC | 1.42e-12 | 3.86e-01 | 0.1919 |
| 51720 | UIMC1 | LN46 | Human | Oral cavity | OSCC | 1.31e-04 | 1.60e-01 | 0.1666 |
| 51720 | UIMC1 | LP15 | Human | Oral cavity | LP | 2.04e-03 | 7.88e-01 | 0.2174 |
| 51720 | UIMC1 | EOLP-1 | Human | Oral cavity | EOLP | 5.35e-06 | 1.89e-01 | -0.0202 |
| 51720 | UIMC1 | SYSMH2 | Human | Oral cavity | OSCC | 6.56e-03 | 2.00e-01 | 0.2326 |
| 51720 | UIMC1 | SYSMH3 | Human | Oral cavity | OSCC | 1.59e-03 | 1.60e-01 | 0.2442 |
| 51720 | UIMC1 | male-WTA | Human | Thyroid | PTC | 6.49e-08 | 7.50e-02 | 0.1037 |
| Page: 1 2 3 4 5 6 |
| Tissue | Expression Dynamics | Abbreviation |
| Colorectum (GSE201348) |  | FAP: Familial adenomatous polyposis |
| CRC: Colorectal cancer | ||
| Colorectum (HTA11) |  | AD: Adenomas |
| SER: Sessile serrated lesions | ||
| MSI-H: Microsatellite-high colorectal cancer | ||
| MSS: Microsatellite stable colorectal cancer | ||
| Esophagus | 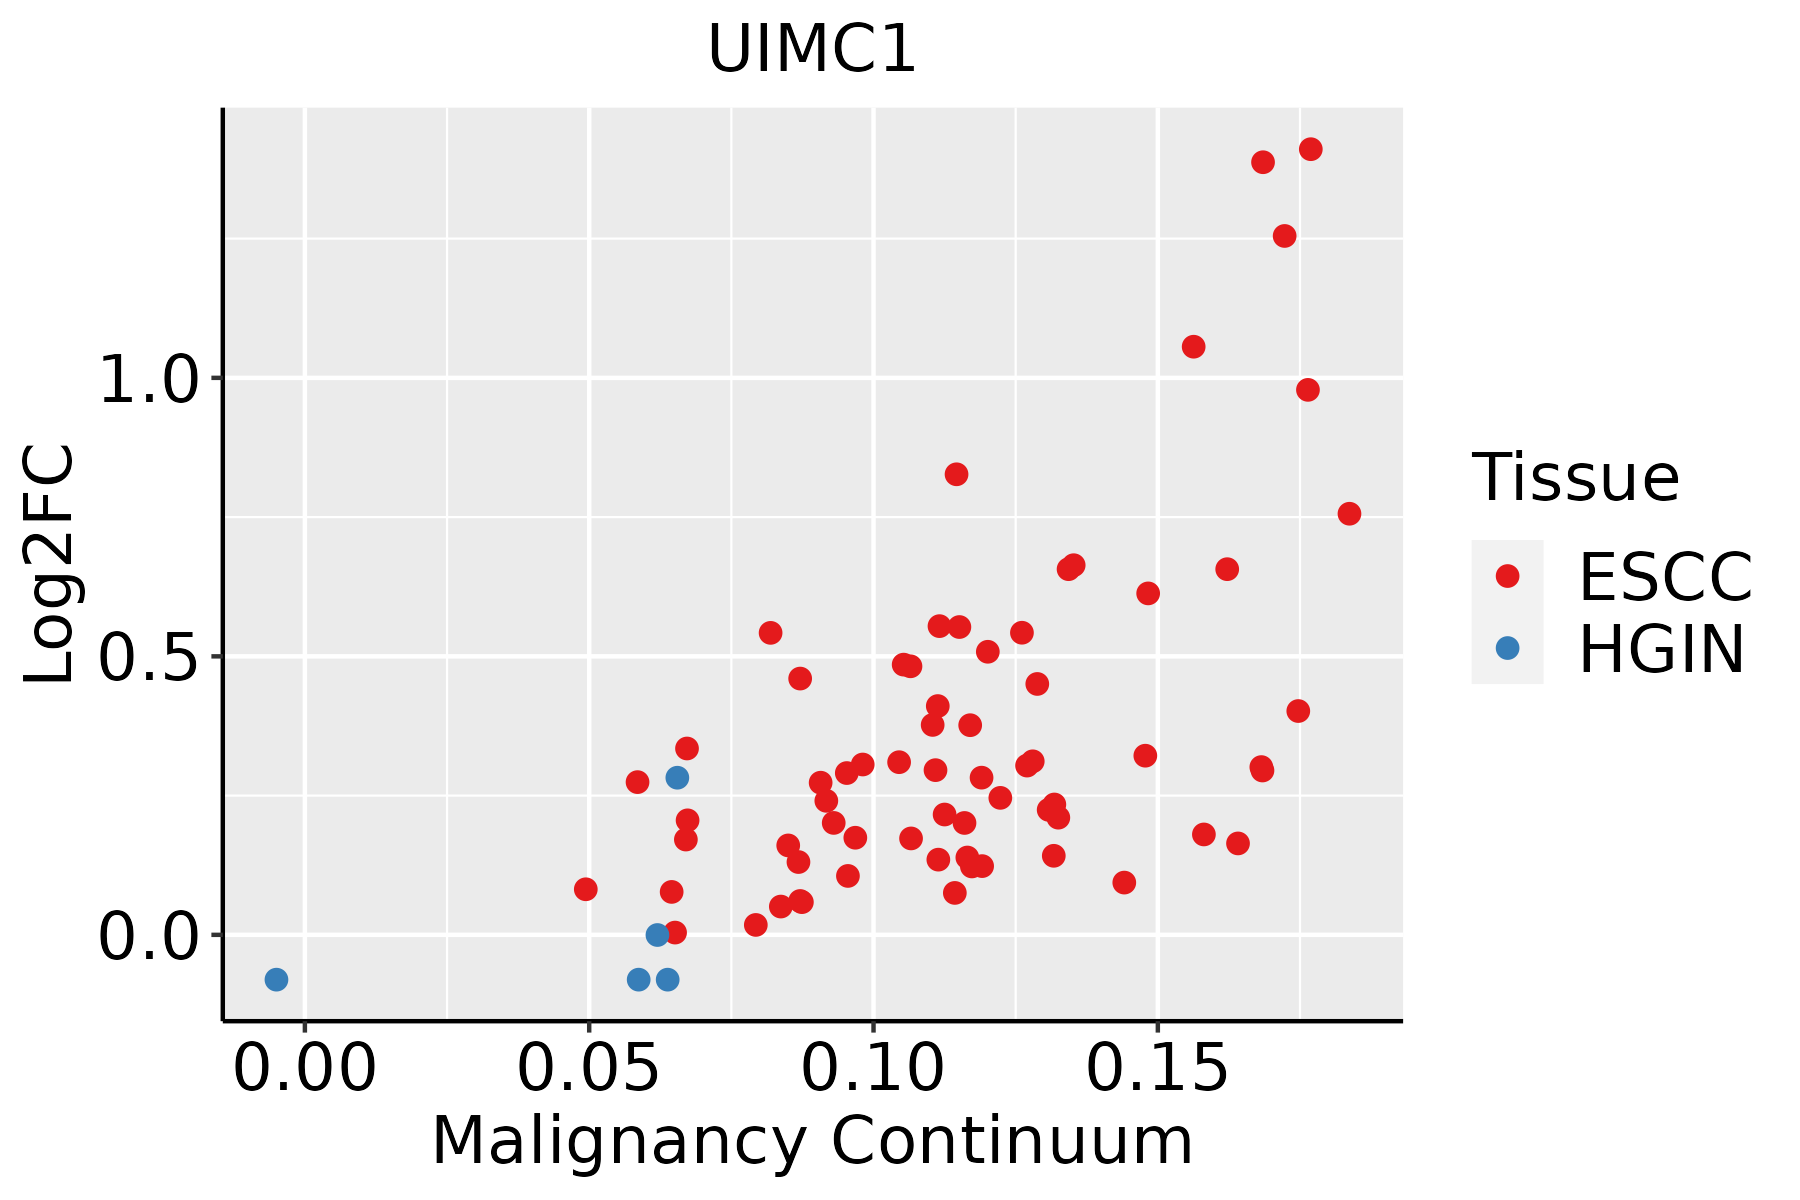 | ESCC: Esophageal squamous cell carcinoma |
| HGIN: High-grade intraepithelial neoplasias | ||
| LGIN: Low-grade intraepithelial neoplasias | ||
| Oral Cavity | 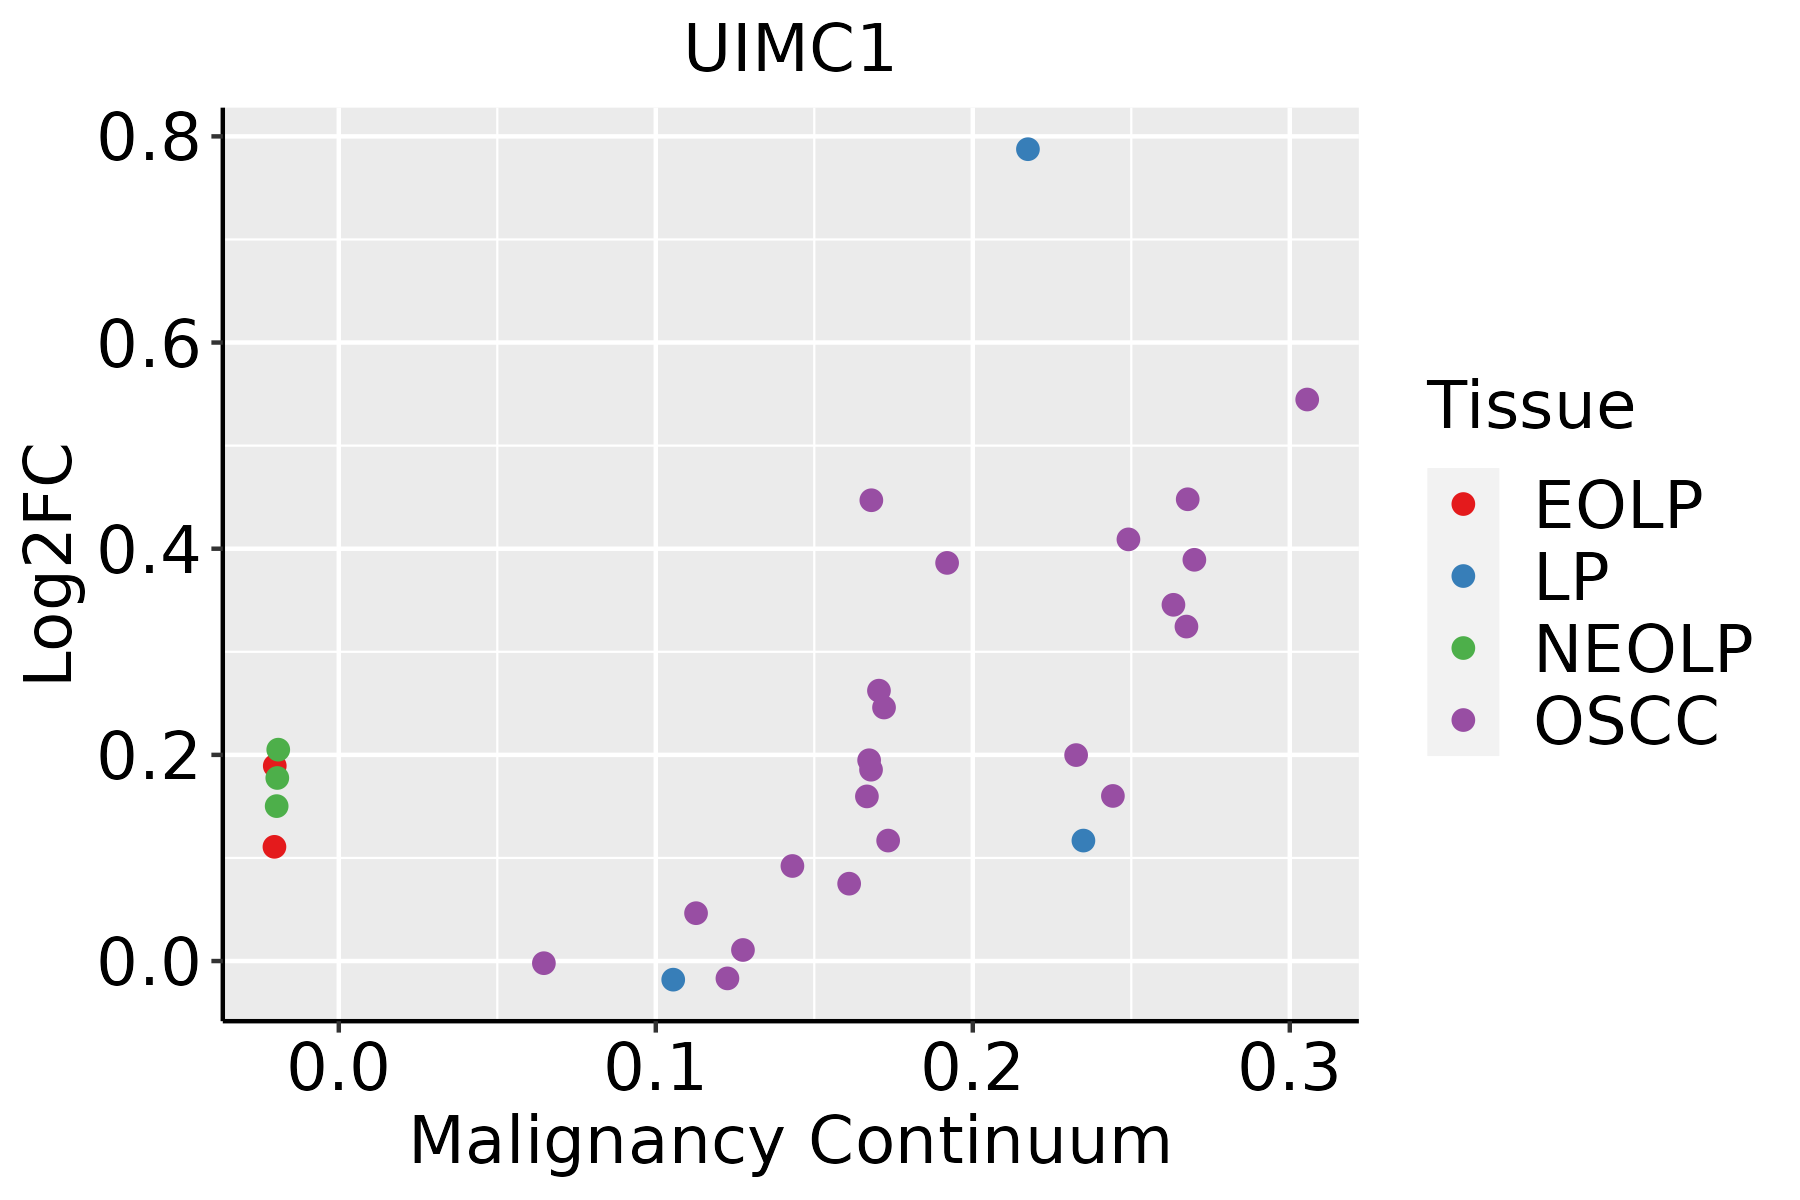 | EOLP: Erosive Oral lichen planus |
| LP: leukoplakia | ||
| NEOLP: Non-erosive oral lichen planus | ||
| OSCC: Oral squamous cell carcinoma | ||
| Thyroid | 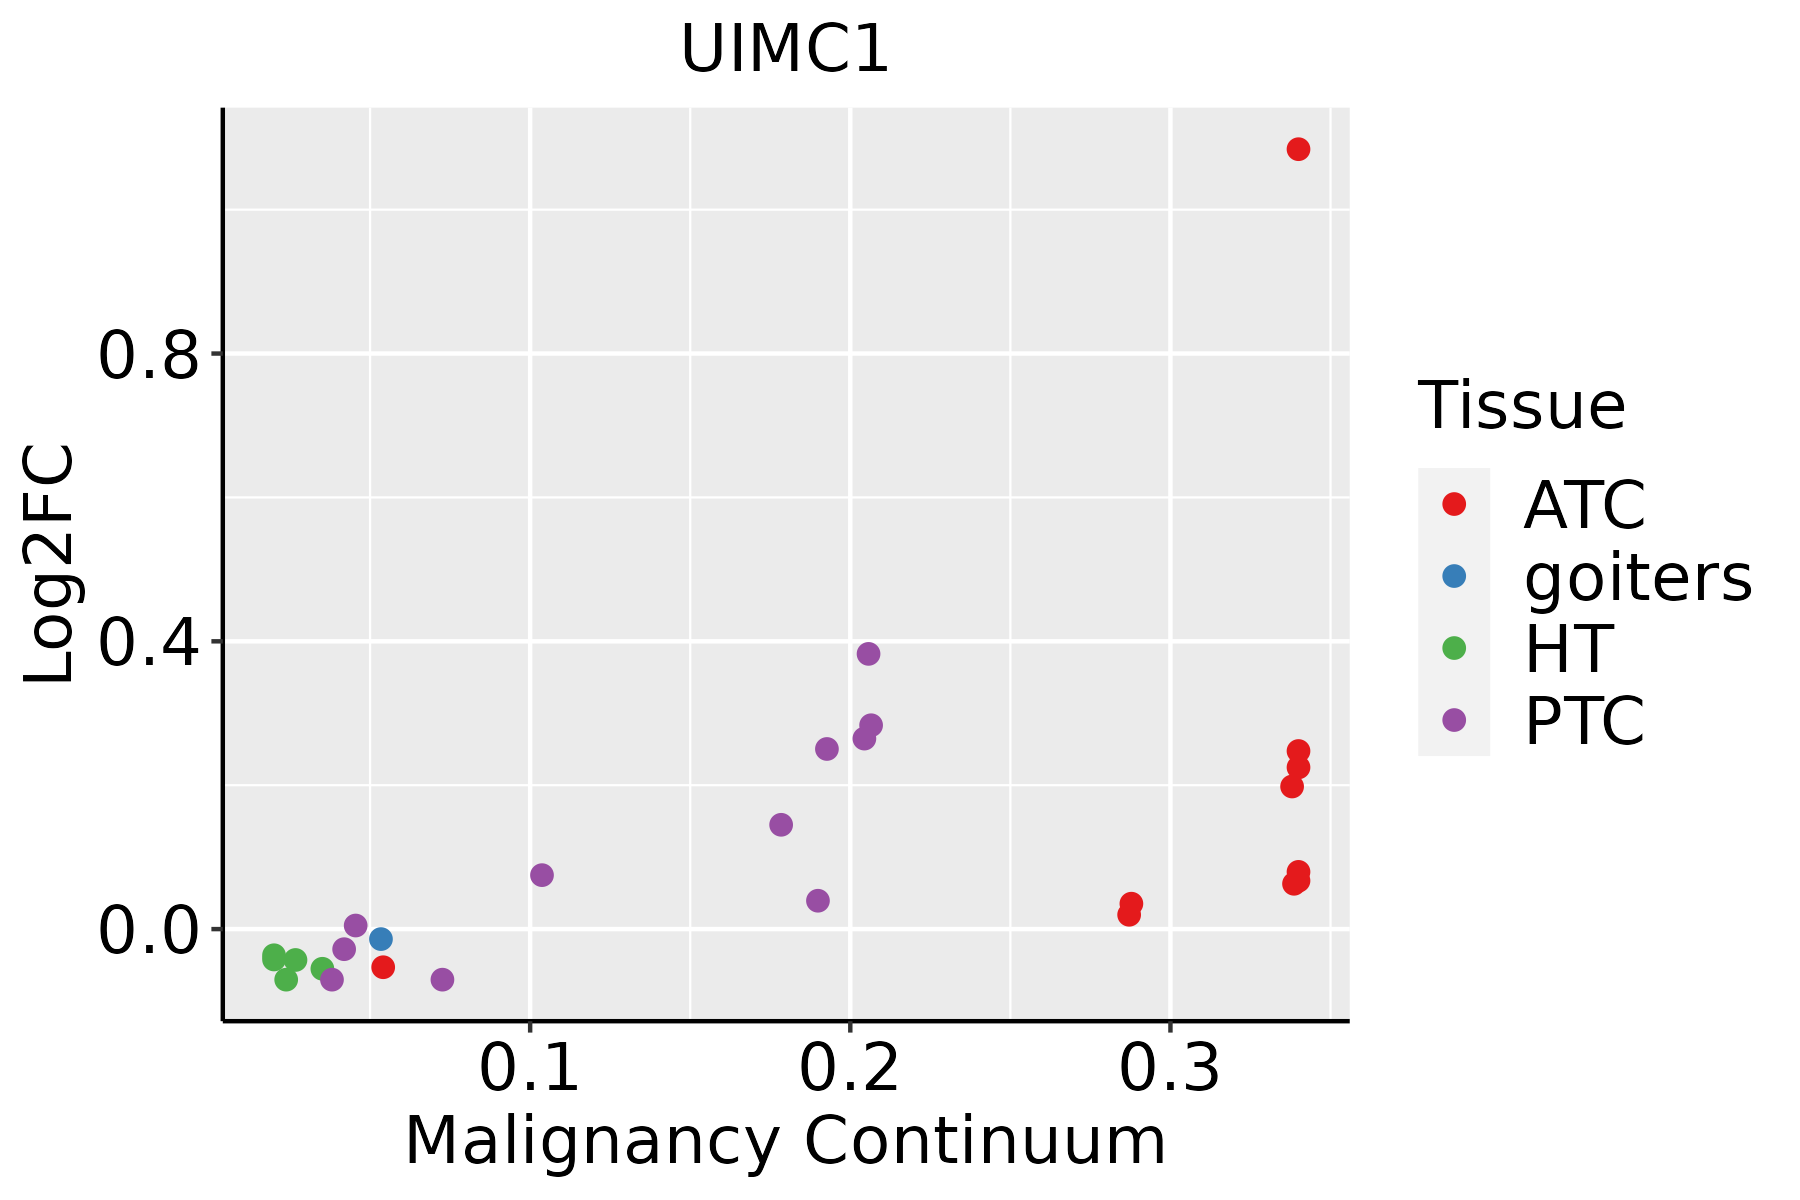 | ATC: Anaplastic thyroid cancer |
| HT: Hashimoto's thyroiditis | ||
| PTC: Papillary thyroid cancer |
| ∗log2FC in expression of this searched gene in stem-like cells from each diseased tissue sample relative to stem-like cells in normal samples in each tissue plotted against the malignancy continuum. Samples are colored based on if they are from different disease stage. |
Top |
Malignant transformation related pathway analysis |
| Find out the enriched GO biological processes and KEGG pathways involved in transition from healthy to precancer to cancer |
| Tissue | Disease Stage | Enriched GO biological Processes |
| Colorectum | AD |  |
| Colorectum | SER |  |
| Colorectum | MSS |  |
| Colorectum | MSI-H |  |
| Colorectum | FAP |  |
| ∗Top 15 enriched GO BP terms are showed in the bar plot of each disease state in each tissue. Each row represents a significant GO biological process which is colored according to the -log10(p.adjust). |
| Page: 1 2 3 4 5 6 7 8 9 |
| GO ID | Tissue | Disease Stage | Description | Gene Ratio | Bg Ratio | pvalue | p.adjust | Count |
| GO:0051052 | Colorectum | AD | regulation of DNA metabolic process | 116/3918 | 359/18723 | 2.47e-07 | 1.00e-05 | 116 |
| GO:0051054 | Colorectum | AD | positive regulation of DNA metabolic process | 73/3918 | 201/18723 | 3.27e-07 | 1.29e-05 | 73 |
| GO:2001020 | Colorectum | AD | regulation of response to DNA damage stimulus | 71/3918 | 219/18723 | 4.38e-05 | 7.65e-04 | 71 |
| GO:2001022 | Colorectum | AD | positive regulation of response to DNA damage stimulus | 36/3918 | 105/18723 | 1.02e-03 | 9.47e-03 | 36 |
| GO:0006282 | Colorectum | AD | regulation of DNA repair | 42/3918 | 130/18723 | 1.57e-03 | 1.32e-02 | 42 |
| GO:0007346 | Colorectum | AD | regulation of mitotic cell cycle | 119/3918 | 457/18723 | 4.60e-03 | 3.14e-02 | 119 |
| GO:00510522 | Colorectum | MSS | regulation of DNA metabolic process | 108/3467 | 359/18723 | 5.86e-08 | 3.10e-06 | 108 |
| GO:00510542 | Colorectum | MSS | positive regulation of DNA metabolic process | 69/3467 | 201/18723 | 6.33e-08 | 3.26e-06 | 69 |
| GO:20010202 | Colorectum | MSS | regulation of response to DNA damage stimulus | 64/3467 | 219/18723 | 7.20e-05 | 1.21e-03 | 64 |
| GO:0016570 | Colorectum | MSS | histone modification | 113/3467 | 463/18723 | 8.37e-04 | 8.68e-03 | 113 |
| GO:20010221 | Colorectum | MSS | positive regulation of response to DNA damage stimulus | 33/3467 | 105/18723 | 9.83e-04 | 9.86e-03 | 33 |
| GO:00062821 | Colorectum | MSS | regulation of DNA repair | 38/3467 | 130/18723 | 1.93e-03 | 1.67e-02 | 38 |
| GO:00073461 | Colorectum | MSS | regulation of mitotic cell cycle | 108/3467 | 457/18723 | 3.30e-03 | 2.50e-02 | 108 |
| GO:0006302 | Colorectum | MSS | double-strand break repair | 64/3467 | 251/18723 | 3.58e-03 | 2.65e-02 | 64 |
| GO:0045739 | Colorectum | MSS | positive regulation of DNA repair | 23/3467 | 73/18723 | 5.22e-03 | 3.57e-02 | 23 |
| GO:00510524 | Colorectum | FAP | regulation of DNA metabolic process | 84/2622 | 359/18723 | 9.80e-07 | 4.38e-05 | 84 |
| GO:00510544 | Colorectum | FAP | positive regulation of DNA metabolic process | 53/2622 | 201/18723 | 2.55e-06 | 9.82e-05 | 53 |
| GO:00165701 | Colorectum | FAP | histone modification | 94/2622 | 463/18723 | 1.06e-04 | 1.76e-03 | 94 |
| GO:20010204 | Colorectum | FAP | regulation of response to DNA damage stimulus | 51/2622 | 219/18723 | 1.40e-04 | 2.21e-03 | 51 |
| GO:00062822 | Colorectum | FAP | regulation of DNA repair | 32/2622 | 130/18723 | 8.53e-04 | 8.79e-03 | 32 |
| Page: 1 2 3 4 5 6 7 8 9 10 11 |
| Pathway ID | Tissue | Disease Stage | Description | Gene Ratio | Bg Ratio | pvalue | p.adjust | qvalue | Count |
| Page: 1 |
Top |
Cell-cell communication analysis |
| Identification of potential cell-cell interactions between two cell types and their ligand-receptor pairs for different disease states |
| Ligand | Receptor | LRpair | Pathway | Tissue | Disease Stage |
| Page: 1 |
Top |
Single-cell gene regulatory network inference analysis |
| Find out the significant the regulons (TFs) and the target genes of each regulon across cell types for different disease states |
| TF | Cell Type | Tissue | Disease Stage | Target Gene | RSS | Regulon Activity |
| ∗The dot plots of a searched regulon are shown for all cell subpopulations in each disease state of each tissue based on the regulon specific score inferred using pySCENIC and by calculating the average expression. |
| Page: 1 |
Top |
Somatic mutation of malignant transformation related genes |
| Annotation of somatic variants for genes involved in malignant transformation |
| Hugo Symbol | Variant Class | Variant Classification | dbSNP RS | HGVSc | HGVSp | HGVSp Short | SWISSPROT | BIOTYPE | SIFT | PolyPhen | Tumor Sample Barcode | Tissue | Histology | Sex | Age | Stage | Therapy Types | Drugs | Outcome |
| UIMC1 | SNV | Missense_Mutation | c.461N>G | p.Glu154Gly | p.E154G | Q96RL1 | protein_coding | tolerated(0.33) | benign(0.135) | TCGA-C8-A27A-01 | Breast | breast invasive carcinoma | Female | <65 | I/II | Chemotherapy | 5-fluorouracil | CR | |
| UIMC1 | SNV | Missense_Mutation | novel | c.1222N>C | p.Glu408Gln | p.E408Q | Q96RL1 | protein_coding | deleterious(0.01) | benign(0.224) | TCGA-S3-AA0Z-01 | Breast | breast invasive carcinoma | Female | <65 | I/II | Ancillary | neulasta | CR |
| UIMC1 | SNV | Missense_Mutation | c.977N>G | p.Pro326Arg | p.P326R | Q96RL1 | protein_coding | deleterious(0) | probably_damaging(0.996) | TCGA-FU-A3TQ-01 | Cervix | cervical & endocervical cancer | Female | <65 | III/IV | Unknown | Unknown | SD | |
| UIMC1 | insertion | Frame_Shift_Ins | novel | c.954_955insTCCTT | p.Gly319SerfsTer15 | p.G319Sfs*15 | Q96RL1 | protein_coding | TCGA-DS-A1OA-01 | Cervix | cervical & endocervical cancer | Female | >=65 | I/II | Chemotherapy | carboplatin | PD | ||
| UIMC1 | SNV | Missense_Mutation | c.350N>T | p.Ser117Ile | p.S117I | Q96RL1 | protein_coding | deleterious(0) | probably_damaging(0.999) | TCGA-AA-A01P-01 | Colorectum | colon adenocarcinoma | Female | >=65 | III/IV | Unknown | Unknown | PD | |
| UIMC1 | SNV | Missense_Mutation | novel | c.1912N>A | p.Asp638Asn | p.D638N | Q96RL1 | protein_coding | tolerated(0.1) | possibly_damaging(0.846) | TCGA-CA-6717-01 | Colorectum | colon adenocarcinoma | Male | <65 | I/II | Chemotherapy | oxaliplatin | CR |
| UIMC1 | SNV | Missense_Mutation | novel | c.1054G>T | p.Asp352Tyr | p.D352Y | Q96RL1 | protein_coding | deleterious(0) | probably_damaging(0.935) | TCGA-AG-A002-01 | Colorectum | rectum adenocarcinoma | Male | <65 | I/II | Unknown | Unknown | SD |
| UIMC1 | SNV | Missense_Mutation | rs779796802 | c.365N>A | p.Arg122Gln | p.R122Q | Q96RL1 | protein_coding | tolerated(1) | benign(0.003) | TCGA-AG-A032-01 | Colorectum | rectum adenocarcinoma | Male | >=65 | III/IV | Targeted Molecular therapy | bevacizumab | PD |
| UIMC1 | insertion | Nonsense_Mutation | novel | c.2034_2035insTACTAATGGTTTT | p.Val679TyrfsTer2 | p.V679Yfs*2 | Q96RL1 | protein_coding | TCGA-AM-5820-01 | Colorectum | colon adenocarcinoma | Female | <65 | I/II | Unknown | Unknown | SD | ||
| UIMC1 | SNV | Missense_Mutation | novel | c.1916N>A | p.Ala639Glu | p.A639E | Q96RL1 | protein_coding | deleterious(0) | benign(0.29) | TCGA-A5-A0G2-01 | Endometrium | uterine corpus endometrioid carcinoma | Female | <65 | III/IV | Unknown | Unknown | SD |
| Page: 1 2 3 4 5 6 |
Top |
Related drugs of malignant transformation related genes |
| Identification of chemicals and drugs interact with genes involved in malignant transfromation |
| (DGIdb 4.0) |
| Entrez ID | Symbol | Category | Interaction Types | Drug Claim Name | Drug Name | PMIDs |
| Page: 1 |

Copyright 2023-Present -The University of Texas Health Science Center at Houston |