
|
|||||
|
 | |
| |
| |
| |
| |
| |
|
Gene: UBL5 |
Gene summary for UBL5 |
| Gene information | Species | Human | Gene symbol | UBL5 | Gene ID | 59286 |
| Gene name | ubiquitin like 5 | |
| Gene Alias | HUB1 | |
| Cytomap | 19p13.2 | |
| Gene Type | protein-coding | GO ID | GO:0000375 | UniProtAcc | A0A024R7B0 |
Top |
Malignant transformation analysis |
| Identification of the aberrant gene expression in precancerous and cancerous lesions by comparing the gene expression of stem-like cells in diseased tissues with normal stem cells |
| Entrez ID | Symbol | Replicates | Species | Organ | Tissue | Adj P-value | Log2FC | Malignancy |
| 59286 | UBL5 | AEH-subject4 | Human | Endometrium | AEH | 8.80e-22 | -6.11e-01 | -0.2657 |
| 59286 | UBL5 | AEH-subject5 | Human | Endometrium | AEH | 1.41e-27 | -6.12e-01 | -0.2953 |
| 59286 | UBL5 | EEC-subject1 | Human | Endometrium | EEC | 2.71e-32 | -6.44e-01 | -0.2682 |
| 59286 | UBL5 | EEC-subject2 | Human | Endometrium | EEC | 3.15e-18 | -4.59e-01 | -0.2607 |
| 59286 | UBL5 | EEC-subject3 | Human | Endometrium | EEC | 2.37e-66 | -6.41e-01 | -0.2525 |
| 59286 | UBL5 | EEC-subject4 | Human | Endometrium | EEC | 2.18e-24 | -5.30e-01 | -0.2571 |
| 59286 | UBL5 | EEC-subject5 | Human | Endometrium | EEC | 9.95e-24 | -4.69e-01 | -0.249 |
| 59286 | UBL5 | GSM5276934 | Human | Endometrium | EEC | 1.98e-18 | -4.63e-01 | -0.0913 |
| 59286 | UBL5 | GSM5276937 | Human | Endometrium | EEC | 1.46e-02 | -2.61e-01 | -0.0897 |
| 59286 | UBL5 | GSM6177620_NYU_UCEC1_lib1_lib1 | Human | Endometrium | EEC | 4.30e-53 | -5.96e-01 | -0.1869 |
| 59286 | UBL5 | GSM6177620_NYU_UCEC1_lib2_lib2 | Human | Endometrium | EEC | 9.81e-39 | -5.32e-01 | -0.1875 |
| 59286 | UBL5 | GSM6177620_NYU_UCEC1_lib3_lib3 | Human | Endometrium | EEC | 1.77e-44 | -5.84e-01 | -0.1883 |
| 59286 | UBL5 | GSM6177621_NYU_UCEC2_lib1_lib1 | Human | Endometrium | EEC | 9.05e-39 | -4.19e-01 | -0.1934 |
| 59286 | UBL5 | GSM6177622_NYU_UCEC3_lib1_lib1 | Human | Endometrium | EEC | 2.56e-60 | -4.33e-01 | -0.1917 |
| 59286 | UBL5 | GSM6177622_NYU_UCEC3_lib2_lib2 | Human | Endometrium | EEC | 9.67e-61 | -4.71e-01 | -0.1916 |
| 59286 | UBL5 | GSM6177623_NYU_UCEC3_Vis | Human | Endometrium | EEC | 1.45e-14 | 6.90e-02 | -0.1269 |
| 59286 | UBL5 | LZE4T | Human | Esophagus | ESCC | 1.29e-18 | 1.02e+00 | 0.0811 |
| 59286 | UBL5 | LZE5T | Human | Esophagus | ESCC | 8.86e-13 | 1.71e+00 | 0.0514 |
| 59286 | UBL5 | LZE7T | Human | Esophagus | ESCC | 7.72e-26 | 2.75e+00 | 0.0667 |
| 59286 | UBL5 | LZE8T | Human | Esophagus | ESCC | 2.53e-11 | 8.71e-01 | 0.067 |
| Page: 1 2 3 4 5 6 7 8 9 10 11 12 13 14 |
| Tissue | Expression Dynamics | Abbreviation |
| Breast | 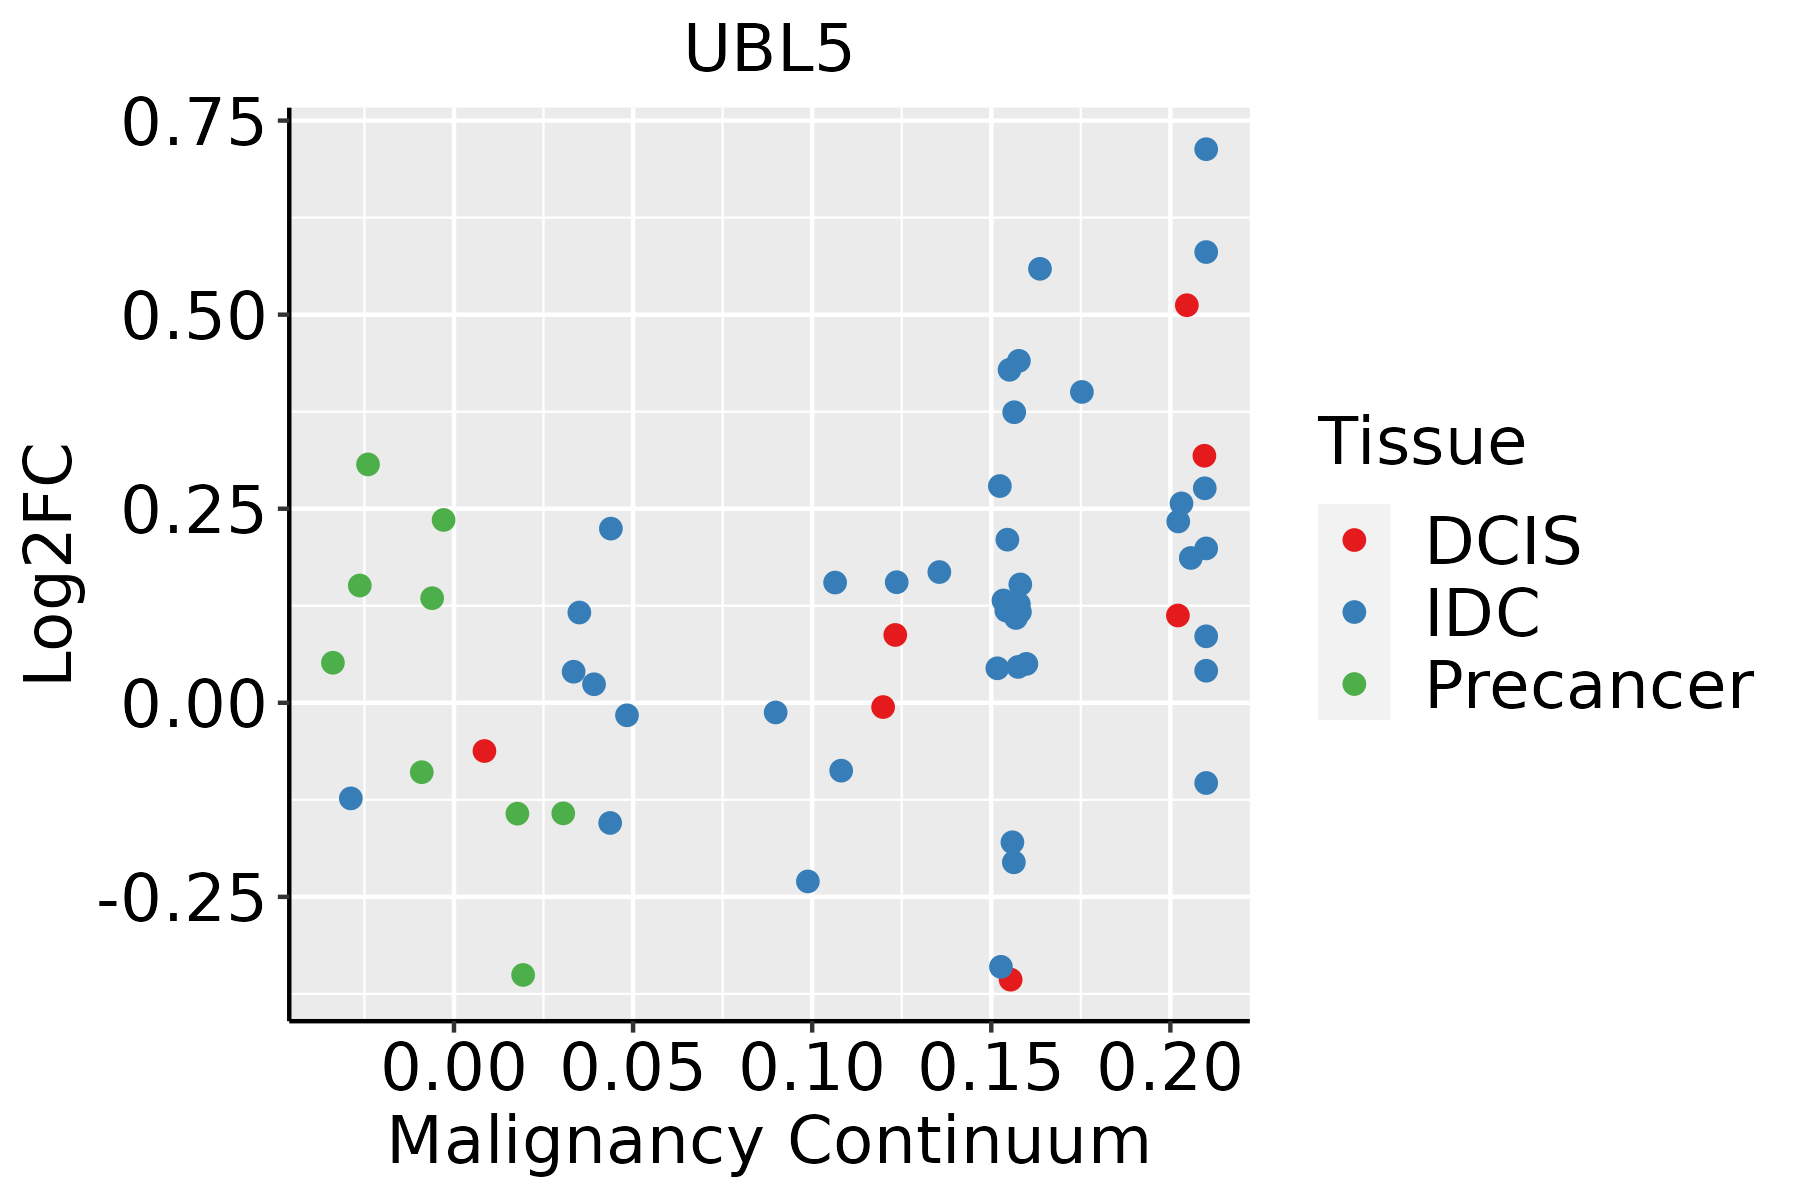 | IDC: Invasive ductal carcinoma |
| DCIS: Ductal carcinoma in situ | ||
| Precancer(BRCA1-mut): Precancerous lesion from BRCA1 mutation carriers | ||
| Cervix |  | CC: Cervix cancer |
| HSIL_HPV: HPV-infected high-grade squamous intraepithelial lesions | ||
| N_HPV: HPV-infected normal cervix | ||
| Colorectum (GSE201348) |  | FAP: Familial adenomatous polyposis |
| CRC: Colorectal cancer | ||
| Colorectum (HTA11) |  | AD: Adenomas |
| SER: Sessile serrated lesions | ||
| MSI-H: Microsatellite-high colorectal cancer | ||
| MSS: Microsatellite stable colorectal cancer | ||
| Endometrium | 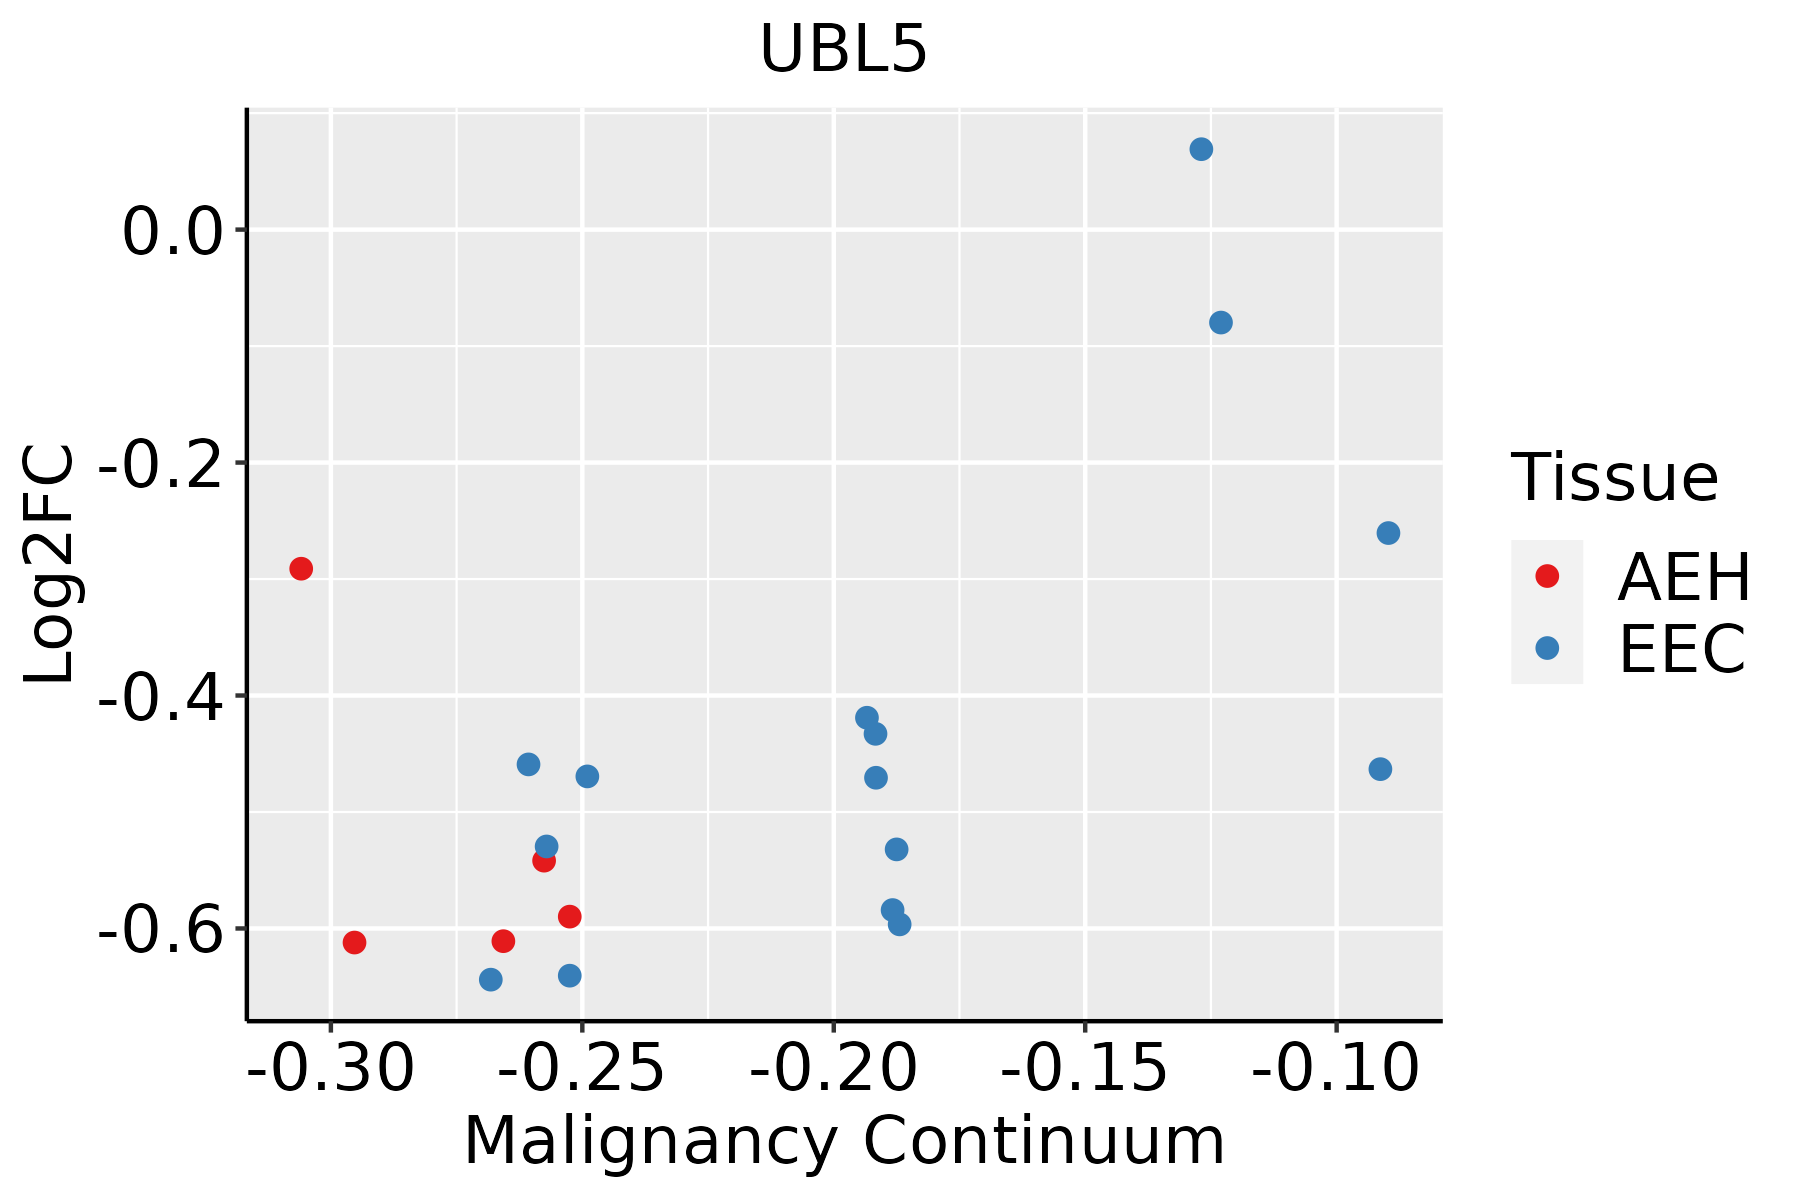 | AEH: Atypical endometrial hyperplasia |
| EEC: Endometrioid Cancer | ||
| Esophagus | 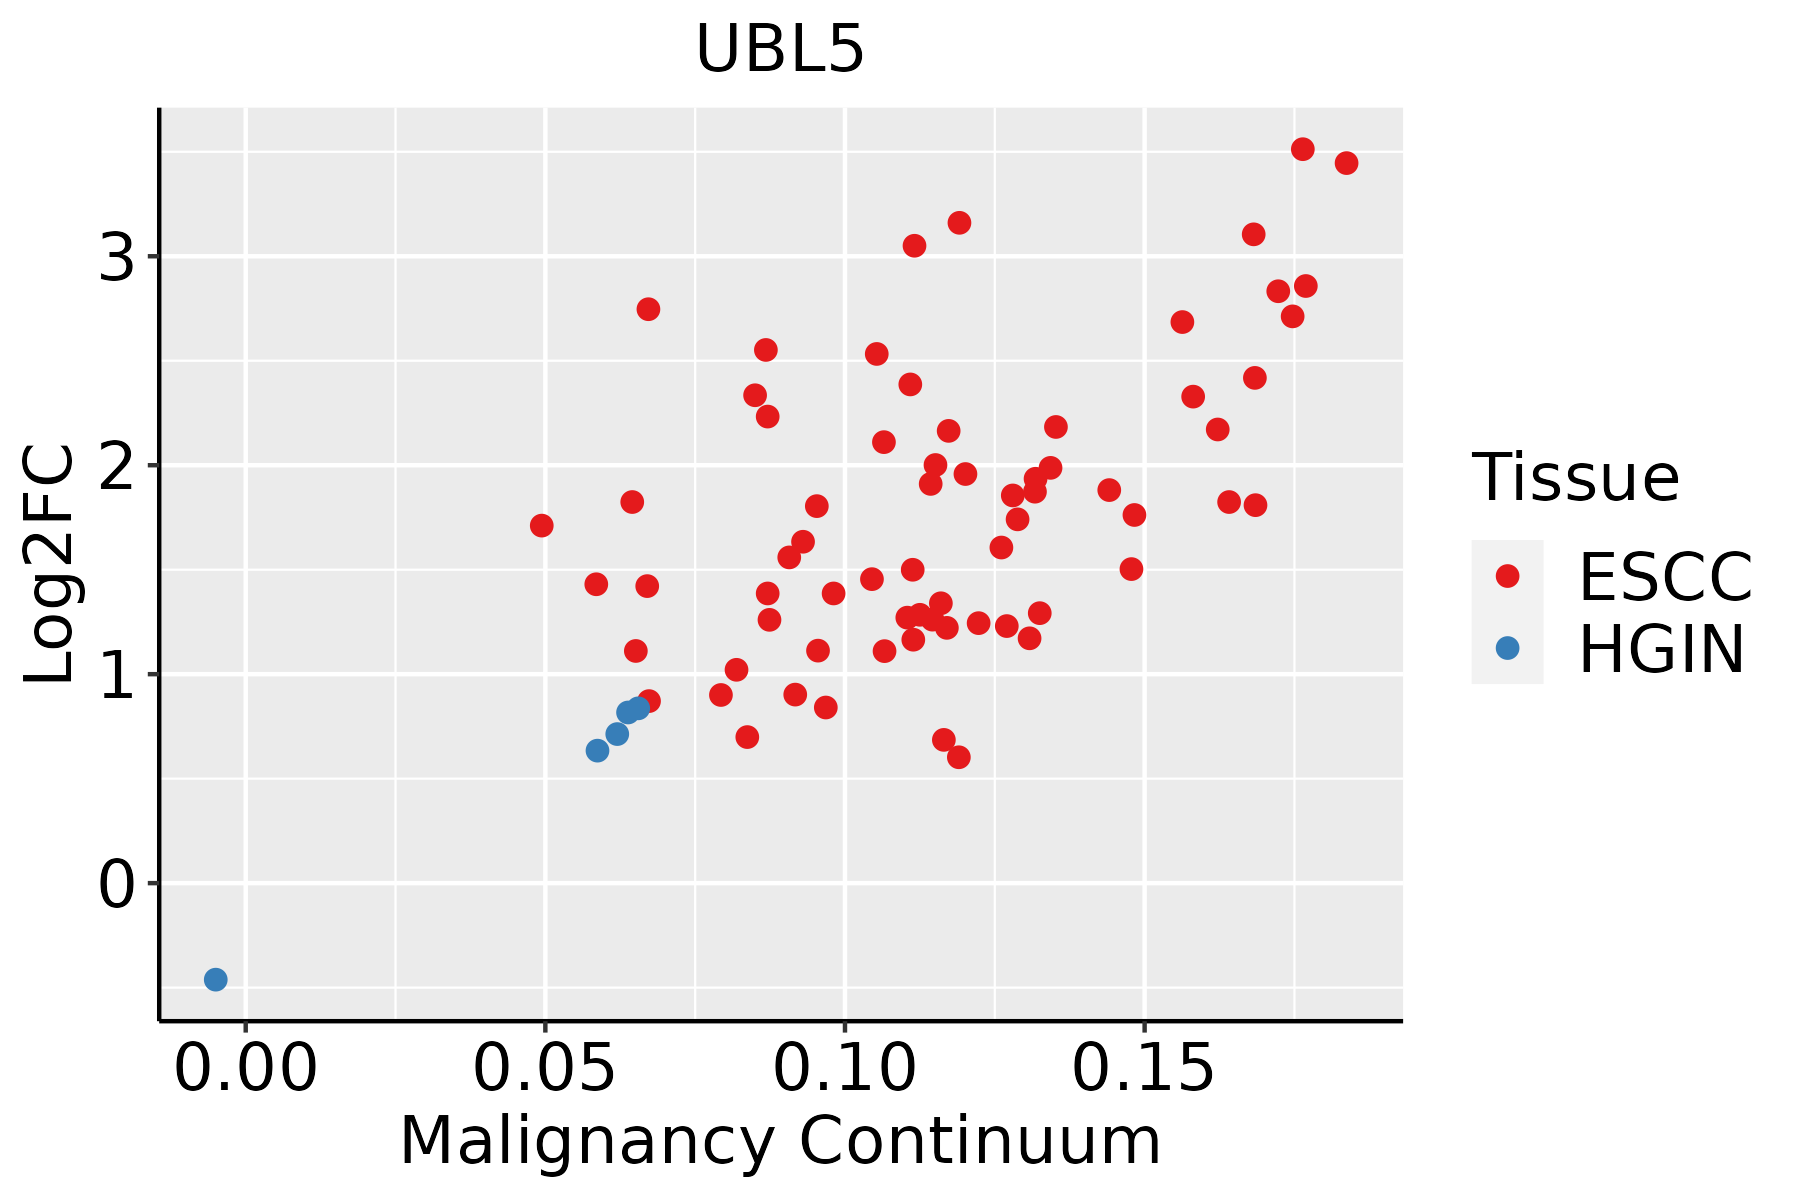 | ESCC: Esophageal squamous cell carcinoma |
| HGIN: High-grade intraepithelial neoplasias | ||
| LGIN: Low-grade intraepithelial neoplasias | ||
| Liver |  | HCC: Hepatocellular carcinoma |
| NAFLD: Non-alcoholic fatty liver disease | ||
| Oral Cavity | 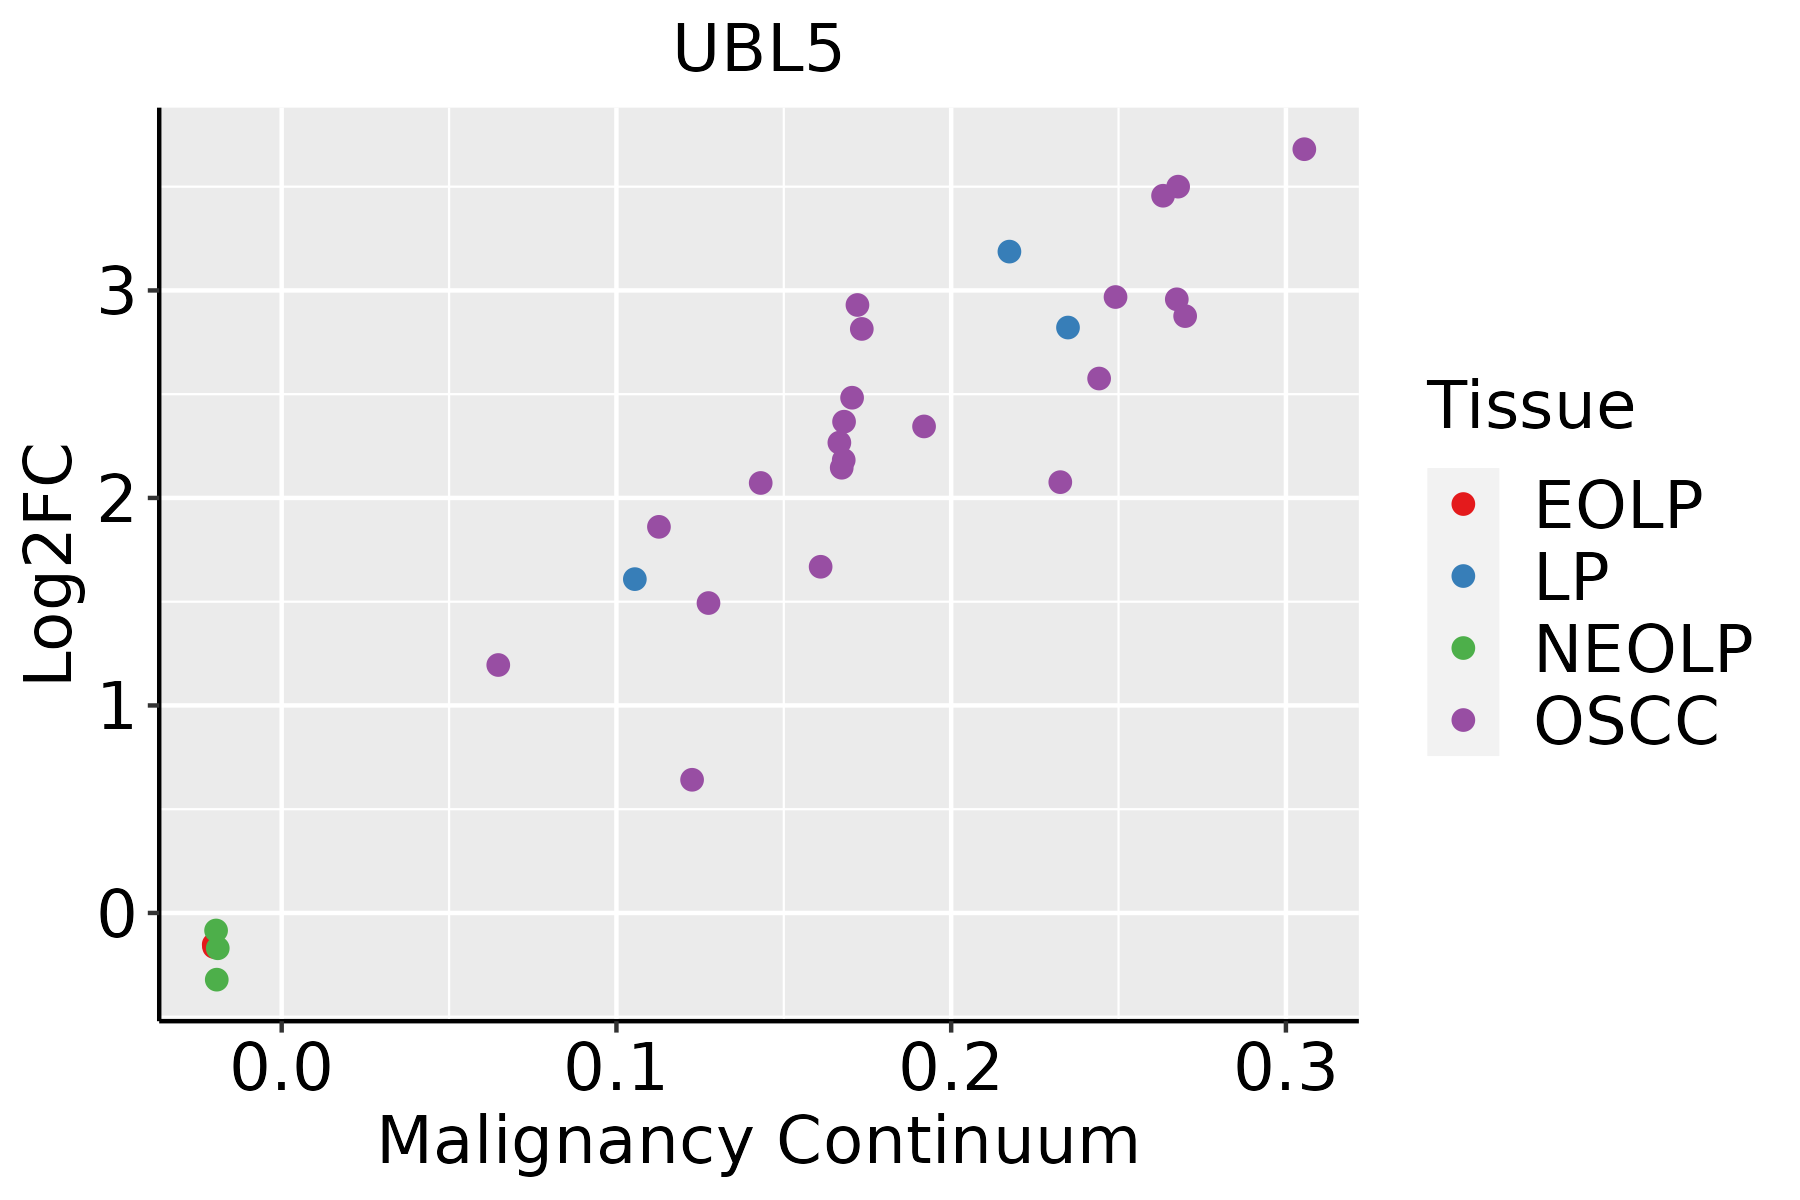 | EOLP: Erosive Oral lichen planus |
| LP: leukoplakia | ||
| NEOLP: Non-erosive oral lichen planus | ||
| OSCC: Oral squamous cell carcinoma | ||
| Prostate | 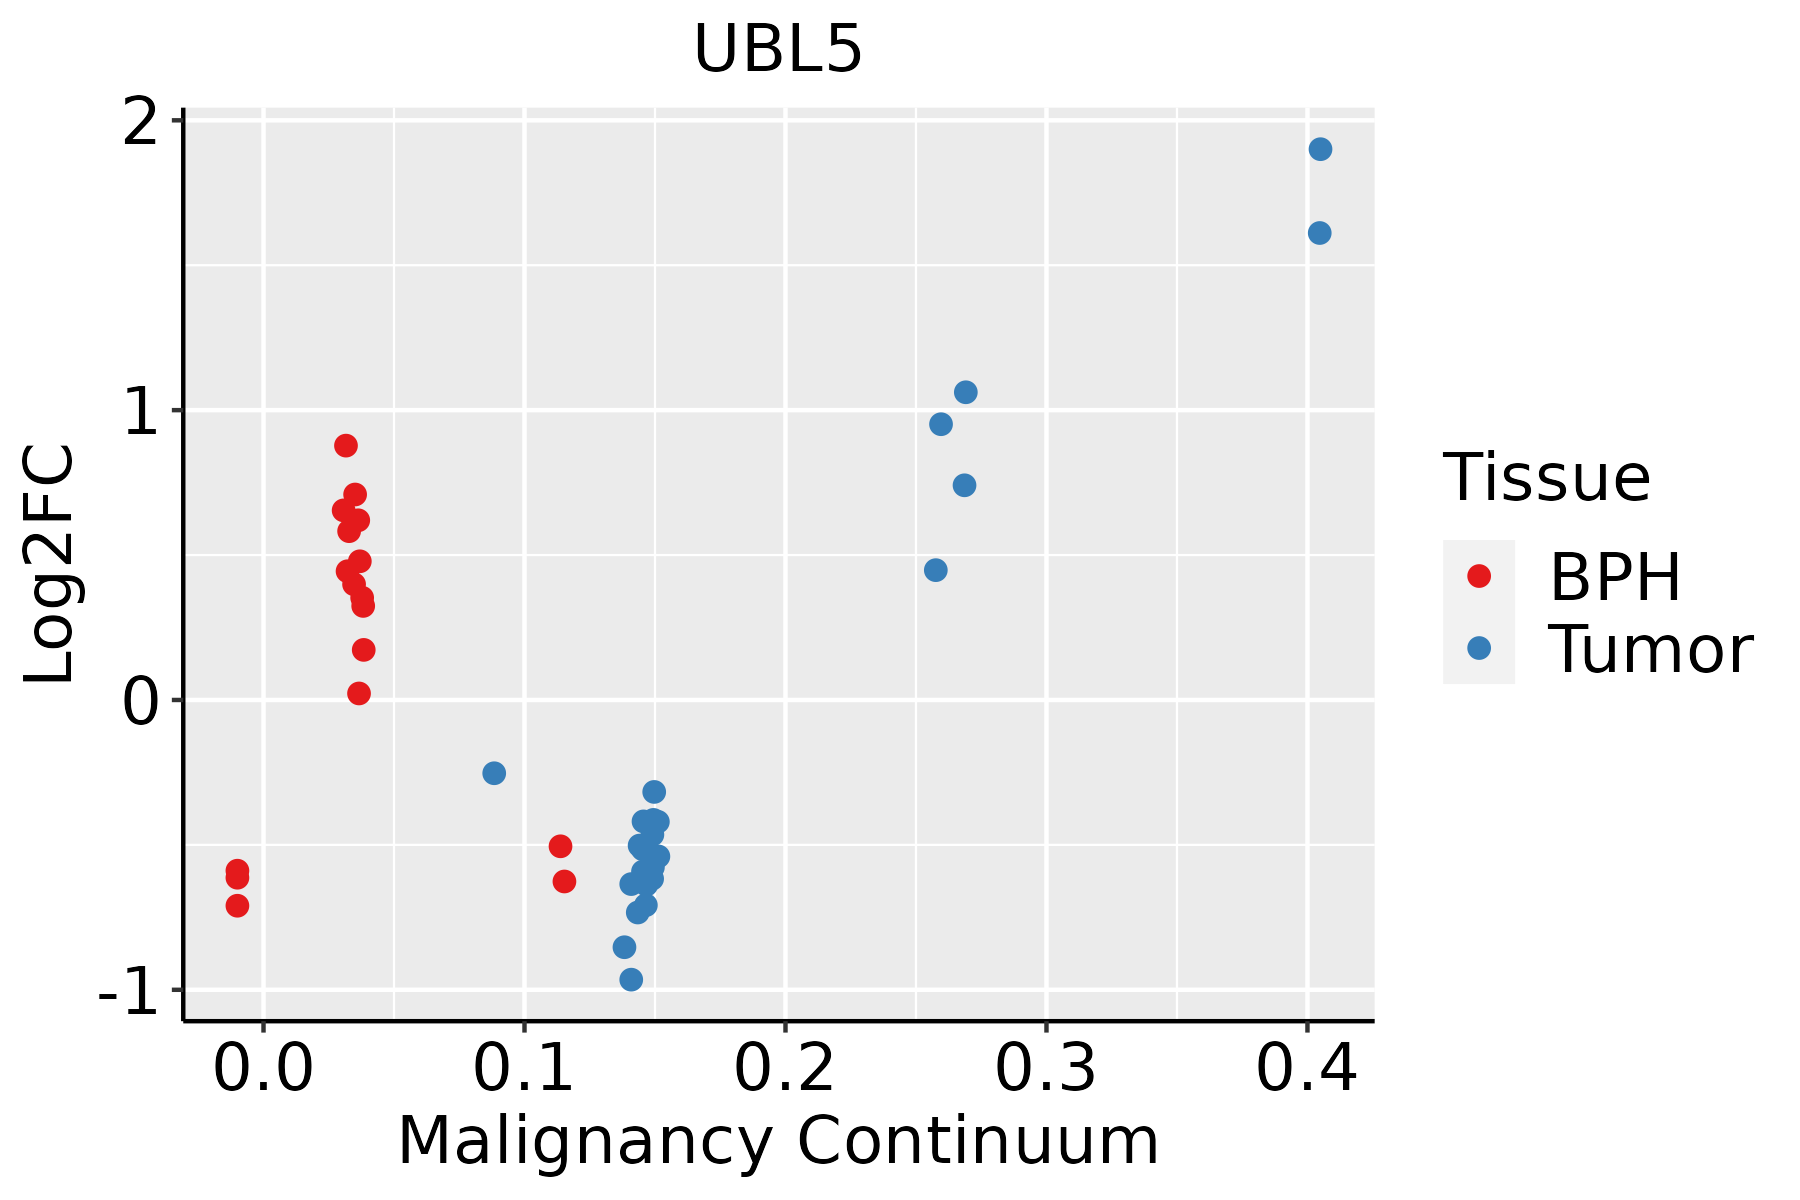 | BPH: Benign Prostatic Hyperplasia |
| Skin | 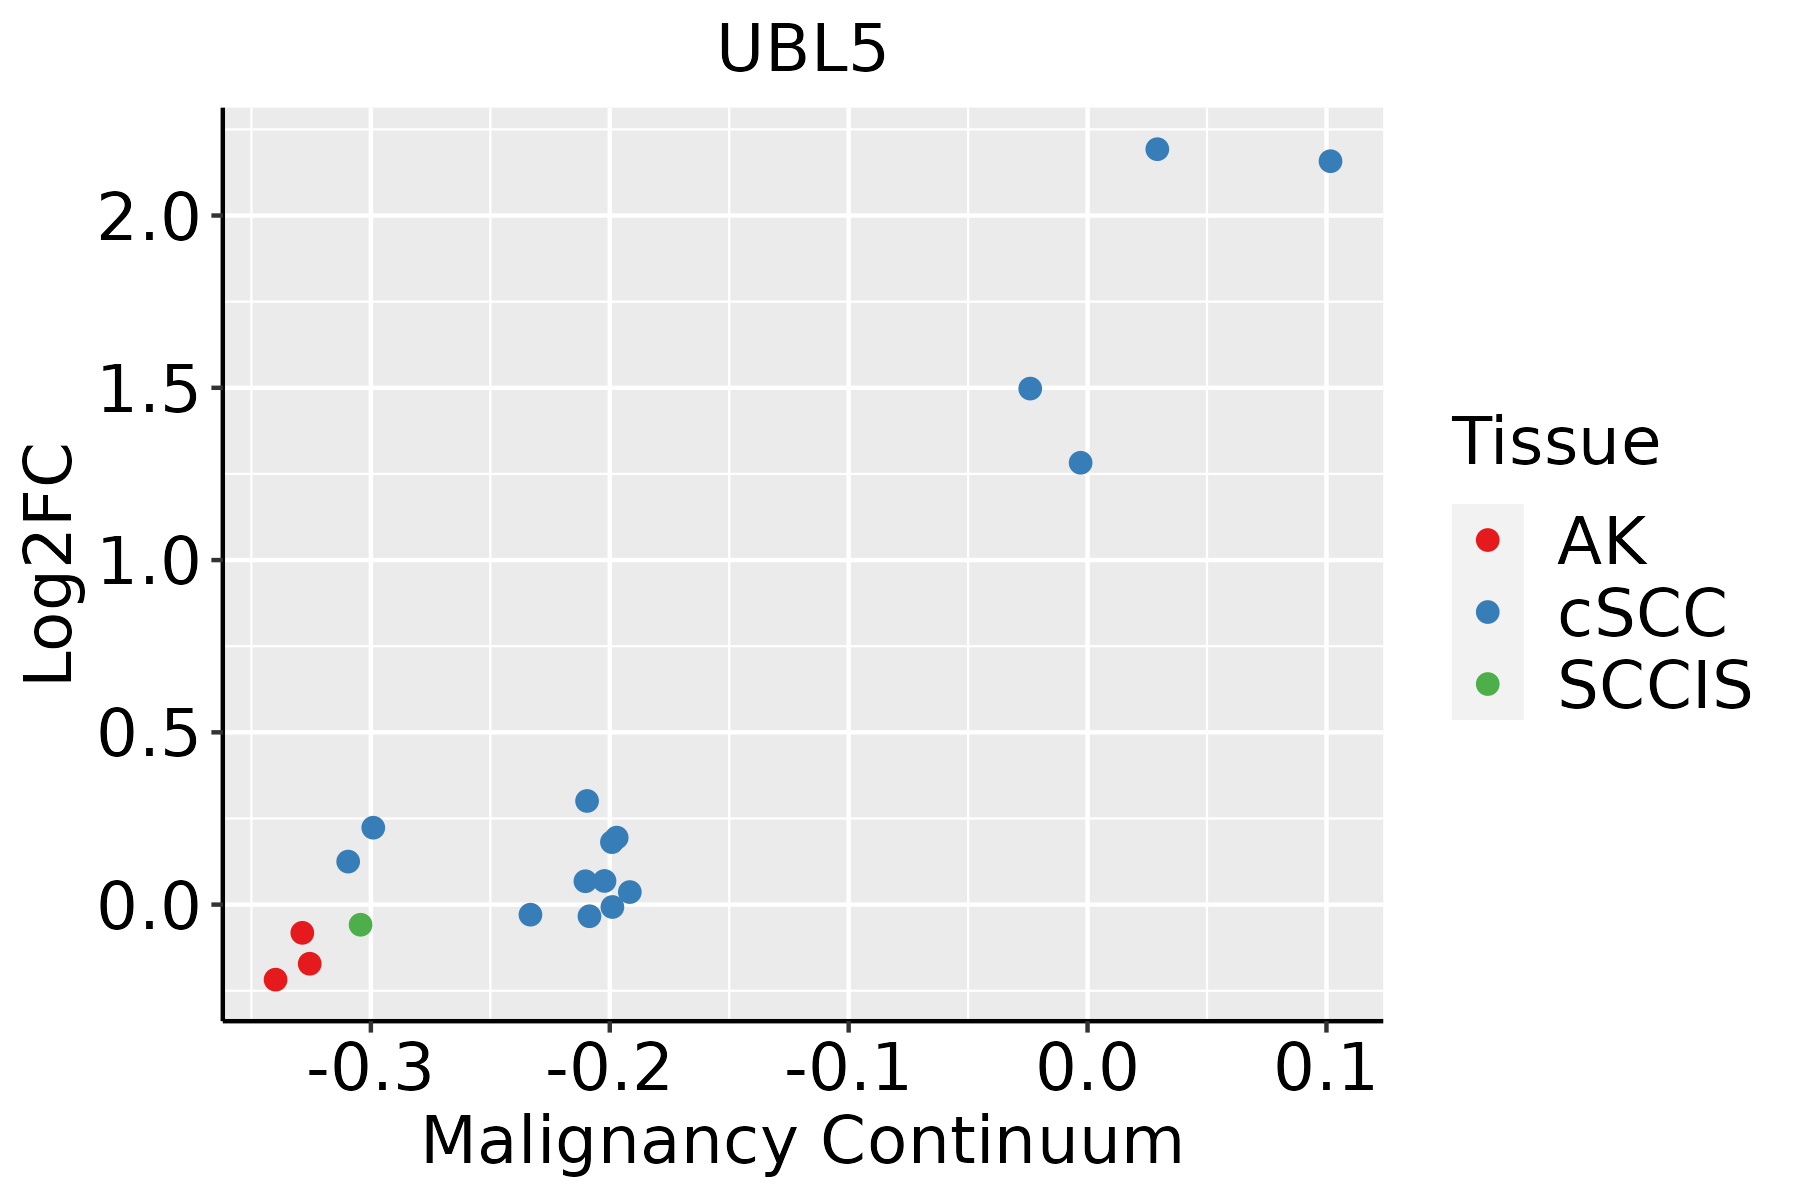 | AK: Actinic keratosis |
| cSCC: Cutaneous squamous cell carcinoma | ||
| SCCIS:squamous cell carcinoma in situ | ||
| Thyroid | 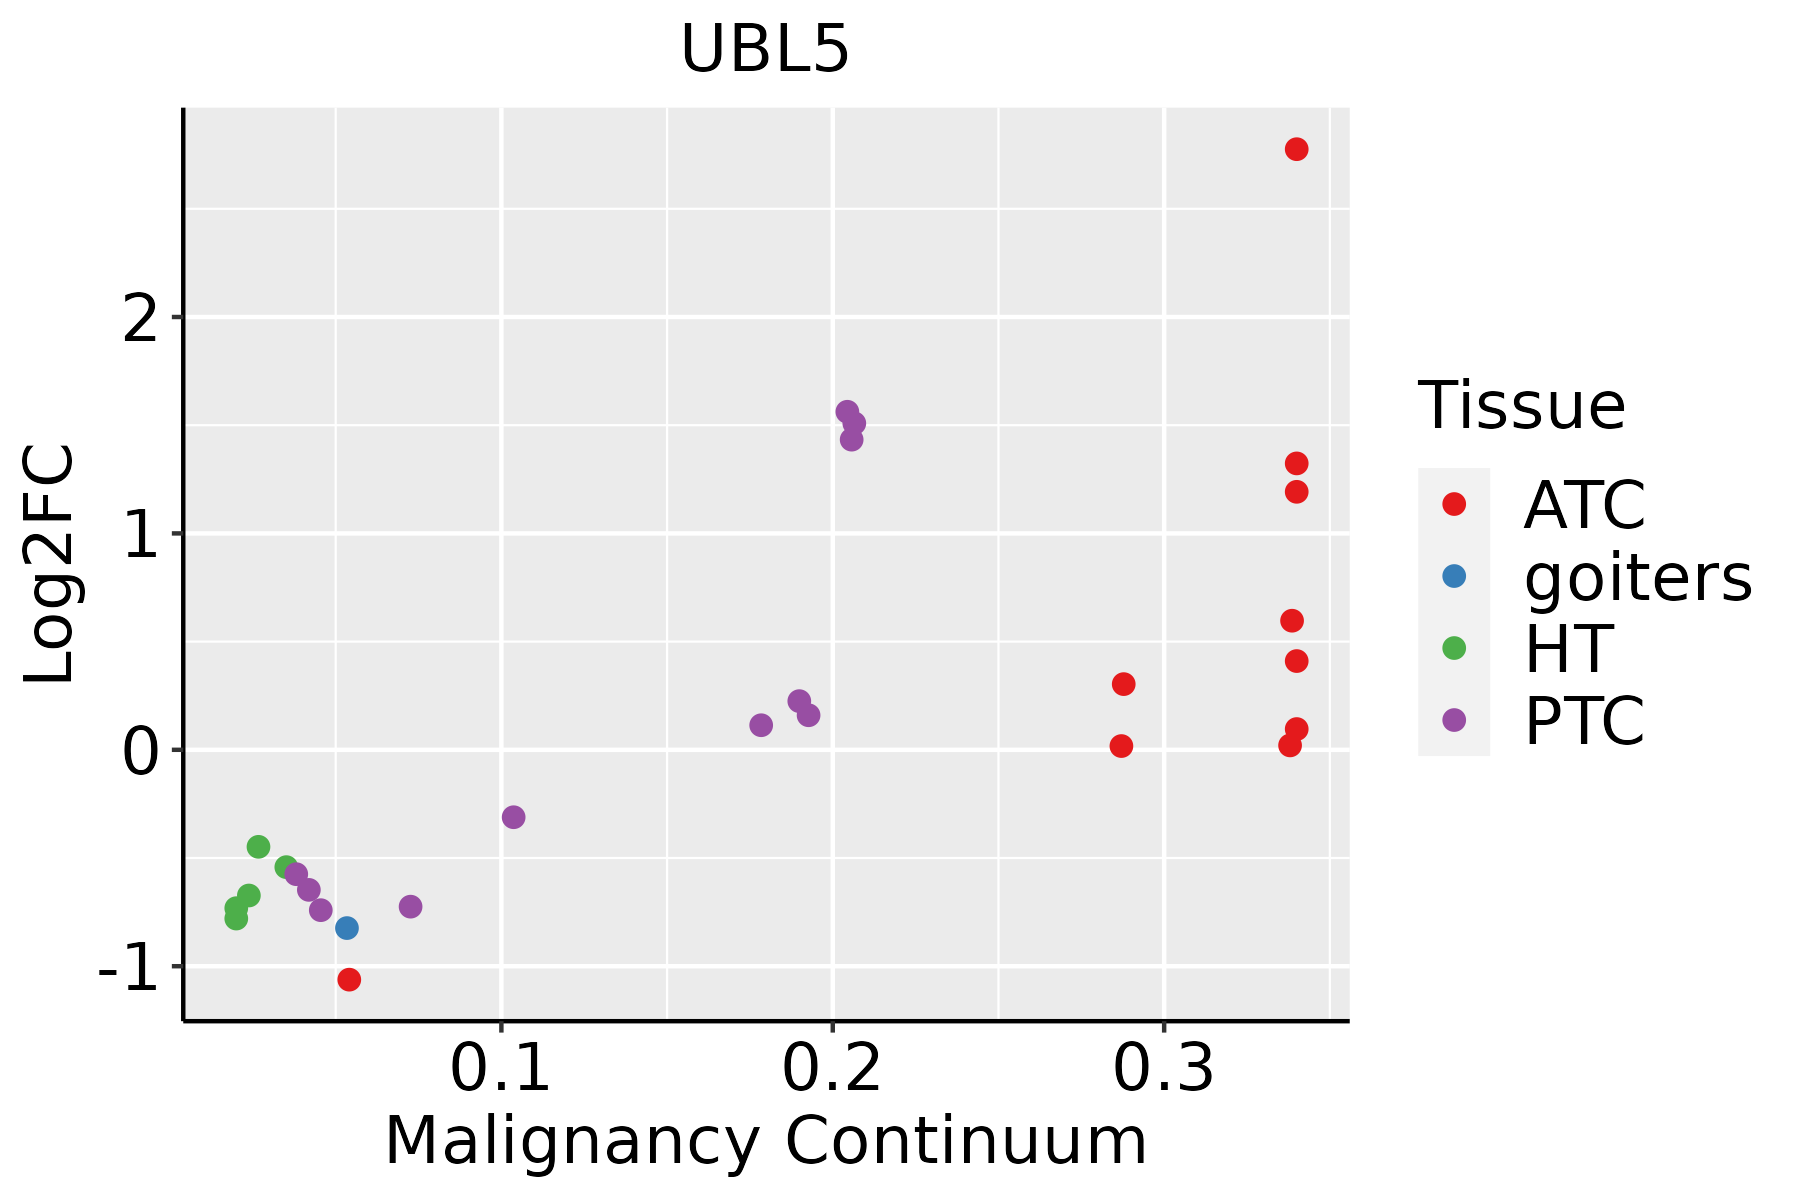 | ATC: Anaplastic thyroid cancer |
| HT: Hashimoto's thyroiditis | ||
| PTC: Papillary thyroid cancer |
| ∗log2FC in expression of this searched gene in stem-like cells from each diseased tissue sample relative to stem-like cells in normal samples in each tissue plotted against the malignancy continuum. Samples are colored based on if they are from different disease stage. |
Top |
Malignant transformation related pathway analysis |
| Find out the enriched GO biological processes and KEGG pathways involved in transition from healthy to precancer to cancer |
| Tissue | Disease Stage | Enriched GO biological Processes |
| Colorectum | AD |  |
| Colorectum | SER |  |
| Colorectum | MSS |  |
| Colorectum | MSI-H |  |
| Colorectum | FAP |  |
| ∗Top 15 enriched GO BP terms are showed in the bar plot of each disease state in each tissue. Each row represents a significant GO biological process which is colored according to the -log10(p.adjust). |
| Page: 1 2 3 4 5 6 7 8 9 |
| GO ID | Tissue | Disease Stage | Description | Gene Ratio | Bg Ratio | pvalue | p.adjust | Count |
| GO:00083809 | Breast | Precancer | RNA splicing | 65/1080 | 434/18723 | 1.27e-12 | 2.53e-10 | 65 |
| GO:00068398 | Breast | Precancer | mitochondrial transport | 45/1080 | 254/18723 | 1.37e-11 | 1.88e-09 | 45 |
| GO:00003759 | Breast | Precancer | RNA splicing, via transesterification reactions | 52/1080 | 324/18723 | 1.74e-11 | 2.22e-09 | 52 |
| GO:00003779 | Breast | Precancer | RNA splicing, via transesterification reactions with bulged adenosine as nucleophile | 51/1080 | 320/18723 | 3.55e-11 | 4.04e-09 | 51 |
| GO:00003989 | Breast | Precancer | mRNA splicing, via spliceosome | 51/1080 | 320/18723 | 3.55e-11 | 4.04e-09 | 51 |
| GO:00705858 | Breast | Precancer | protein localization to mitochondrion | 21/1080 | 125/18723 | 9.07e-06 | 2.42e-04 | 21 |
| GO:00726558 | Breast | Precancer | establishment of protein localization to mitochondrion | 20/1080 | 120/18723 | 1.66e-05 | 4.03e-04 | 20 |
| GO:19049519 | Breast | Precancer | positive regulation of establishment of protein localization | 36/1080 | 319/18723 | 9.30e-05 | 1.75e-03 | 36 |
| GO:00066268 | Breast | Precancer | protein targeting to mitochondrion | 15/1080 | 100/18723 | 5.94e-04 | 7.48e-03 | 15 |
| GO:19038299 | Breast | Precancer | positive regulation of cellular protein localization | 30/1080 | 276/18723 | 6.48e-04 | 7.99e-03 | 30 |
| GO:00066059 | Breast | Precancer | protein targeting | 33/1080 | 314/18723 | 6.50e-04 | 7.99e-03 | 33 |
| GO:00725948 | Breast | Precancer | establishment of protein localization to organelle | 41/1080 | 422/18723 | 7.75e-04 | 9.20e-03 | 41 |
| GO:00512229 | Breast | Precancer | positive regulation of protein transport | 31/1080 | 303/18723 | 1.44e-03 | 1.50e-02 | 31 |
| GO:19037474 | Breast | Precancer | regulation of establishment of protein localization to mitochondrion | 8/1080 | 50/18723 | 7.39e-03 | 4.90e-02 | 8 |
| GO:000838014 | Breast | IDC | RNA splicing | 73/1434 | 434/18723 | 1.27e-10 | 1.57e-08 | 73 |
| GO:000683913 | Breast | IDC | mitochondrial transport | 51/1434 | 254/18723 | 1.54e-10 | 1.83e-08 | 51 |
| GO:000037514 | Breast | IDC | RNA splicing, via transesterification reactions | 58/1434 | 324/18723 | 9.44e-10 | 9.58e-08 | 58 |
| GO:000037714 | Breast | IDC | RNA splicing, via transesterification reactions with bulged adenosine as nucleophile | 57/1434 | 320/18723 | 1.60e-09 | 1.49e-07 | 57 |
| GO:000039814 | Breast | IDC | mRNA splicing, via spliceosome | 57/1434 | 320/18723 | 1.60e-09 | 1.49e-07 | 57 |
| GO:190495113 | Breast | IDC | positive regulation of establishment of protein localization | 45/1434 | 319/18723 | 5.01e-05 | 1.09e-03 | 45 |
| Page: 1 2 3 4 5 6 7 8 9 10 11 12 13 14 15 16 17 18 19 20 21 22 23 24 25 |
| Pathway ID | Tissue | Disease Stage | Description | Gene Ratio | Bg Ratio | pvalue | p.adjust | qvalue | Count |
| Page: 1 |
Top |
Cell-cell communication analysis |
| Identification of potential cell-cell interactions between two cell types and their ligand-receptor pairs for different disease states |
| Ligand | Receptor | LRpair | Pathway | Tissue | Disease Stage |
| Page: 1 |
Top |
Single-cell gene regulatory network inference analysis |
| Find out the significant the regulons (TFs) and the target genes of each regulon across cell types for different disease states |
| TF | Cell Type | Tissue | Disease Stage | Target Gene | RSS | Regulon Activity |
| ∗The dot plots of a searched regulon are shown for all cell subpopulations in each disease state of each tissue based on the regulon specific score inferred using pySCENIC and by calculating the average expression. |
| Page: 1 |
Top |
Somatic mutation of malignant transformation related genes |
| Annotation of somatic variants for genes involved in malignant transformation |
| Hugo Symbol | Variant Class | Variant Classification | dbSNP RS | HGVSc | HGVSp | HGVSp Short | SWISSPROT | BIOTYPE | SIFT | PolyPhen | Tumor Sample Barcode | Tissue | Histology | Sex | Age | Stage | Therapy Types | Drugs | Outcome |
| UBL5 | SNV | Missense_Mutation | novel | c.198G>A | p.Met66Ile | p.M66I | Q9BZL1 | protein_coding | deleterious(0.03) | benign(0.01) | TCGA-VS-A958-01 | Cervix | cervical & endocervical cancer | Female | <65 | I/II | Chemotherapy | cisplatin | CR |
| UBL5 | SNV | Missense_Mutation | c.61N>A | p.Asp21Asn | p.D21N | Q9BZL1 | protein_coding | tolerated(0.16) | benign(0.003) | TCGA-AP-A051-01 | Endometrium | uterine corpus endometrioid carcinoma | Female | >=65 | I/II | Unknown | Unknown | SD |
| Page: 1 |
Top |
Related drugs of malignant transformation related genes |
| Identification of chemicals and drugs interact with genes involved in malignant transfromation |
| (DGIdb 4.0) |
| Entrez ID | Symbol | Category | Interaction Types | Drug Claim Name | Drug Name | PMIDs |
| Page: 1 |

Copyright 2023-Present -The University of Texas Health Science Center at Houston |