
|
|||||
|
 | |
| |
| |
| |
| |
| |
|
Gene: UAP1 |
Gene summary for UAP1 |
| Gene information | Species | Human | Gene symbol | UAP1 | Gene ID | 6675 |
| Gene name | UDP-N-acetylglucosamine pyrophosphorylase 1 | |
| Gene Alias | AGX | |
| Cytomap | 1q23.3 | |
| Gene Type | protein-coding | GO ID | GO:0006040 | UniProtAcc | A0A140VKC0 |
Top |
Malignant transformation analysis |
| Identification of the aberrant gene expression in precancerous and cancerous lesions by comparing the gene expression of stem-like cells in diseased tissues with normal stem cells |
| Entrez ID | Symbol | Replicates | Species | Organ | Tissue | Adj P-value | Log2FC | Malignancy |
| 6675 | UAP1 | C04 | Human | Oral cavity | OSCC | 5.66e-16 | 1.00e+00 | 0.2633 |
| 6675 | UAP1 | C21 | Human | Oral cavity | OSCC | 7.57e-18 | 8.93e-01 | 0.2678 |
| 6675 | UAP1 | C30 | Human | Oral cavity | OSCC | 3.58e-18 | 1.29e+00 | 0.3055 |
| 6675 | UAP1 | C43 | Human | Oral cavity | OSCC | 6.22e-12 | 2.74e-01 | 0.1704 |
| 6675 | UAP1 | C46 | Human | Oral cavity | OSCC | 2.76e-05 | 1.67e-01 | 0.1673 |
| 6675 | UAP1 | C57 | Human | Oral cavity | OSCC | 1.19e-02 | 3.53e-01 | 0.1679 |
| 6675 | UAP1 | C08 | Human | Oral cavity | OSCC | 5.86e-12 | 2.97e-01 | 0.1919 |
| 6675 | UAP1 | C09 | Human | Oral cavity | OSCC | 1.60e-04 | 1.57e-01 | 0.1431 |
| 6675 | UAP1 | LN46 | Human | Oral cavity | OSCC | 2.29e-06 | 3.01e-01 | 0.1666 |
| 6675 | UAP1 | NEOLP-3 | Human | Oral cavity | NEOLP | 5.55e-04 | 1.72e-01 | -0.0191 |
| 6675 | UAP1 | SYSMH3 | Human | Oral cavity | OSCC | 1.99e-03 | 2.86e-01 | 0.2442 |
| 6675 | UAP1 | SYSMH4 | Human | Oral cavity | OSCC | 4.93e-06 | -2.22e-01 | 0.1226 |
| 6675 | UAP1 | SYSMH6 | Human | Oral cavity | OSCC | 2.71e-02 | 1.52e-01 | 0.1275 |
| 6675 | UAP1 | GSM5252130_BPH340PrGF_Via | Human | Prostate | BPH | 1.44e-05 | 4.89e-01 | -0.1972 |
| 6675 | UAP1 | GSM5252131_BPH340PrSF_Via | Human | Prostate | BPH | 2.84e-04 | 4.36e-01 | -0.2126 |
| 6675 | UAP1 | GSM5252132_BPH389PrGF | Human | Prostate | BPH | 1.07e-03 | 6.01e-01 | -0.2247 |
| 6675 | UAP1 | GSM5252134_BPH511PrG_Fcol_3GEX | Human | Prostate | BPH | 2.13e-07 | 4.59e-01 | -0.1433 |
| 6675 | UAP1 | GSM5252135_BPH511PrPUr_Fcol_3GEX | Human | Prostate | BPH | 2.55e-04 | 3.76e-01 | -0.1833 |
| 6675 | UAP1 | GSM5252136_BPH556PrGA1_Fcol | Human | Prostate | BPH | 3.41e-09 | 6.41e-01 | -0.23 |
| 6675 | UAP1 | GSM5252137_BPH556PrGA2_Fcol | Human | Prostate | BPH | 3.76e-07 | 6.23e-01 | -0.23 |
| Page: 1 2 3 4 5 6 7 |
| Tissue | Expression Dynamics | Abbreviation |
| Endometrium | 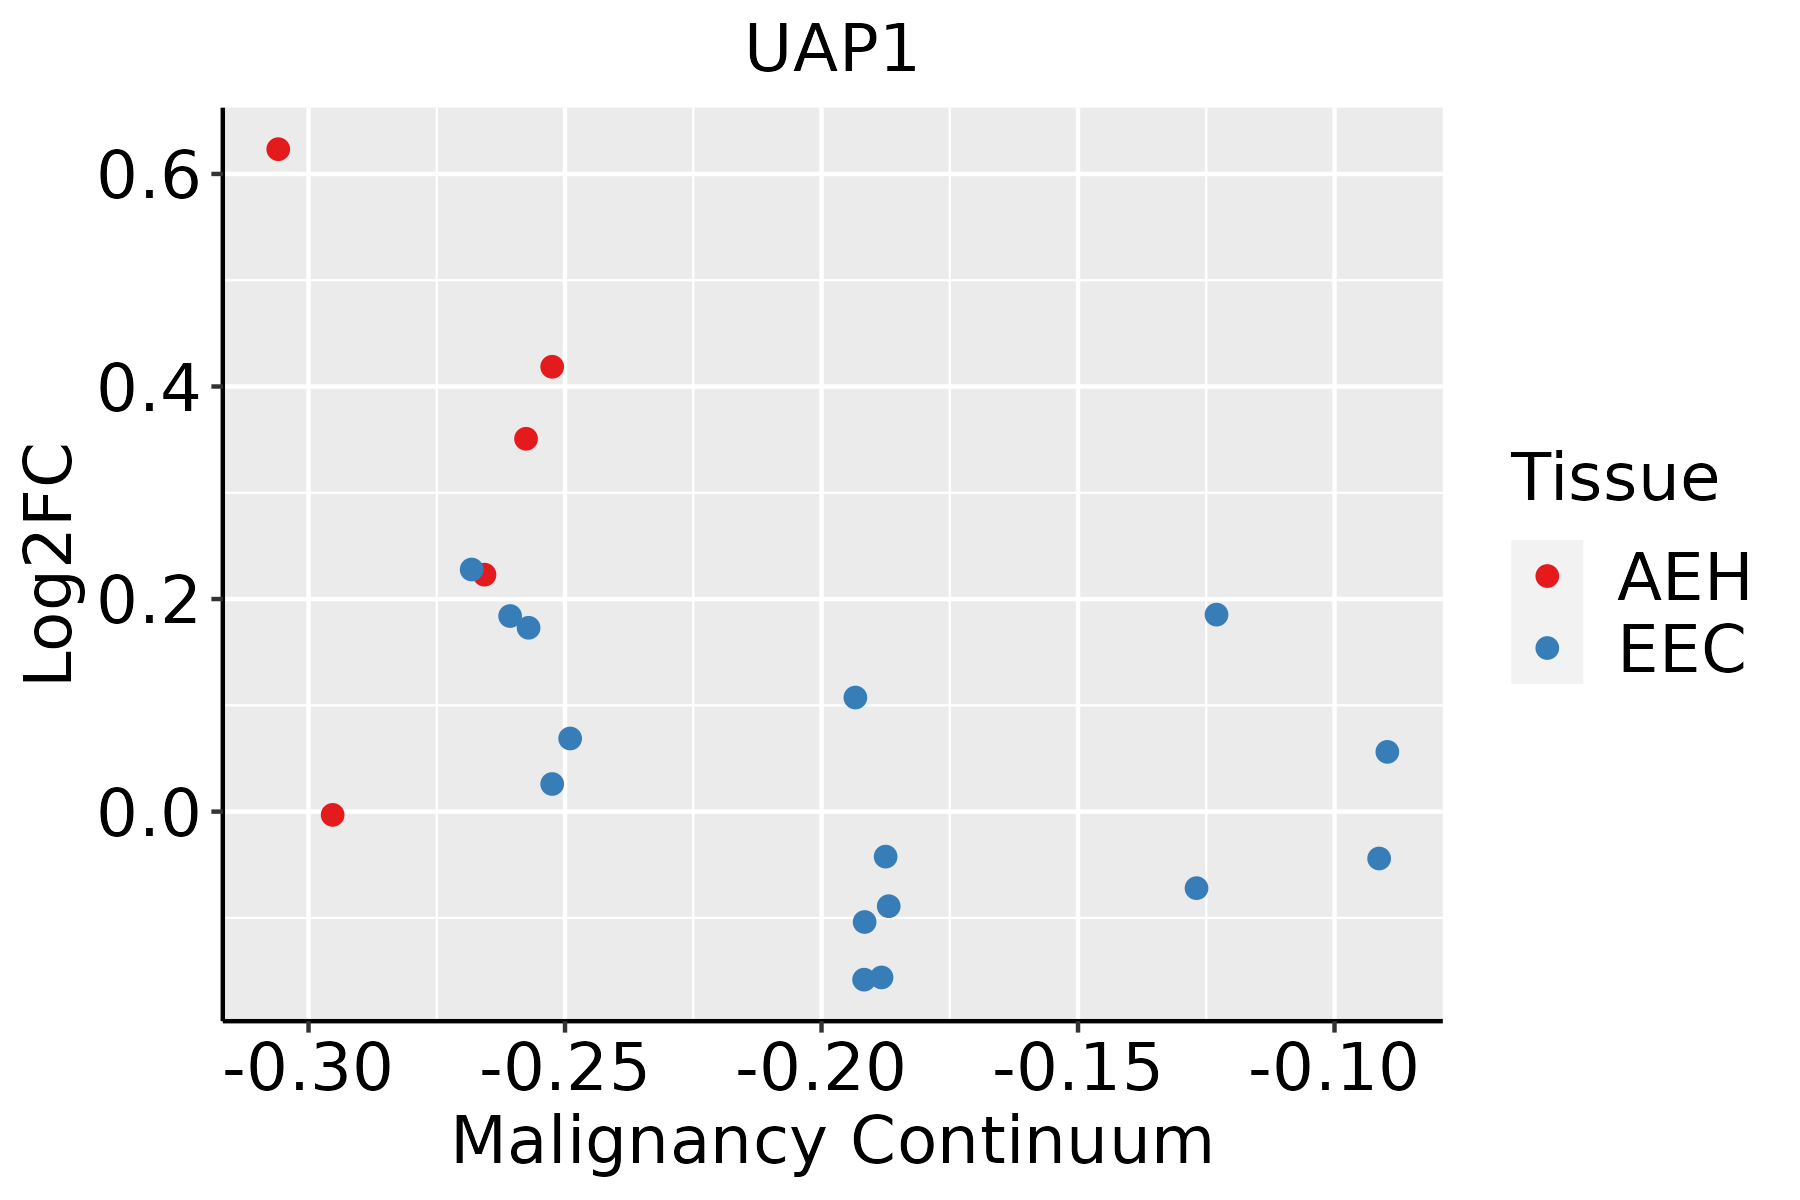 | AEH: Atypical endometrial hyperplasia |
| EEC: Endometrioid Cancer | ||
| Esophagus |  | ESCC: Esophageal squamous cell carcinoma |
| HGIN: High-grade intraepithelial neoplasias | ||
| LGIN: Low-grade intraepithelial neoplasias | ||
| Liver |  | HCC: Hepatocellular carcinoma |
| NAFLD: Non-alcoholic fatty liver disease | ||
| Oral Cavity | 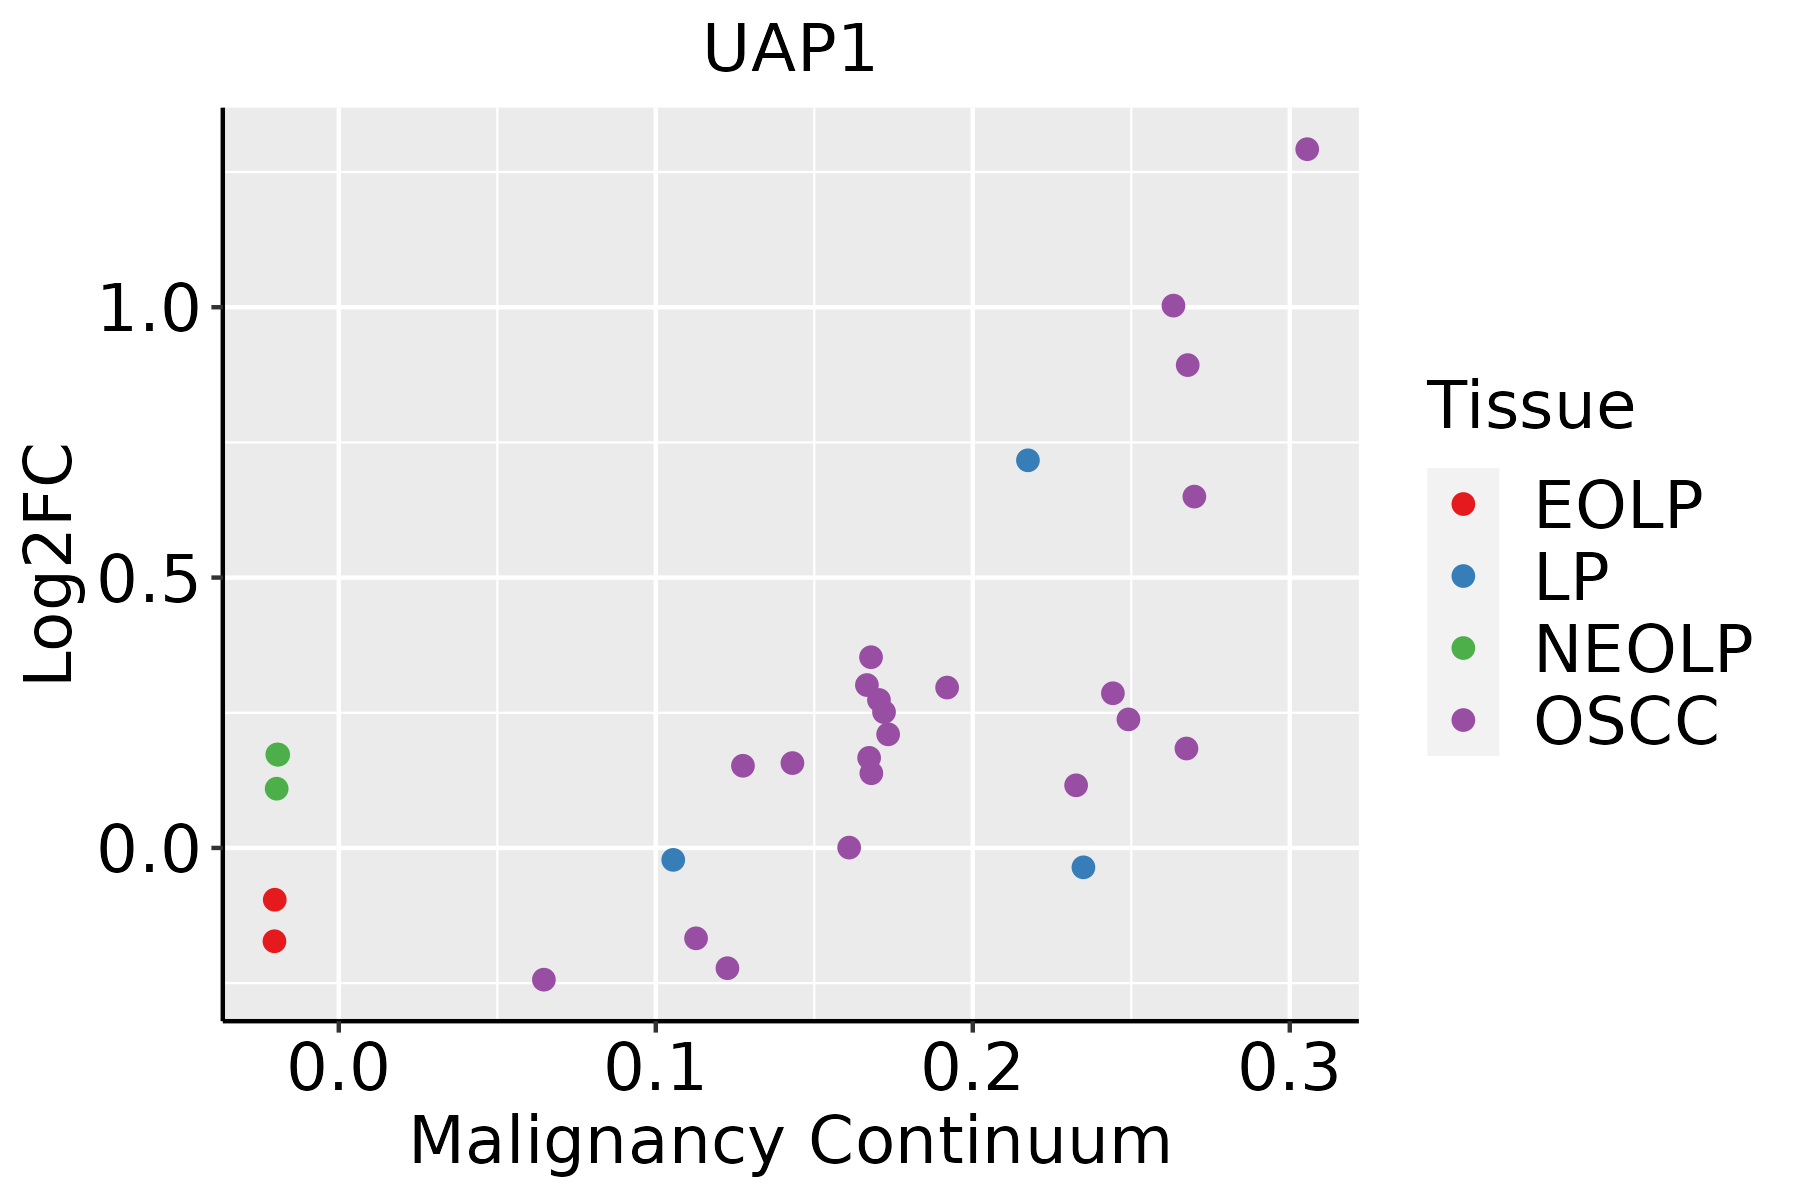 | EOLP: Erosive Oral lichen planus |
| LP: leukoplakia | ||
| NEOLP: Non-erosive oral lichen planus | ||
| OSCC: Oral squamous cell carcinoma | ||
| Prostate | 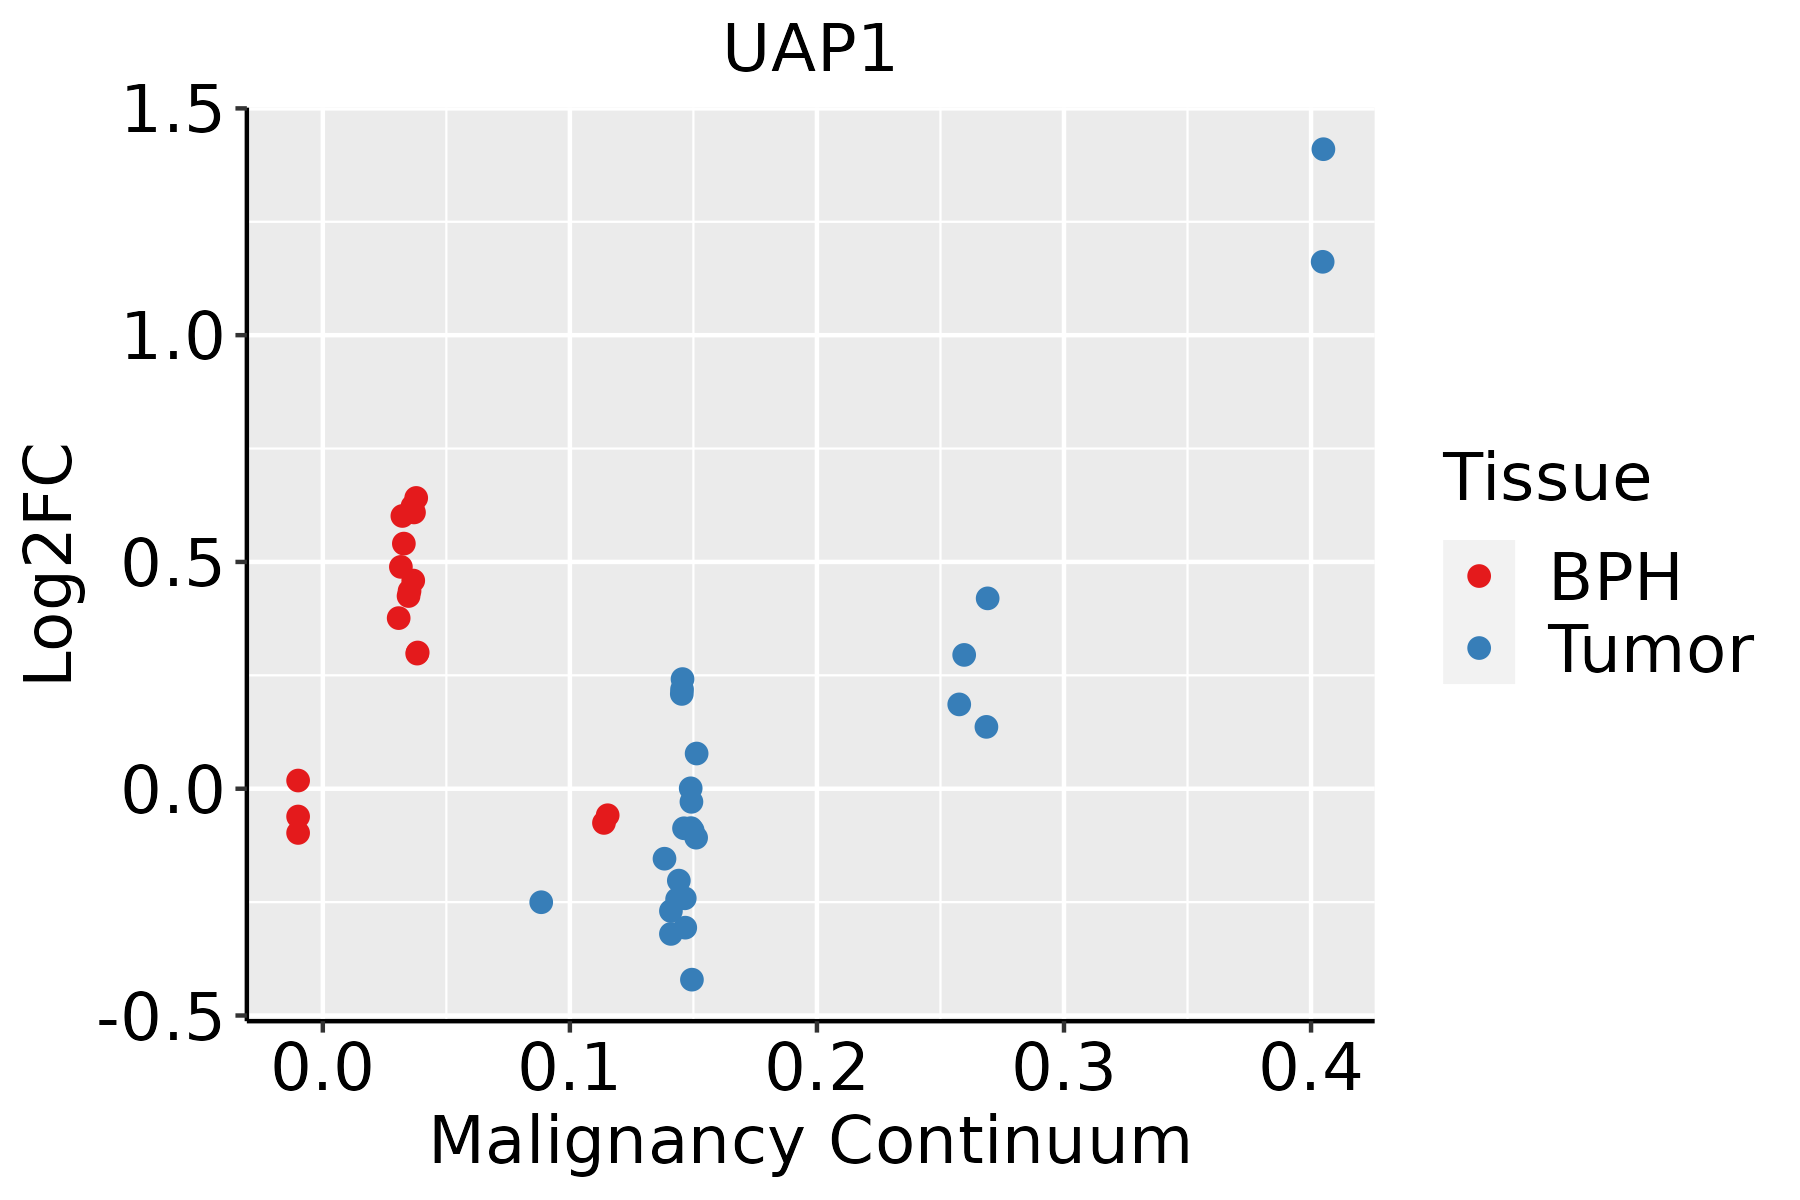 | BPH: Benign Prostatic Hyperplasia |
| Skin |  | AK: Actinic keratosis |
| cSCC: Cutaneous squamous cell carcinoma | ||
| SCCIS:squamous cell carcinoma in situ | ||
| Thyroid | 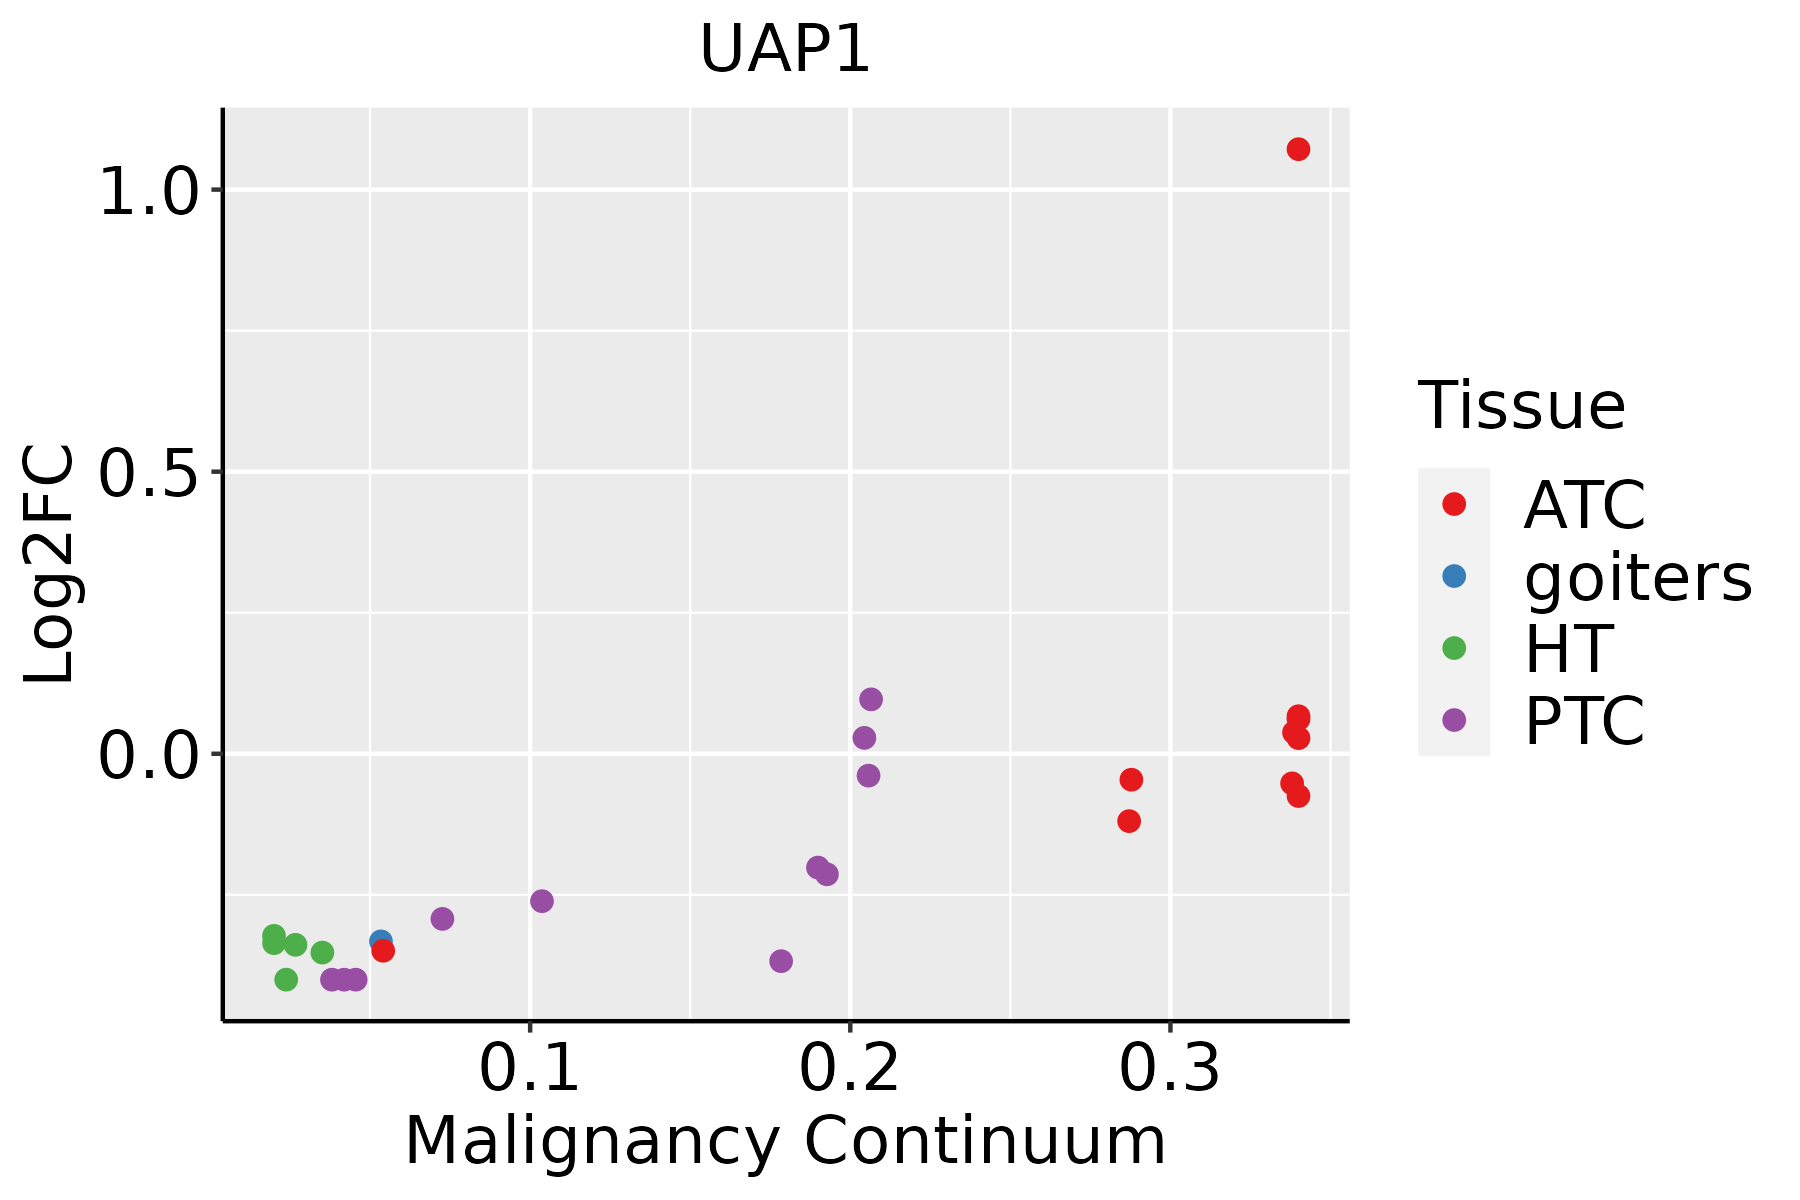 | ATC: Anaplastic thyroid cancer |
| HT: Hashimoto's thyroiditis | ||
| PTC: Papillary thyroid cancer |
| ∗log2FC in expression of this searched gene in stem-like cells from each diseased tissue sample relative to stem-like cells in normal samples in each tissue plotted against the malignancy continuum. Samples are colored based on if they are from different disease stage. |
Top |
Malignant transformation related pathway analysis |
| Find out the enriched GO biological processes and KEGG pathways involved in transition from healthy to precancer to cancer |
| Tissue | Disease Stage | Enriched GO biological Processes |
| Colorectum | AD |  |
| Colorectum | SER |  |
| Colorectum | MSS |  |
| Colorectum | MSI-H |  |
| Colorectum | FAP |  |
| ∗Top 15 enriched GO BP terms are showed in the bar plot of each disease state in each tissue. Each row represents a significant GO biological process which is colored according to the -log10(p.adjust). |
| Page: 1 2 3 4 5 6 7 8 9 |
| GO ID | Tissue | Disease Stage | Description | Gene Ratio | Bg Ratio | pvalue | p.adjust | Count |
| GO:00092256 | Esophagus | ESCC | nucleotide-sugar metabolic process | 29/8552 | 36/18723 | 1.91e-05 | 1.67e-04 | 29 |
| GO:00092262 | Esophagus | ESCC | nucleotide-sugar biosynthetic process | 14/8552 | 19/18723 | 1.27e-02 | 4.21e-02 | 14 |
| GO:00092254 | Liver | HCC | nucleotide-sugar metabolic process | 25/7958 | 36/18723 | 9.87e-04 | 5.71e-03 | 25 |
| GO:00092255 | Oral cavity | OSCC | nucleotide-sugar metabolic process | 26/7305 | 36/18723 | 5.44e-05 | 4.51e-04 | 26 |
| GO:00092261 | Oral cavity | OSCC | nucleotide-sugar biosynthetic process | 14/7305 | 19/18723 | 2.31e-03 | 1.02e-02 | 14 |
| GO:0006040 | Oral cavity | OSCC | amino sugar metabolic process | 24/7305 | 42/18723 | 1.30e-02 | 4.34e-02 | 24 |
| GO:0006047 | Oral cavity | OSCC | UDP-N-acetylglucosamine metabolic process | 10/7305 | 14/18723 | 1.44e-02 | 4.69e-02 | 10 |
| GO:0009226 | Prostate | Tumor | nucleotide-sugar biosynthetic process | 8/3246 | 19/18723 | 1.00e-02 | 4.20e-02 | 8 |
| GO:00092257 | Thyroid | PTC | nucleotide-sugar metabolic process | 23/5968 | 36/18723 | 7.78e-05 | 6.66e-04 | 23 |
| GO:00060472 | Thyroid | PTC | UDP-N-acetylglucosamine metabolic process | 9/5968 | 14/18723 | 1.27e-02 | 4.92e-02 | 9 |
| GO:000922511 | Thyroid | ATC | nucleotide-sugar metabolic process | 24/6293 | 36/18723 | 5.10e-05 | 3.99e-04 | 24 |
| GO:00060471 | Thyroid | ATC | UDP-N-acetylglucosamine metabolic process | 10/6293 | 14/18723 | 4.31e-03 | 1.80e-02 | 10 |
| GO:00092263 | Thyroid | ATC | nucleotide-sugar biosynthetic process | 12/6293 | 19/18723 | 7.97e-03 | 3.08e-02 | 12 |
| Page: 1 |
| Pathway ID | Tissue | Disease Stage | Description | Gene Ratio | Bg Ratio | pvalue | p.adjust | qvalue | Count |
| hsa012505 | Esophagus | ESCC | Biosynthesis of nucleotide sugars | 28/4205 | 37/8465 | 1.10e-03 | 3.42e-03 | 1.75e-03 | 28 |
| hsa005202 | Esophagus | ESCC | Amino sugar and nucleotide sugar metabolism | 35/4205 | 49/8465 | 1.60e-03 | 4.88e-03 | 2.50e-03 | 35 |
| hsa0125012 | Esophagus | ESCC | Biosynthesis of nucleotide sugars | 28/4205 | 37/8465 | 1.10e-03 | 3.42e-03 | 1.75e-03 | 28 |
| hsa0052011 | Esophagus | ESCC | Amino sugar and nucleotide sugar metabolism | 35/4205 | 49/8465 | 1.60e-03 | 4.88e-03 | 2.50e-03 | 35 |
| hsa00520 | Oral cavity | OSCC | Amino sugar and nucleotide sugar metabolism | 34/3704 | 49/8465 | 2.48e-04 | 8.08e-04 | 4.11e-04 | 34 |
| hsa012504 | Oral cavity | OSCC | Biosynthesis of nucleotide sugars | 25/3704 | 37/8465 | 2.93e-03 | 7.49e-03 | 3.81e-03 | 25 |
| hsa005201 | Oral cavity | OSCC | Amino sugar and nucleotide sugar metabolism | 34/3704 | 49/8465 | 2.48e-04 | 8.08e-04 | 4.11e-04 | 34 |
| hsa0125011 | Oral cavity | OSCC | Biosynthesis of nucleotide sugars | 25/3704 | 37/8465 | 2.93e-03 | 7.49e-03 | 3.81e-03 | 25 |
| Page: 1 |
Top |
Cell-cell communication analysis |
| Identification of potential cell-cell interactions between two cell types and their ligand-receptor pairs for different disease states |
| Ligand | Receptor | LRpair | Pathway | Tissue | Disease Stage |
| Page: 1 |
Top |
Single-cell gene regulatory network inference analysis |
| Find out the significant the regulons (TFs) and the target genes of each regulon across cell types for different disease states |
| TF | Cell Type | Tissue | Disease Stage | Target Gene | RSS | Regulon Activity |
| ∗The dot plots of a searched regulon are shown for all cell subpopulations in each disease state of each tissue based on the regulon specific score inferred using pySCENIC and by calculating the average expression. |
| Page: 1 |
Top |
Somatic mutation of malignant transformation related genes |
| Annotation of somatic variants for genes involved in malignant transformation |
| Hugo Symbol | Variant Class | Variant Classification | dbSNP RS | HGVSc | HGVSp | HGVSp Short | SWISSPROT | BIOTYPE | SIFT | PolyPhen | Tumor Sample Barcode | Tissue | Histology | Sex | Age | Stage | Therapy Types | Drugs | Outcome |
| UAP1 | SNV | Missense_Mutation | c.127G>A | p.Glu43Lys | p.E43K | Q16222 | protein_coding | tolerated(0.31) | benign(0.063) | TCGA-AC-A23H-01 | Breast | breast invasive carcinoma | Female | >=65 | I/II | Unknown | Unknown | PD | |
| UAP1 | SNV | Missense_Mutation | novel | c.996C>A | p.Phe332Leu | p.F332L | Q16222 | protein_coding | tolerated(0.05) | benign(0.12) | TCGA-AN-A046-01 | Breast | breast invasive carcinoma | Female | >=65 | I/II | Unknown | Unknown | SD |
| UAP1 | insertion | Frame_Shift_Ins | novel | c.1229_1230insAATTTTCTTT | p.Asp410GlufsTer5 | p.D410Efs*5 | Q16222 | protein_coding | TCGA-A7-A26I-01 | Breast | breast invasive carcinoma | Female | >=65 | I/II | Chemotherapy | cytoxan | SD | ||
| UAP1 | deletion | Frame_Shift_Del | novel | c.1231_1232delNN | p.Gln412GlufsTer31 | p.Q412Efs*31 | Q16222 | protein_coding | TCGA-A7-A26I-01 | Breast | breast invasive carcinoma | Female | >=65 | I/II | Chemotherapy | cytoxan | SD | ||
| UAP1 | insertion | In_Frame_Ins | novel | c.723_724insAACTTTTTC | p.Gln241_Arg242insAsnPhePhe | p.Q241_R242insNFF | Q16222 | protein_coding | TCGA-B6-A0IE-01 | Breast | breast invasive carcinoma | Female | <65 | III/IV | Unknown | Unknown | PD | ||
| UAP1 | insertion | Frame_Shift_Ins | novel | c.725_726insATTC | p.Gly243PhefsTer12 | p.G243Ffs*12 | Q16222 | protein_coding | TCGA-B6-A0IE-01 | Breast | breast invasive carcinoma | Female | <65 | III/IV | Unknown | Unknown | PD | ||
| UAP1 | deletion | In_Frame_Del | novel | c.1319_1339delNNNNNNNNNNNNNNNNNNNNN | p.Phe440_Arg447delinsCys | p.F440_R447delinsC | Q16222 | protein_coding | TCGA-B6-A400-01 | Breast | breast invasive carcinoma | Female | <65 | III/IV | Unknown | Unknown | SD | ||
| UAP1 | SNV | Missense_Mutation | novel | c.1501A>G | p.Lys501Glu | p.K501E | Q16222 | protein_coding | deleterious(0.03) | benign(0.021) | TCGA-DG-A2KK-01 | Cervix | cervical & endocervical cancer | Female | <65 | III/IV | Chemotherapy | cisplatin | SD |
| UAP1 | SNV | Missense_Mutation | c.1449N>G | p.Ile483Met | p.I483M | Q16222 | protein_coding | deleterious(0) | probably_damaging(0.935) | TCGA-DR-A0ZM-01 | Cervix | cervical & endocervical cancer | Female | <65 | III/IV | Unspecific | Cisplatin | SD | |
| UAP1 | SNV | Missense_Mutation | c.1504G>A | p.Glu502Lys | p.E502K | Q16222 | protein_coding | tolerated(0.31) | benign(0) | TCGA-EK-A2PG-01 | Cervix | cervical & endocervical cancer | Female | >=65 | I/II | Unknown | Unknown | SD |
| Page: 1 2 3 4 5 6 7 |
Top |
Related drugs of malignant transformation related genes |
| Identification of chemicals and drugs interact with genes involved in malignant transfromation |
| (DGIdb 4.0) |
| Entrez ID | Symbol | Category | Interaction Types | Drug Claim Name | Drug Name | PMIDs |
| Page: 1 |

Copyright 2023-Present -The University of Texas Health Science Center at Houston |