
|
|||||
|
 | |
| |
| |
| |
| |
| |
|
Gene: U2SURP |
Gene summary for U2SURP |
| Gene information | Species | Human | Gene symbol | U2SURP | Gene ID | 23350 |
| Gene name | U2 snRNP associated SURP domain containing | |
| Gene Alias | SR140 | |
| Cytomap | 3q23 | |
| Gene Type | protein-coding | GO ID | GO:0006139 | UniProtAcc | O15042 |
Top |
Malignant transformation analysis |
| Identification of the aberrant gene expression in precancerous and cancerous lesions by comparing the gene expression of stem-like cells in diseased tissues with normal stem cells |
| Entrez ID | Symbol | Replicates | Species | Organ | Tissue | Adj P-value | Log2FC | Malignancy |
| 23350 | U2SURP | P126T-E | Human | Esophagus | ESCC | 3.29e-15 | 1.66e+00 | 0.1125 |
| 23350 | U2SURP | P127T-E | Human | Esophagus | ESCC | 4.67e-37 | 8.13e-01 | 0.0826 |
| 23350 | U2SURP | P128T-E | Human | Esophagus | ESCC | 3.28e-52 | 1.80e+00 | 0.1241 |
| 23350 | U2SURP | P130T-E | Human | Esophagus | ESCC | 1.45e-103 | 2.26e+00 | 0.1676 |
| 23350 | U2SURP | S43 | Human | Liver | Cirrhotic | 3.07e-06 | -3.10e-01 | -0.0187 |
| 23350 | U2SURP | HCC1_Meng | Human | Liver | HCC | 2.79e-80 | 2.43e-01 | 0.0246 |
| 23350 | U2SURP | HCC2_Meng | Human | Liver | HCC | 9.76e-36 | 1.17e-01 | 0.0107 |
| 23350 | U2SURP | cirrhotic1 | Human | Liver | Cirrhotic | 2.34e-08 | 2.11e-01 | 0.0202 |
| 23350 | U2SURP | cirrhotic2 | Human | Liver | Cirrhotic | 3.97e-02 | 4.44e-02 | 0.0201 |
| 23350 | U2SURP | p6 | Human | Liver | Cyst | 3.59e-02 | -3.95e-01 | -0.0218 |
| 23350 | U2SURP | HCC1 | Human | Liver | HCC | 2.11e-11 | 5.20e+00 | 0.5336 |
| 23350 | U2SURP | HCC2 | Human | Liver | HCC | 5.97e-34 | 5.55e+00 | 0.5341 |
| 23350 | U2SURP | Pt13.b | Human | Liver | HCC | 7.39e-12 | 1.62e-01 | 0.0251 |
| 23350 | U2SURP | Pt13.c | Human | Liver | HCC | 1.89e-02 | -1.96e-01 | 0.0076 |
| 23350 | U2SURP | Pt14.a | Human | Liver | HCC | 8.55e-06 | 4.13e-01 | 0.0169 |
| 23350 | U2SURP | Pt14.b | Human | Liver | HCC | 3.05e-05 | 2.57e-01 | 0.018 |
| 23350 | U2SURP | S014 | Human | Liver | HCC | 8.64e-17 | 1.25e+00 | 0.2254 |
| 23350 | U2SURP | S015 | Human | Liver | HCC | 1.29e-20 | 1.69e+00 | 0.2375 |
| 23350 | U2SURP | S016 | Human | Liver | HCC | 1.47e-21 | 1.35e+00 | 0.2243 |
| 23350 | U2SURP | S027 | Human | Liver | HCC | 1.09e-06 | 1.16e+00 | 0.2446 |
| Page: 1 2 3 4 5 6 7 8 9 10 |
| Tissue | Expression Dynamics | Abbreviation |
| Endometrium | 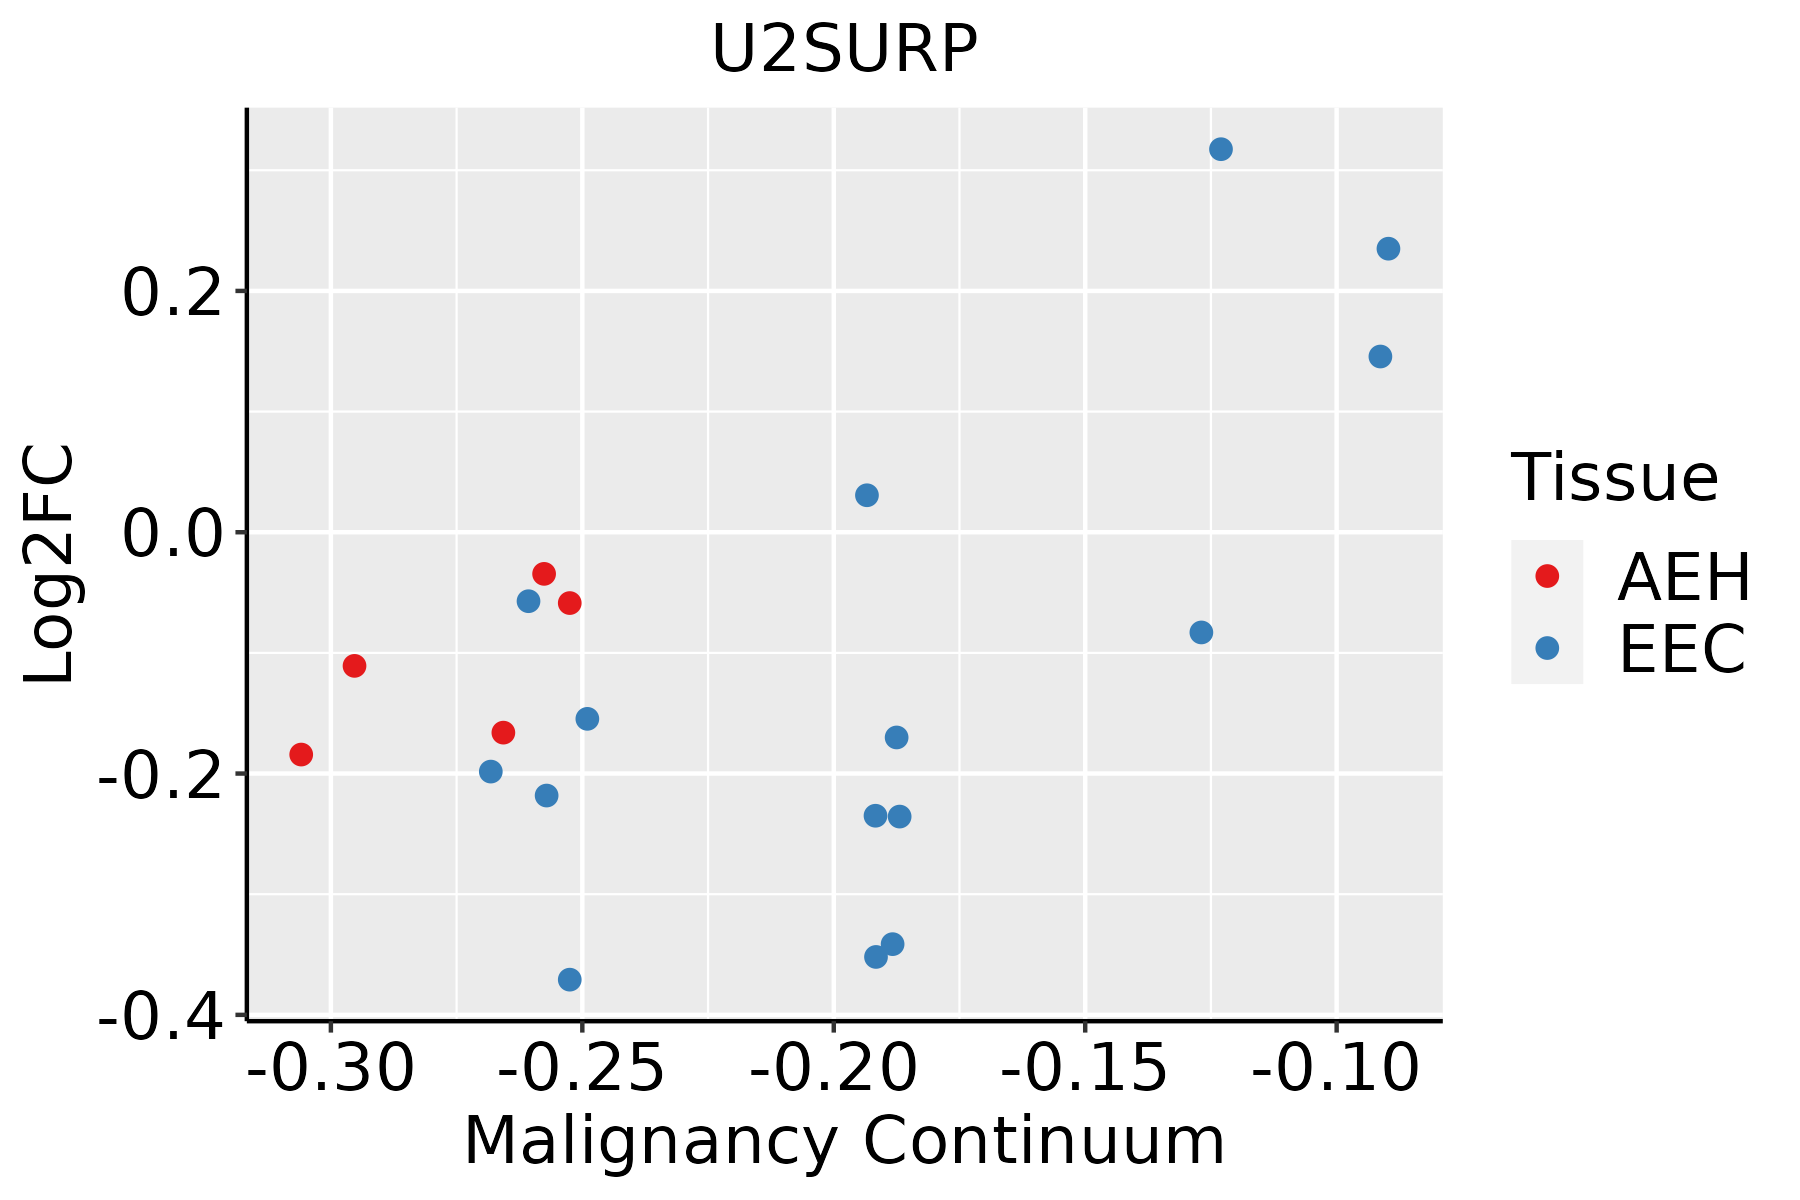 | AEH: Atypical endometrial hyperplasia |
| EEC: Endometrioid Cancer | ||
| Esophagus | 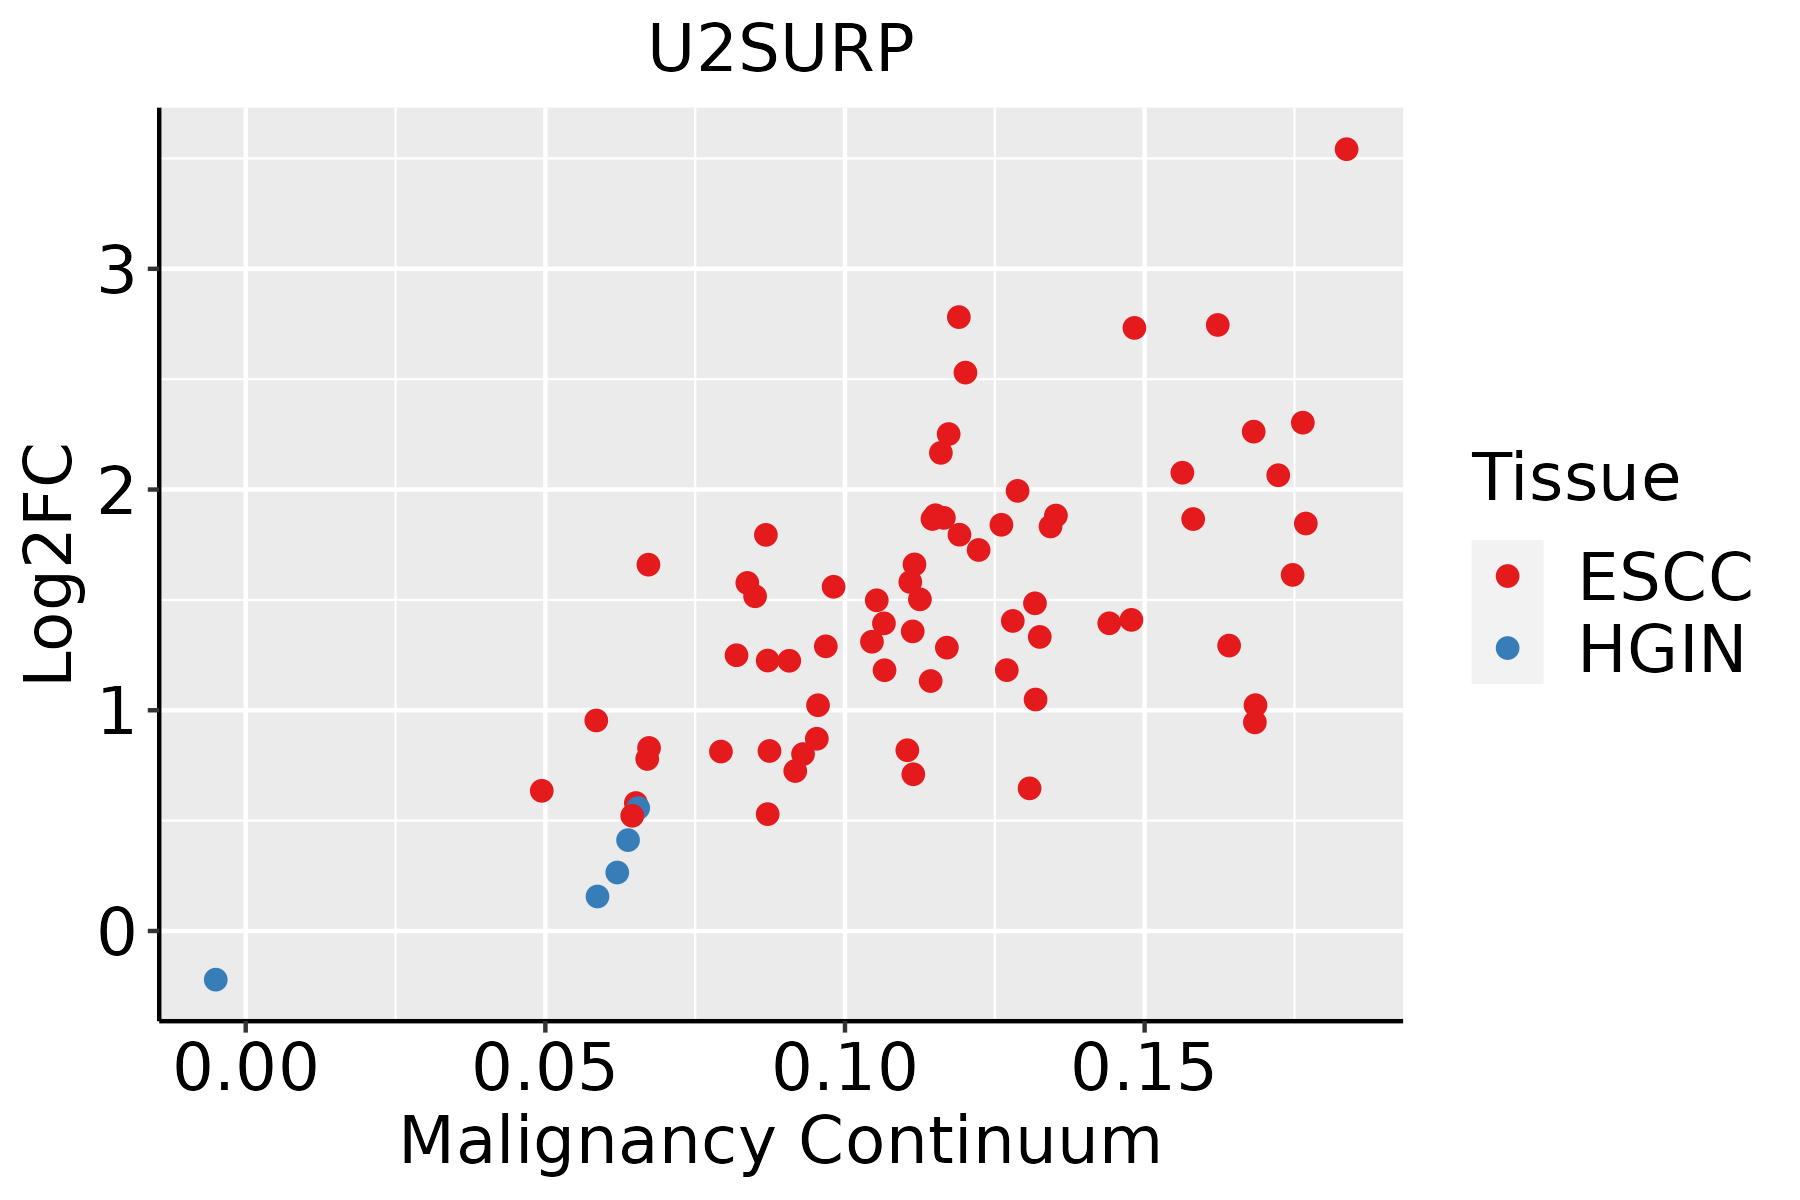 | ESCC: Esophageal squamous cell carcinoma |
| HGIN: High-grade intraepithelial neoplasias | ||
| LGIN: Low-grade intraepithelial neoplasias | ||
| Liver |  | HCC: Hepatocellular carcinoma |
| NAFLD: Non-alcoholic fatty liver disease | ||
| Oral Cavity |  | EOLP: Erosive Oral lichen planus |
| LP: leukoplakia | ||
| NEOLP: Non-erosive oral lichen planus | ||
| OSCC: Oral squamous cell carcinoma | ||
| Prostate | 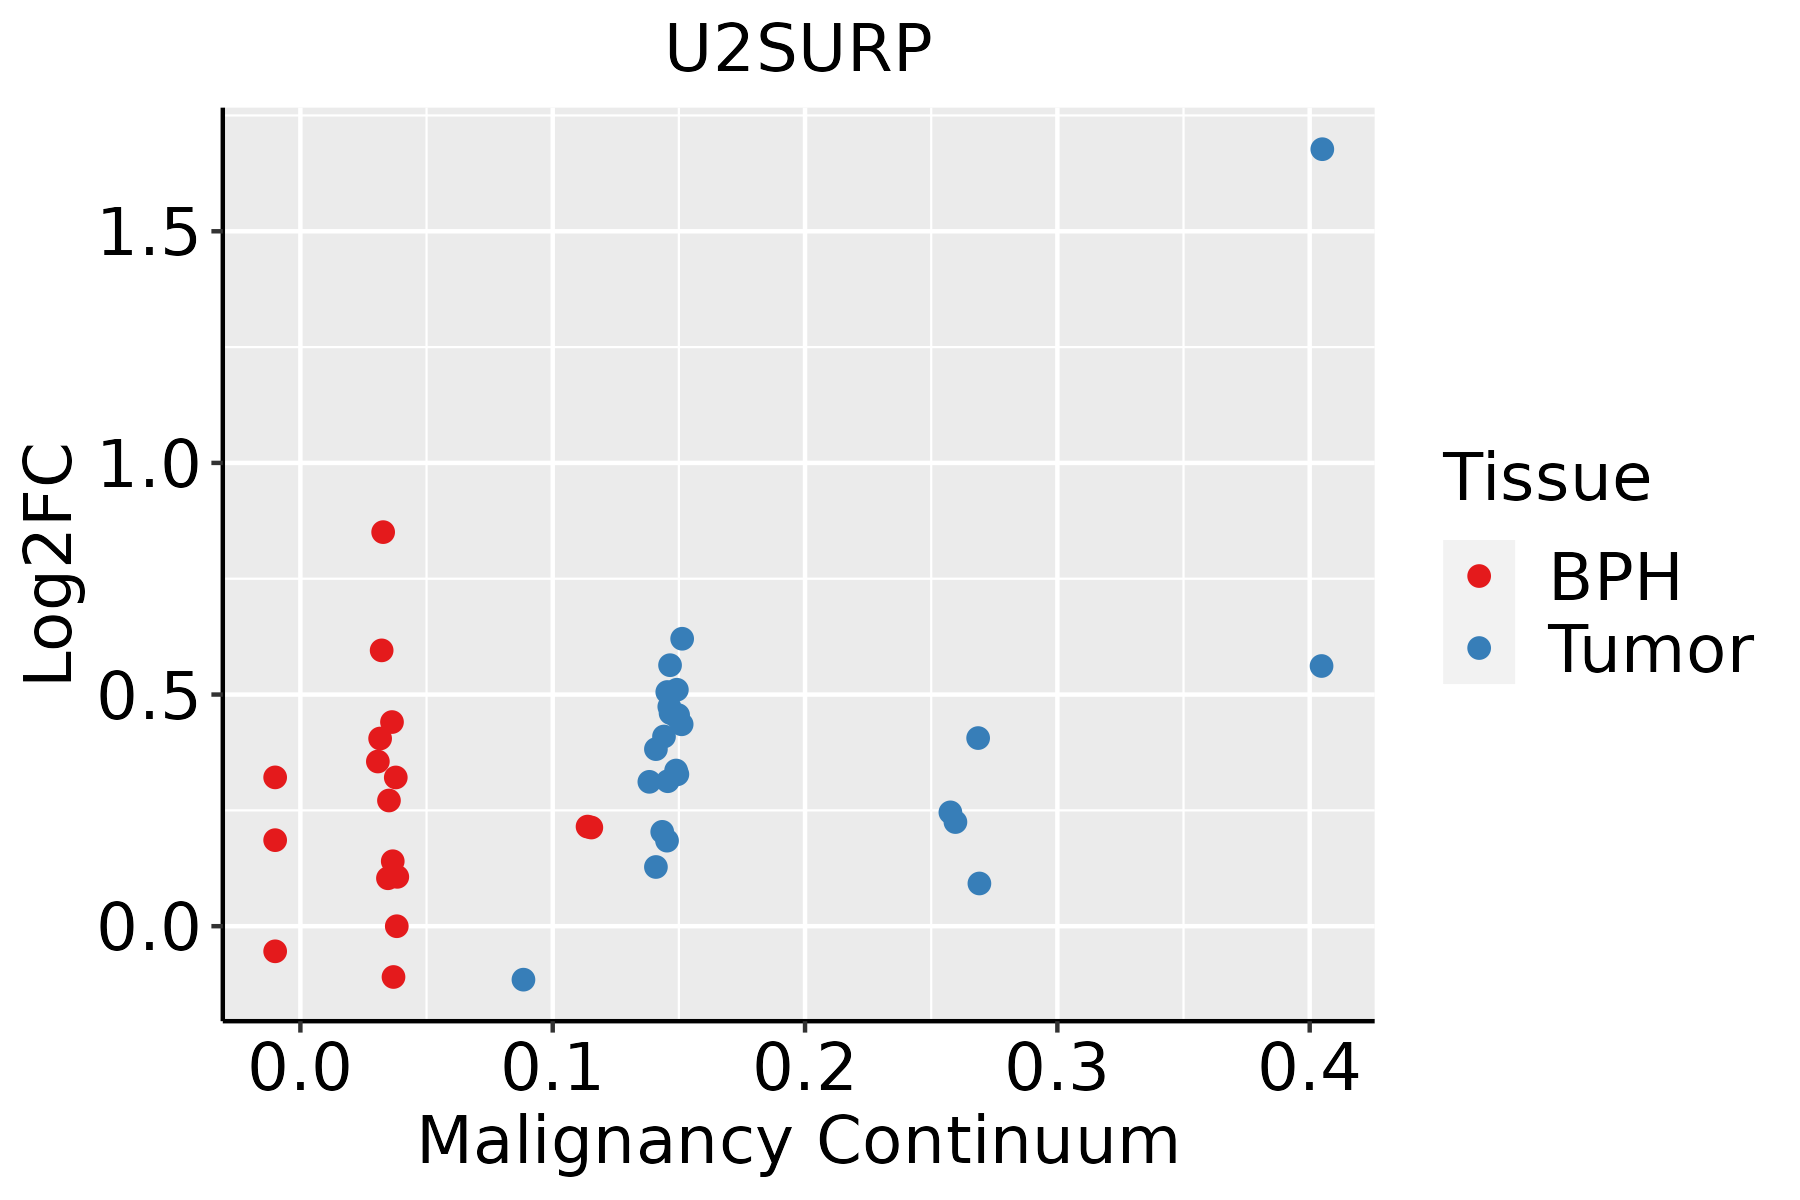 | BPH: Benign Prostatic Hyperplasia |
| Skin | 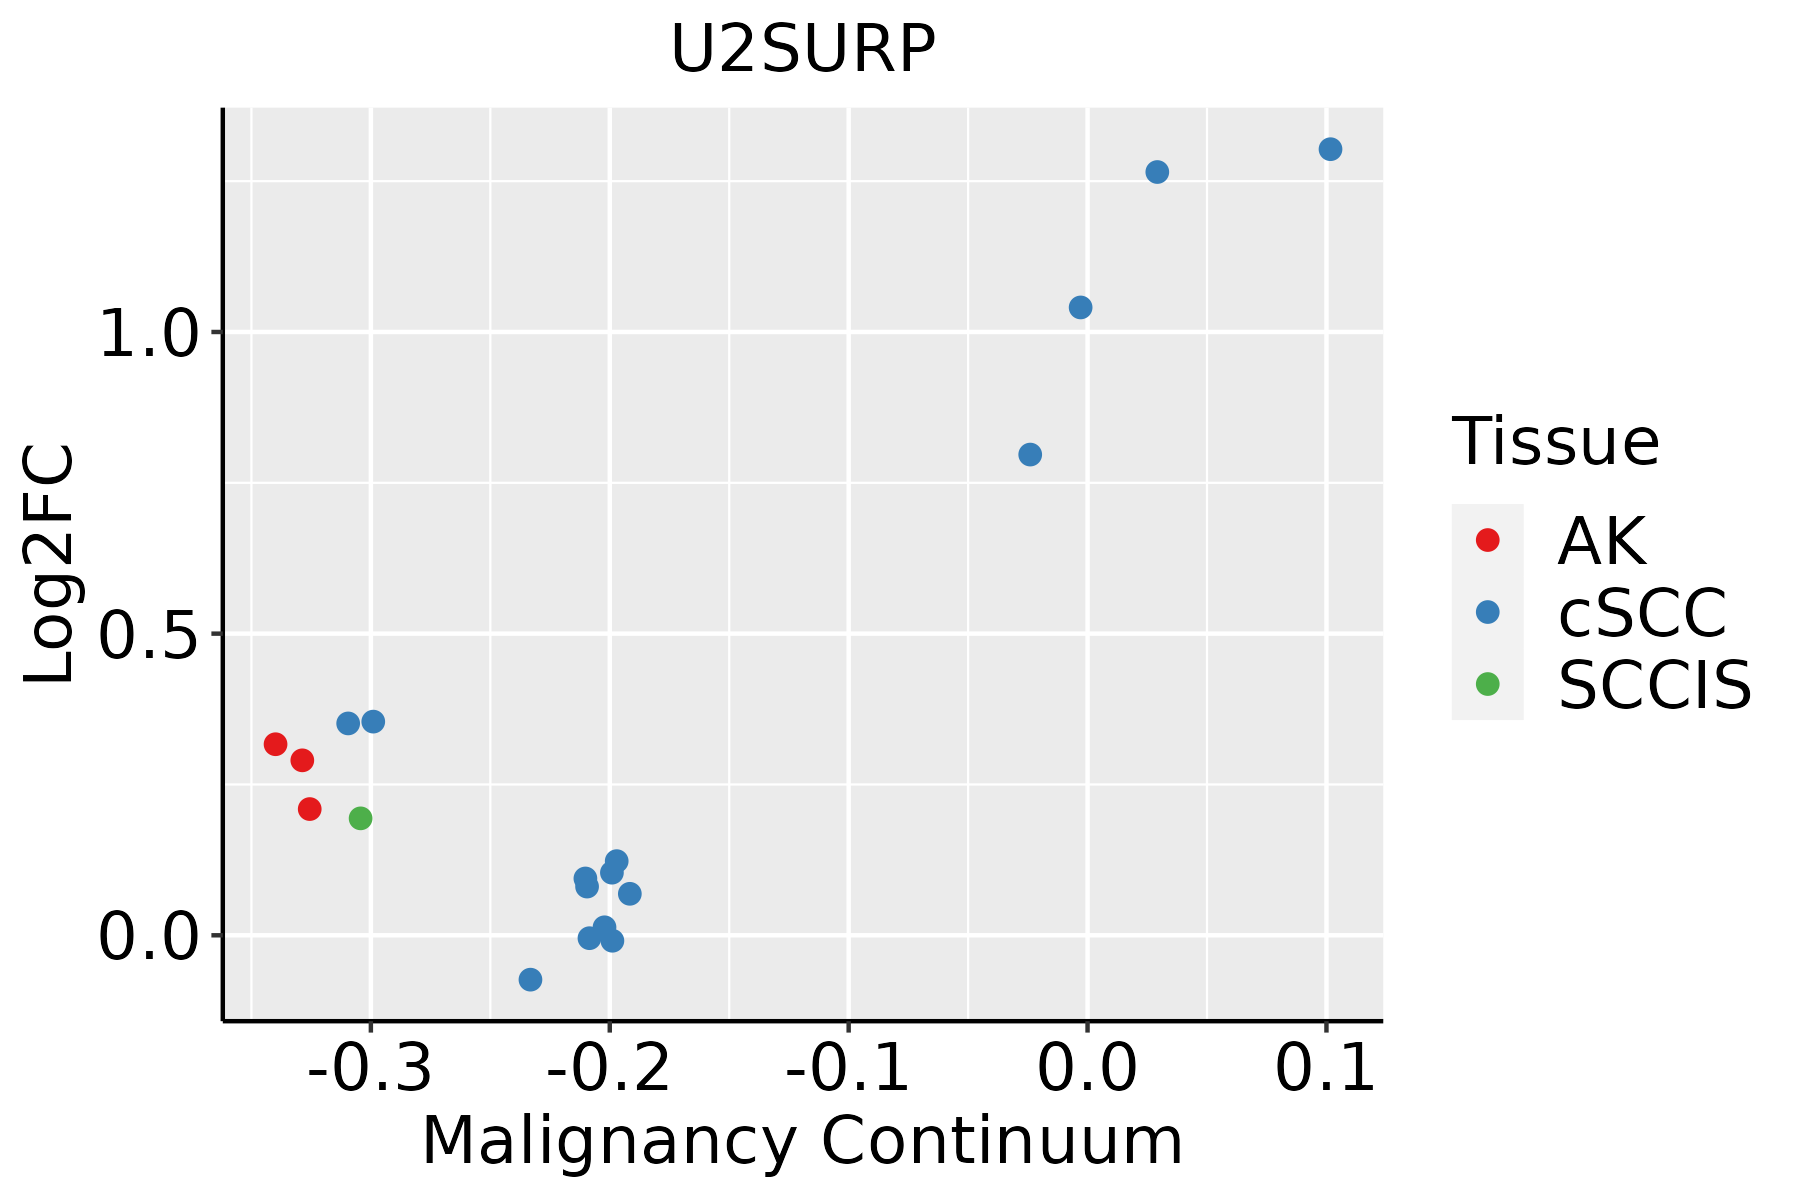 | AK: Actinic keratosis |
| cSCC: Cutaneous squamous cell carcinoma | ||
| SCCIS:squamous cell carcinoma in situ | ||
| Thyroid | 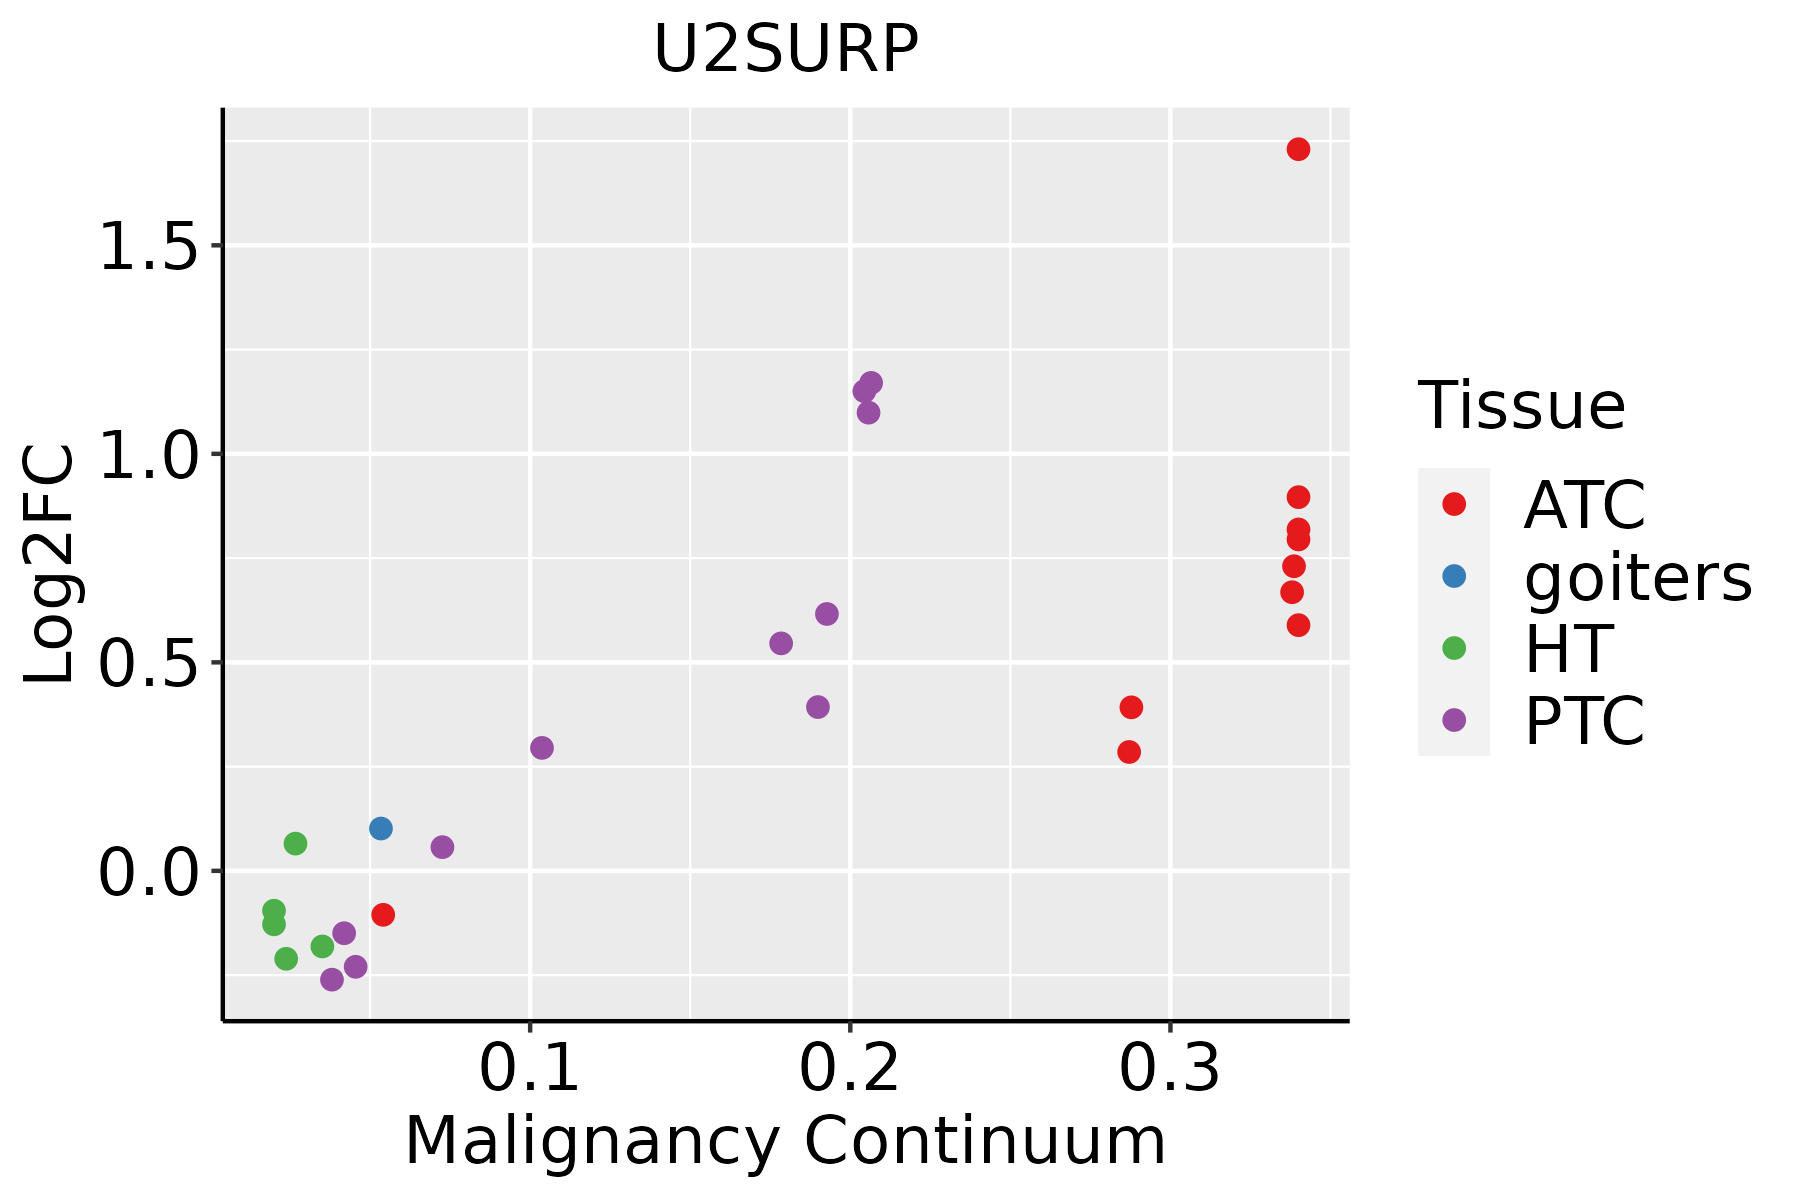 | ATC: Anaplastic thyroid cancer |
| HT: Hashimoto's thyroiditis | ||
| PTC: Papillary thyroid cancer |
| ∗log2FC in expression of this searched gene in stem-like cells from each diseased tissue sample relative to stem-like cells in normal samples in each tissue plotted against the malignancy continuum. Samples are colored based on if they are from different disease stage. |
Top |
Malignant transformation related pathway analysis |
| Find out the enriched GO biological processes and KEGG pathways involved in transition from healthy to precancer to cancer |
| Tissue | Disease Stage | Enriched GO biological Processes |
| Colorectum | AD |  |
| Colorectum | SER |  |
| Colorectum | MSS |  |
| Colorectum | MSI-H |  |
| Colorectum | FAP |  |
| ∗Top 15 enriched GO BP terms are showed in the bar plot of each disease state in each tissue. Each row represents a significant GO biological process which is colored according to the -log10(p.adjust). |
| Page: 1 2 3 4 5 6 7 8 9 |
| GO ID | Tissue | Disease Stage | Description | Gene Ratio | Bg Ratio | pvalue | p.adjust | Count |
| Page: 1 |
| Pathway ID | Tissue | Disease Stage | Description | Gene Ratio | Bg Ratio | pvalue | p.adjust | qvalue | Count |
| hsa030409 | Endometrium | AEH | Spliceosome | 54/1197 | 217/8465 | 1.47e-05 | 1.65e-04 | 1.21e-04 | 54 |
| hsa0304014 | Endometrium | AEH | Spliceosome | 54/1197 | 217/8465 | 1.47e-05 | 1.65e-04 | 1.21e-04 | 54 |
| hsa0304024 | Endometrium | EEC | Spliceosome | 54/1237 | 217/8465 | 3.78e-05 | 3.88e-04 | 2.89e-04 | 54 |
| hsa0304034 | Endometrium | EEC | Spliceosome | 54/1237 | 217/8465 | 3.78e-05 | 3.88e-04 | 2.89e-04 | 54 |
| hsa0304018 | Esophagus | HGIN | Spliceosome | 79/1383 | 217/8465 | 3.22e-13 | 7.00e-12 | 5.56e-12 | 79 |
| hsa0304019 | Esophagus | HGIN | Spliceosome | 79/1383 | 217/8465 | 3.22e-13 | 7.00e-12 | 5.56e-12 | 79 |
| hsa0304027 | Esophagus | ESCC | Spliceosome | 128/4205 | 217/8465 | 3.31e-03 | 8.79e-03 | 4.50e-03 | 128 |
| hsa0304037 | Esophagus | ESCC | Spliceosome | 128/4205 | 217/8465 | 3.31e-03 | 8.79e-03 | 4.50e-03 | 128 |
| hsa030407 | Liver | Cirrhotic | Spliceosome | 102/2530 | 217/8465 | 5.69e-08 | 9.47e-07 | 5.84e-07 | 102 |
| hsa0304012 | Liver | Cirrhotic | Spliceosome | 102/2530 | 217/8465 | 5.69e-08 | 9.47e-07 | 5.84e-07 | 102 |
| hsa0304022 | Liver | HCC | Spliceosome | 122/4020 | 217/8465 | 5.55e-03 | 1.60e-02 | 8.91e-03 | 122 |
| hsa0304032 | Liver | HCC | Spliceosome | 122/4020 | 217/8465 | 5.55e-03 | 1.60e-02 | 8.91e-03 | 122 |
| hsa0304016 | Oral cavity | OSCC | Spliceosome | 123/3704 | 217/8465 | 7.21e-05 | 2.74e-04 | 1.40e-04 | 123 |
| hsa0304017 | Oral cavity | OSCC | Spliceosome | 123/3704 | 217/8465 | 7.21e-05 | 2.74e-04 | 1.40e-04 | 123 |
| hsa0304026 | Oral cavity | LP | Spliceosome | 106/2418 | 217/8465 | 1.30e-10 | 2.40e-09 | 1.55e-09 | 106 |
| hsa0304036 | Oral cavity | LP | Spliceosome | 106/2418 | 217/8465 | 1.30e-10 | 2.40e-09 | 1.55e-09 | 106 |
| hsa0304010 | Prostate | BPH | Spliceosome | 62/1718 | 217/8465 | 1.99e-03 | 7.92e-03 | 4.90e-03 | 62 |
| hsa0304015 | Prostate | BPH | Spliceosome | 62/1718 | 217/8465 | 1.99e-03 | 7.92e-03 | 4.90e-03 | 62 |
| hsa0304025 | Prostate | Tumor | Spliceosome | 66/1791 | 217/8465 | 7.53e-04 | 3.59e-03 | 2.23e-03 | 66 |
| hsa0304035 | Prostate | Tumor | Spliceosome | 66/1791 | 217/8465 | 7.53e-04 | 3.59e-03 | 2.23e-03 | 66 |
| Page: 1 |
Top |
Cell-cell communication analysis |
| Identification of potential cell-cell interactions between two cell types and their ligand-receptor pairs for different disease states |
| Ligand | Receptor | LRpair | Pathway | Tissue | Disease Stage |
| Page: 1 |
Top |
Single-cell gene regulatory network inference analysis |
| Find out the significant the regulons (TFs) and the target genes of each regulon across cell types for different disease states |
| TF | Cell Type | Tissue | Disease Stage | Target Gene | RSS | Regulon Activity |
| ∗The dot plots of a searched regulon are shown for all cell subpopulations in each disease state of each tissue based on the regulon specific score inferred using pySCENIC and by calculating the average expression. |
| Page: 1 |
Top |
Somatic mutation of malignant transformation related genes |
| Annotation of somatic variants for genes involved in malignant transformation |
| Hugo Symbol | Variant Class | Variant Classification | dbSNP RS | HGVSc | HGVSp | HGVSp Short | SWISSPROT | BIOTYPE | SIFT | PolyPhen | Tumor Sample Barcode | Tissue | Histology | Sex | Age | Stage | Therapy Types | Drugs | Outcome |
| U2SURP | SNV | Missense_Mutation | c.1931A>G | p.Glu644Gly | p.E644G | O15042 | protein_coding | deleterious(0) | probably_damaging(0.962) | TCGA-EW-A1P4-01 | Breast | breast invasive carcinoma | Female | <65 | I/II | Chemotherapy | docetaxel | SD | |
| U2SURP | SNV | Missense_Mutation | c.3087N>A | p.His1029Gln | p.H1029Q | O15042 | protein_coding | deleterious_low_confidence(0.01) | possibly_damaging(0.88) | TCGA-GM-A2DH-01 | Breast | breast invasive carcinoma | Female | <65 | I/II | Chemotherapy | taxol | CR | |
| U2SURP | SNV | Missense_Mutation | novel | c.1663N>C | p.Asp555His | p.D555H | O15042 | protein_coding | tolerated(0.06) | possibly_damaging(0.783) | TCGA-LL-A73Y-01 | Breast | breast invasive carcinoma | Female | >=65 | I/II | Chemotherapy | taxotere | SD |
| U2SURP | deletion | Frame_Shift_Del | c.1979delN | p.Ala661GlnfsTer8 | p.A661Qfs*8 | O15042 | protein_coding | TCGA-D8-A1XQ-01 | Breast | breast invasive carcinoma | Female | >=65 | I/II | Unknown | Unknown | SD | |||
| U2SURP | deletion | Frame_Shift_Del | novel | c.1569delN | p.Phe524LeufsTer2 | p.F524Lfs*2 | O15042 | protein_coding | TCGA-EW-A2FV-01 | Breast | breast invasive carcinoma | Female | <65 | III/IV | Chemotherapy | docetaxel | SD | ||
| U2SURP | SNV | Missense_Mutation | novel | c.1739C>T | p.Ser580Leu | p.S580L | O15042 | protein_coding | deleterious(0) | probably_damaging(0.992) | TCGA-2W-A8YY-01 | Cervix | cervical & endocervical cancer | Female | <65 | I/II | Chemotherapy | cisplatin | CR |
| U2SURP | SNV | Missense_Mutation | c.397N>G | p.Lys133Glu | p.K133E | O15042 | protein_coding | deleterious(0) | probably_damaging(0.992) | TCGA-DR-A0ZM-01 | Cervix | cervical & endocervical cancer | Female | <65 | III/IV | Unspecific | Cisplatin | SD | |
| U2SURP | SNV | Missense_Mutation | c.205N>T | p.His69Tyr | p.H69Y | O15042 | protein_coding | deleterious_low_confidence(0.02) | possibly_damaging(0.478) | TCGA-FU-A5XV-01 | Cervix | cervical & endocervical cancer | Female | <65 | III/IV | Unknown | Unknown | SD | |
| U2SURP | SNV | Missense_Mutation | c.94N>C | p.Asp32His | p.D32H | O15042 | protein_coding | tolerated_low_confidence(0.23) | probably_damaging(0.969) | TCGA-HM-A4S6-01 | Cervix | cervical & endocervical cancer | Female | <65 | III/IV | Chemotherapy | cisplatin | CR | |
| U2SURP | SNV | Missense_Mutation | c.1903N>T | p.Arg635Cys | p.R635C | O15042 | protein_coding | deleterious(0.02) | possibly_damaging(0.673) | TCGA-A6-2671-01 | Colorectum | colon adenocarcinoma | Male | >=65 | III/IV | Other, specify in notesProtocol AMG 20060464 | study | PD |
| Page: 1 2 3 4 5 6 7 8 9 10 11 12 |
Top |
Related drugs of malignant transformation related genes |
| Identification of chemicals and drugs interact with genes involved in malignant transfromation |
| (DGIdb 4.0) |
| Entrez ID | Symbol | Category | Interaction Types | Drug Claim Name | Drug Name | PMIDs |
| Page: 1 |

Copyright 2023-Present -The University of Texas Health Science Center at Houston |